
Skeleton Line Extraction Method in the Areas with Dense Junctions
Considering Stroke Features
Pengda Wu, Yong Yin and Chengming Li
Chinese Academy of Surveying and Mapping, Lianhuachi West Road, Beijing, China
Keywords: Areas with Dense Junctions, Skeleton Line, Stroke Features, Long-edge Adaptive Node Densification and
Type III Triangles Aggregation.
Abstract: Polygon skeleton line extraction is a key and difficult problem in map generalization. Aiming at the problem
that the traditional method is difficult to maintain the main structure and extension characteristics when
dealing with areas with dense junctions, a method for extracting skeleton lines in areas with dense junctions
considering stroke features is proposed in this study. Firstly, a long-edge adaptive node densification
algorithm is put forward to construct boundary-constrained Delaunay triangulation for extracting the initial
skeleton line. Then, Type III triangles are automatically identified as the basic unit. According to the local
width feature, Type III triangles aggregation is achieved to obtain the areas with dense junctions. Finally, we
define the connecting arc and evaluate their importance. The stroke is iteratively constructed according to the
importance of the arc, and the good continuity feature of the stroke is used to optimize the skeleton line. The
actual water system data of Jiangsu Province are used to verify the results. The experimental results show that
the proposed method can better identify the areas with dense junctions, and the extracted skeleton line is
naturally smooth and well connected, which accurately reflects the main structure of the area.
1 INTRODUCTION
Ai (2002) believe that the extraction of skeleton lines
is a key step to realize the comprehensive operation of
maps such as polygon dimensionality reduction and
split melting. The extraction of skeleton lines takes into
account the shape features of polygons and
summarizes the main body structure and extension
characteristics of polygons. It shall meet the human
visual cognition while conforming to the drawing
specifications. Therefore, how to accurately and
reasonably determine the skeleton line has always been
a difficult point of research (Ai, 2010). There are three
common methods for extracting skeleton lines: round
skeleton line (LEE, 1982), straight skeleton line (Das
et al, 2010) and skeleton line based on Delaunay
triangulation (Cao et al.2015; Sintunata et al., 2016).
Delaunay triangulation with “circular rule” or
“maximum/minimum angle rule” has become a
method of skeleton line extraction widely used by
researchers (Ware, 1997), and the research in this paper
also falls within this scope.
DeLucia et al. (1987) first proposed a skeleton line
extraction method based on boundary constrained
Delaunay triangulation (CDT) ; Zou et al. (2001) used
this method to construct a polygonal skeleton and
proved the effectiveness of this method . Li et al.
(2006) attempted to apply this method to extract the
main skeleton line of the polygon and achieved good
results. However, in the course of research, some
scholars have also found some problems, e.g.,
Penninga et al. (2005) pointed out that the skeleton line
extracted based on Delaunay triangulation has at least
the following three aspects: (1) at the branch
connection point, skeleton lines present “saw tooth”;
(2) tiny bumps on the boundary result in the formation
of redundant “spike” skeleton lines; (3) fewer
boundary nodes cause the end split line to be elongated
and offset. Accordingly, Jones et al. (1995), Uitermark
et al. (1999) and Penninga et al. (2005) proposed to use
the branch skeleton line direction, boundary
simplification, densification boundary nodes and other
methods to modify the proposed skeleton line, which
have better solved the above problem. However, these
methods are only applicable to simple polygons with
regular shapes and flattened boundaries. Haunert et al.
(2008) have studied a large number of road data and
found that when dealing with polygons with irregular
shapes or complex branching convergence features,
existing methods are difficult to maintain the main
Wu, P., Yin, Y. and Li, C.
Skeleton Line Extraction Method in the Areas with Dense Junctions Considering Stroke Features.
DOI: 10.5220/0007712601930200
In Proceedings of the 5th International Conference on Geographical Information Systems Theory, Applications and Management (GISTAM 2019), pages 193-200
ISBN: 978-989-758-371-1
Copyright
c
2019 by SCITEPRESS – Science and Technology Publications, Lda. All rights reserved
193

structure and extension characteristics at this place. Li
et al. (2018) made a preliminary exploration of the
skeleton line extraction in the areas with many
junctions, but the method relies on the skeleton line
direction and the branch gathering distance
characteristics, so that it is still unable to handle
complex area with dense junctions.
On this bases, according to the existing research, a
method of extracting the skeleton line of the areas with
dense junctions considering the stroke features is
proposed to optimize the extraction effect of the
skeleton line of the complex branch convergence.
2 RELATED WORKS
2.1 Existing Extraction Method of
Skeleton Line
Li et al. (2018) proposed a method for extracting
skeleton lines from narrow long map-spot branch
convergence area. The basic idea is to introduce a
constrained Delaunay triangulation, identify the branch
convergence area based on the degree of node
correlation, and eliminate the jitter on the skeleton line
of the branch convergence area under the direction and
distance constraints. The specific steps are shown as
below:
Step 1: Construct a constrained Delaunay
triangulation to divide the narrow long map-spot.
According to the number of adjacent triangles in the
inner triangle of the polygon, the triangles in the
Delaunay triangulation can be subdivided into three
categories:
Type I triangle: There is one and only one adjacent
triangle. As shown by ΔABC in Figure 1(a), the vertex
A is the end point of the skeleton line.
Type II triangle: There are two adjacent triangles.
As shown by ΔABC in Figure 1(b), the advancement
direction of the skeleton line in the Type II triangle is
unique.
Type III triangle: There are three adjacent triangles.
As shown by ΔABC in Figure 1(c), the three extension
directions occur at point O.
Step 2: Extract the central axis from the three types
of triangles as follows for connection to form a
skeleton line, wherein the common edges of two
adjacent triangles are called adjacent edges:
Type I triangle: Connect the midpoint of the unique
adjacent edge with its corresponding vertex, as shown
by segment AD in Figure 1 (a);
Type II triangle: Connect the midpoints of two
adjacent edges, as shown by segment DF in Figure
1(b);
Type III triangle: Connect the center of gravity
and the midpoint of the three sides, as shown by
segments OD, OF, OH in Figure 1 (c).
A
B
C
D
E
A
B
C
D
E
G
F
A
B
C
D
E
G
F
H
I
O
(a) (b) (c)
Figure 1: Triangle classification. (a) Type I triangle, (b)
Type II triangle, (c) Type III triangle.
Step 3: Since the area where the Type III triangle
is located is a branch convergence area, the branch
aggregation area can be identified by the location of
Type III triangle;
Step 4: Calculate the direction of the three related
skeleton line branches in the branch convergence
area. If there is a branch skeleton line with the same
direction, it is preferentially connected as a straight
line, and the remaining branch skeleton lines extend
to the straight line in their respective directions; If
there is no arbitrary two skeleton lines in the same
direction, the Euclidean distance between the nodes
is used as a measure of similarity, the branch nodes
are aggregated to the geometric centre of the range,
and the branch skeleton lines are connected to the
aggregation nodes in respective directions.
2.2 Defects in the Existing Method of
Extracting Skeleton Lines
In the existing method, each trigeminal region is used
as a processing unit, and by setting a direction
threshold and a branch node distance threshold, the
skeleton line of simple junctions aggregation area can
be obtained well. However, when the junctions is
complicatedly converged, the existing method is
difficult to precisely strip single branch convergence
area, leading to no accurate extracted skeleton line. In
addition, the shape of the skeleton line in the
junctions is complicated, and each branch
convergence area is used as a unit for processing,
unable to consider the overall characteristics of the
area formed by the mutual association between the
branches, resulting in the destruction of the overall
structure of the area.
3 METHODOLOGY
In this paper, a method for extracting skeleton line in
the areas with dense junctions considering stroke
GISTAM 2019 - 5th International Conference on Geographical Information Systems Theory, Applications and Management
194
features is proposed, including three key steps as
follows. (1) Long-edge adaptive node densification:
Create Delaunay triangulation with polygon
boundary constraints for long-edge adaptive
densification; (2) Areas with dense junctions
identification: Identify the branch structure and
aggregate the qualified branches; (3) The skeleton
line extraction in the Areas with dense junctions:
According to the good continuity characteristics of
the stroke, the skeleton line is optimized, leading to
more in line with humans cognitive law.
3.1 Long-edge Adaptive Node
Densification
Boundary densification is one of the key steps in
establishing a boundary-constrained Delaunay
triangulation. In the dense area of the bifurcation,
there will be a large number of complex areas with
one side branch dense while no branch on the other
side. If not densified, the constrained Delaunay
extraction directly extracts the skeleton line, which
will cause a large deviation in the identification of the
branch convergence area. If the traditional overall
densification method is used, it will lead to invalid
branches in the normal end. Therefore, the long-edge
adaptive densification is proposed to perform node
densification on such complex areas in this paper. The
specific steps are shown as below:
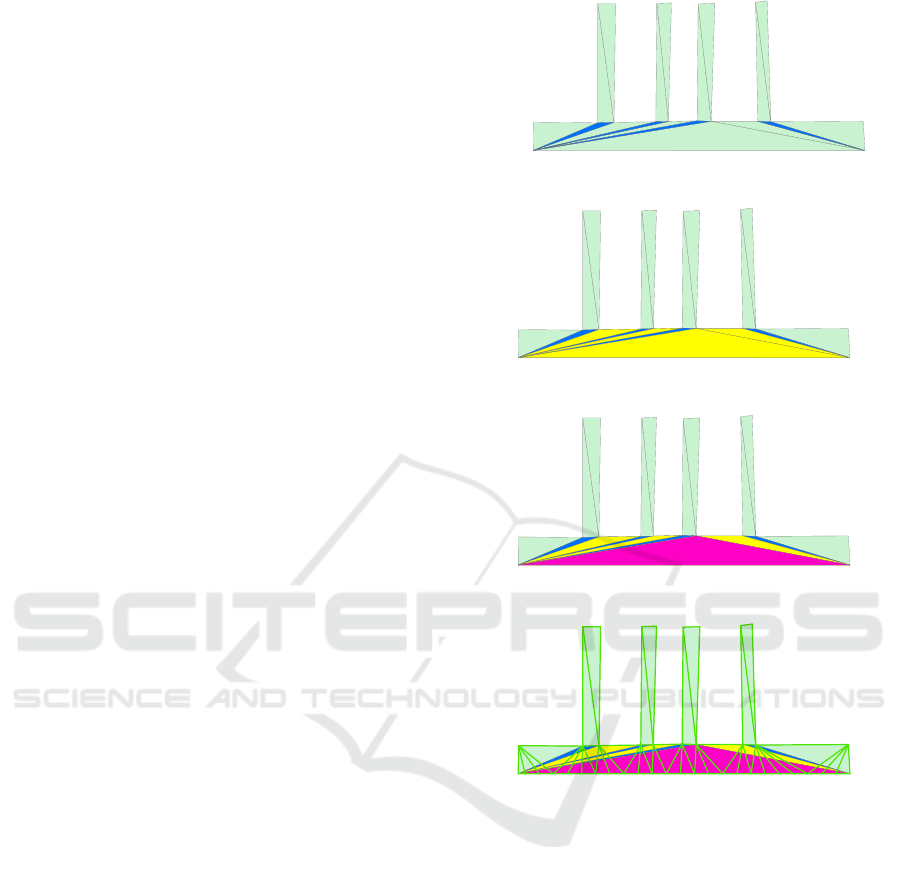
Step 1: Identify the obtuse triangle in the Type III
triangle and set the minimum angle threshold Amin.
If the minimum angle in an obtuse triangle is smaller
than Amin, it is marked and put it into the triangle set
S, as shown by the blue triangle in Figure 2 (a );
Step 2: Identify the longest edges of all the
triangles in the set S, and find the Type II triangles
adjacent to the longest edges with one edge as the
boundary, as shown by the yellow triangle in Figure
2(b);
Step 3: Identify the longest edge of the above-
mentioned Type II triangle and determine whether it
is a boundary edge. If it is a boundary edge, it is
marked as the local long edge to be densified, and the
Type II triangle is marked as the triangle to be
densified. The purple triangle is shown in Figurer
2(c);
Step 4: Set the densified step size to the smallest
and shortest edge of Type III triangle set associated
with Type II triangle to be densified;
Step 5: Densify by the densified step size, as
shown in Figure 2(d).
(a)
(b)
(c)
(d)
Figure 2: Long-edge adaptive densification. (a) Elongated
Type III triangle, (b) Type II triangle with one edge as the
boundary, (c) Local long edge to be densified, (d) Densify
by densified step size.
3.2 Identification of Areas with Dense
Junctions
3.2.1 Trident Identification
The first step in the identification of the areas with
dense junctions is to identify the trident area in the
polygon. The identification method is shown as
follows. (1) After long-edge adaptive densification,
construct a polygonal boundary constraint Delaunay
triangulation and extract the initial skeleton line; (2)
Construct a point and line topology for the initial
skeleton line, and for any node of the skeleton line
Skeleton Line Extraction Method in the Areas with Dense Junctions Considering Stroke Features
195
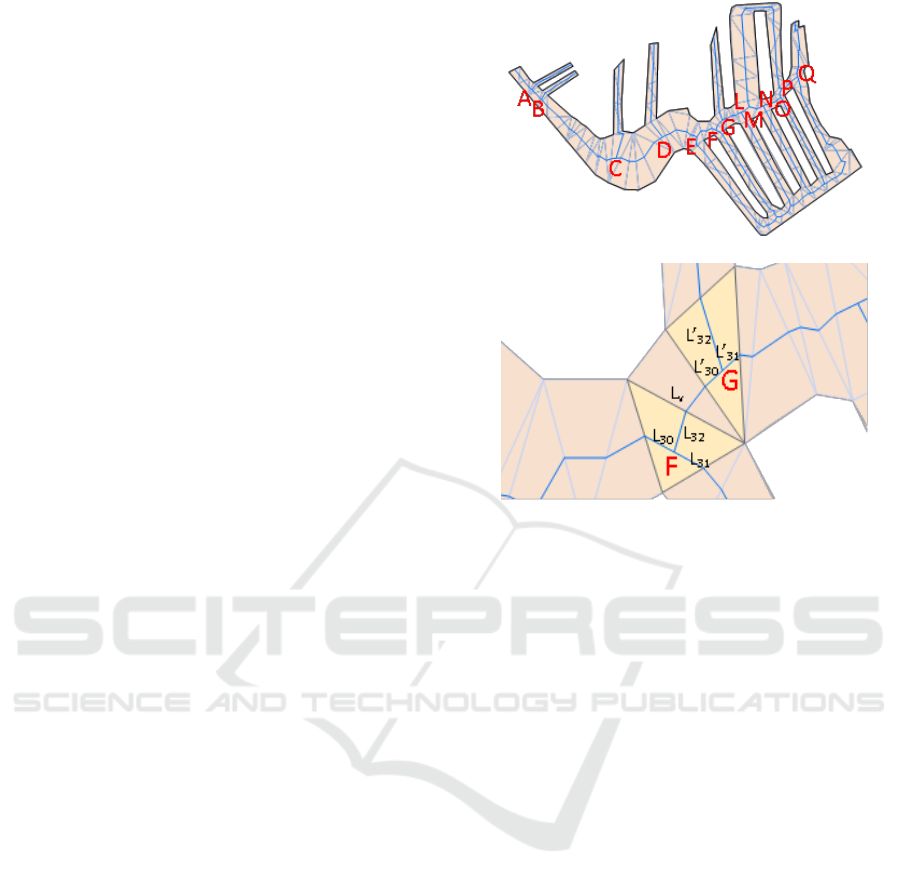
topologies, the number of arcs associated with the
node is ArcNum(Node); (3) When ArcNum(Node)=3
of a node, the node is a trident node, and the area is
the trident area, as shown by the nodes A-P in Figure
3(a). It can be found that these trident nodes are the
center points of Type III triangles.
3.2.2 Trident Association
Whether the identified tridents can be aggregated
needs to be judged by the connecting arc between
the tridents, wherein the connecting arc segment is
defined as below. If the first and end points of an arc
segment are trident nodes, then the arc segment is a
trident connecting arc. The specific steps for
determining the associated relationship are shown as
follows:
Step 1: Calculate the local approximate width
W
NODE
of the area where the trident is located: record
twice the maximum value among the three edges of
Type III triangle corresponding to the trident as the
local approximate width W
NODE
of the area where
the trident is located, i.e.,
W
NODE
=Max(L
30
,L
31
,L
32
)×2;
Step 2: Calculate the local approximate width
W
ARC
of the area where the connecting arc is located:
calculate the local approximate widths W
Ns
and W
Ne
of the area where the first node N
s
and the end node
N
e
of the connecting arc are located, and use the
large value as the local approximate width W
ARC
of
the area where the connecting arc is located, i.e.,
W
ARC
=Max(W
Ns
,W
Ne
);
Step 3: Calculate the effective length L
v
of the
connecting arc segment: record the part of the
connecting arc between the first and end nodes of
the connecting arc segment with the internal length
of Type III triangle as the effective length L
v
of the
connecting arc segment, as shown in Figure 3(b),
and the effective length of the connecting arc
between the first node F and the end node G is
L
v
=L
FG
-L
32
-L’
30
;
Step 4: If the effective length L
v
of the connecting
arc between the two trident nodes is smaller than the
local approximate width W
ARC
of the area where the
connecting arc is located, i.e., ArcNum(N
s
)=3,
ArcNum(N
e
)=3 and L
v
<W
ARC
are satisfied
simultaneously, then the two tridents are associated
with each other, and the connecting arc between them
is marked Arc
link
.
(a)
(b)
Figure 3: Trident association judgement. (a) Trident node,
(b) Effective length Lv of connecting arc.
3.2.3 Trident Aggregation
Calculate the associated arc Arc
link
for all trident nodes
of the polygon to be placed in the set S (Arc
link
). Select
an Arc
link
and use its first node N
s
and end node N
e
as
tracking nodes to detect whether Arc
link
also exists in
the first node N
s
and end node N
e
(except Arc
link
itself)
and record to the neighboring association Arc
link
set
NeighborArc
link
(Arc
link
). After each Arc
link
is detected,
it is clustered and expanded to obtain the junctions
aggregation result.
3.3 Skeleton Line Extraction in Areas
with Dense Junctions
For any trident aggregation area, this paper takes into
account the stroke feature to extract its internal
skeleton line.
Accordingly, a stroke is first constructed with the
connecting arc as a unit in this paper, and then the
skeleton line of the trident region is extracted, leading
to natural extension according to the stroke feature
and obtain a skeleton line more in line with human
cognition.
GISTAM 2019 - 5th International Conference on Geographical Information Systems Theory, Applications and Management
196
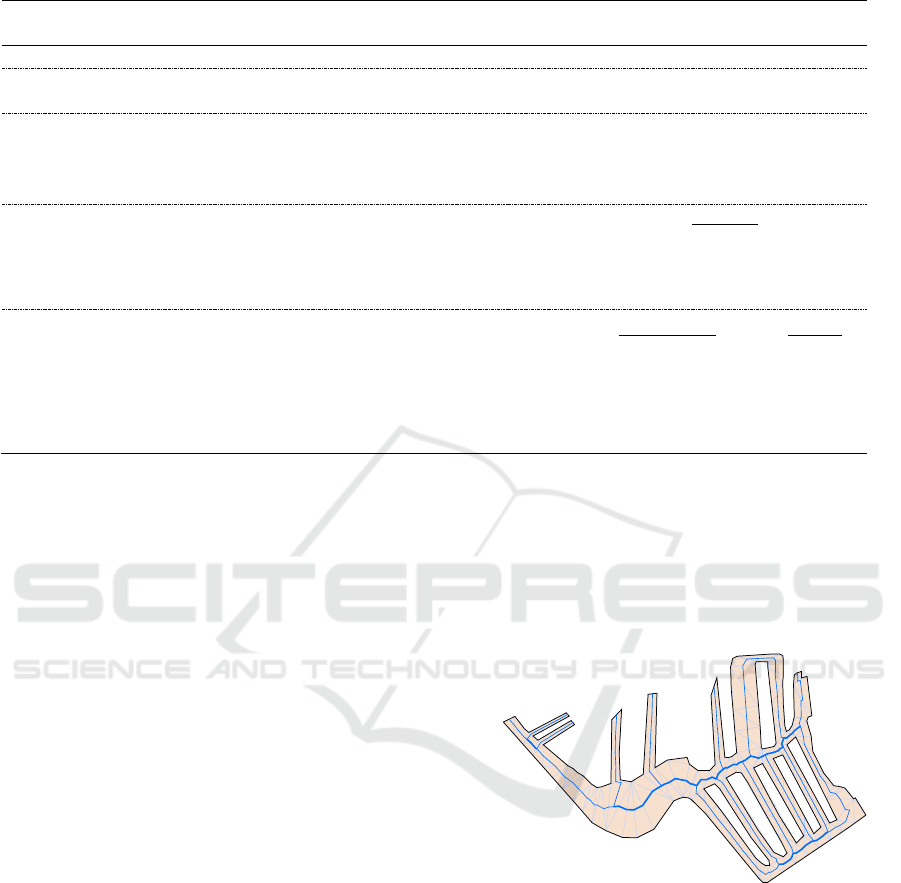
Table 1: The meaning and calculation method of connecting arc parameters.
Parameter
name
Meaning
Calculation method
Length
Length of connecting arc
L=Distance(Ns,Ne)
Approximate
width
Local approximate width of connecting arc
W
NODE
=Max(L
30
,L
31
,L
32
)×2
Connectivity
The number of other connecting arcs that
intersect this connecting arc
1
( ) ( , )
n
i i k
k
D v r v v
Where,
( , )
ik
r v v
indicates the connectivity
between nodes.
Proximity
The minimum number of connections from the
connecting arc to all other connecting arcs, reflecting
the possibility that other connecting arcs will be
aggregated in this connecting arc
1
1
()
( , )
i
n
ik
k
n
Cv
d v v
Where,
( , )
ik
d v v
indicates the shortest
distance between two nodes.
Betweenness
Measure the extent of this connecting arc
between other connecting arcs and whether the
connecting arc acts as a “bridge”
. ; ;
()
1
()
( 1)( 2)
jk i
i
j k n j k k i
jk
mv
Bv
n n m
Where,
jk
m
indicates the number of the
shortest distance between two nodes;
()
jk i
mv
indicates the number of the shortest
distance between two nodes passing the node
i
v
3.3.1 Arc Importance Evaluation
The basic idea to determine the importance of
connecting arcs in this paper is to use the length,
connectivity, proximity and mediation of connecting
arcs, weighted by CRITIC (Criteria Importance
Though Intercrieria Correlation) method (Diakoulaki
et al., 1995) to obtain the importance of connecting
arcs. The meanings of the parameters of connecting
arc segments are shown in Table 1.
3.3.2 Construct a Stroke Connection
Based on the importance of each connecting arc
segment, the stroke connection of the areas with
dense junctions is iteratively calculated, and the main
steps are shown as follows:
Step 1: Identify the trident node with only the
associated arc on one side, and select one as the stroke
connection to track the starting node. Then, the
connecting arc is taken as the tracking arc to get the
node on the other side of the arc, which is used as a
tracking node;
Step 2: The connecting arc of the tracking node
is taken as the stroke connection candidate set R to
calculate the importance of each connecting arc
segment;
Step 3: Preferentially connect the arc segment of
larger importance with the previous arc segment to
form a stroke;
Step 4: According to the ideas of Steps 2 and 3,
continue to track the calculation of the stroke
connection until there is no connection arc of the
tracking node, then the single stroke connection ends;
Step 5: Explore the branch connecting arc of the
existing stroke connection until all the connecting
arcs of intersecting dense areas have been calculated,
then the stroke connection calculation ends, as shown
by the thick blue line in Figure 4.
Figure 4: Junctions aggregation result.
3.3.3 Skeleton Line Adjustment
The connecting arc Arc
link
,
as the basic unit of stroke
connection in areas with dense junctions, consists of
two trident nodes. For any of the trident nodes, the
two arcs with the stroke connection are used as the
reference arc. The midpoint of the two-point line on
the edge of Type III triangle is used as the adjustment
position of the trident node, and the three arc
segments associated with the trident node are
connected with the midpoint to complete the skeleton
line adjustment of each trident region. As shown in
Skeleton Line Extraction Method in the Areas with Dense Junctions Considering Stroke Features
197
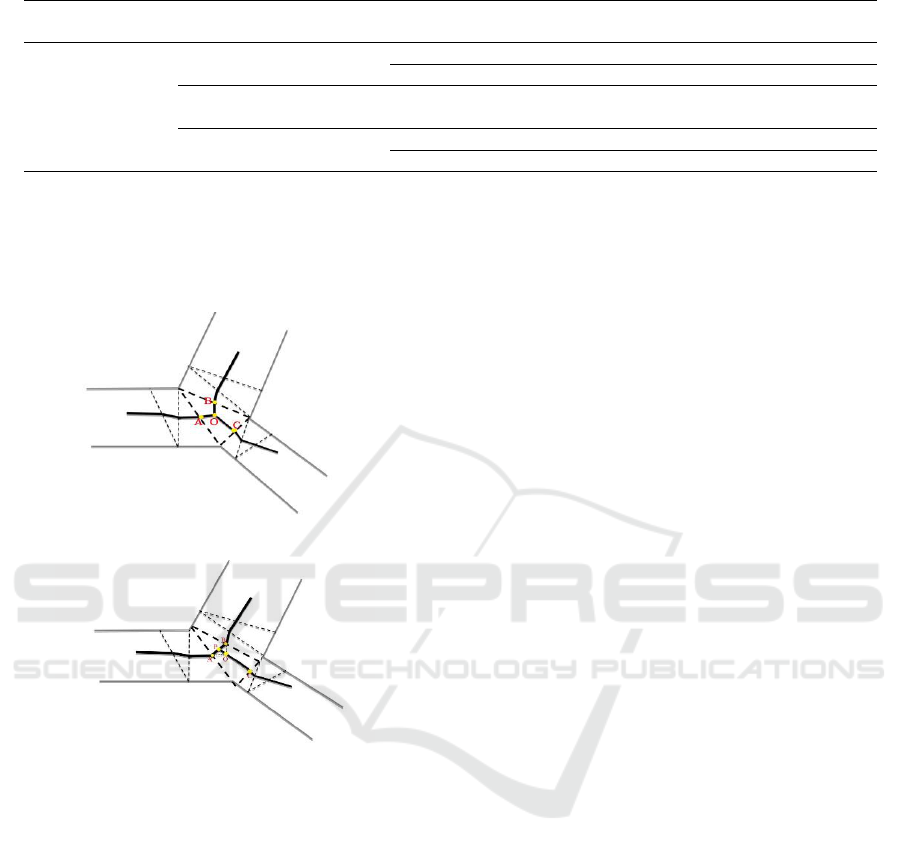
Table 2: Overall situation statistics of experimental surface element processing results.
Trident number
Number of areas with
dense junctions
The case of areas with dense junctions containing connecting
arc segments
2286
124
Max
Min
Average
Total
307
1
15.6
1939
stroke connection number
in the dense area
Stroke containing connecting arc
385
Max
Min
Average
Total
66
1
3.1
1939
Figure 5, assuming that the arcs of OA and OB belong
to the same stroke at the trident node O, the
intermediate point P of AB is taken to connect AP,
BP and OP to form a new skeleton line.
(a)
(b)
Figure 5: Skeleton line adjustment in trident area. (a) Before
adjustment, (b) After adjustment.
4 EXPERIMENT AND ANALYSIS
4.1 Experimental Data and
Environment
Relying on the WJ-III map workstation developed by
China Institute of Surveying and Mapping, the
method of extracting the skeleton line of the areas
with dense junctions considering of stroke features
proposed in this paper is embedded, and a complex
water topographic map in Jiangsu with a scale of
1:10000 is taken as a case for reliability and
superiority verification. The experimental data space
range is 2.7×2.7 km2, the software system running
environment is Windows 7 64-bit operating system,
the CPU is Intel Core I7-3770, the main frequency is
3.2GHz, the memory is 16GB, and the solid state hard
disk is 1024GB.
4.2 Reliability and Superiority Analysis
In order to verify the reliability and superiority of
the proposed method, the method of this paper is
compared with the skeleton line extraction method of
Li et al. (2018). The overall situation of the
processing area using the method of this paper is
shown in Table 2.It can be seen from Table 2 that the
junctions is densely distributed, and about 85% of the
tridents meet the aggregation conditions.
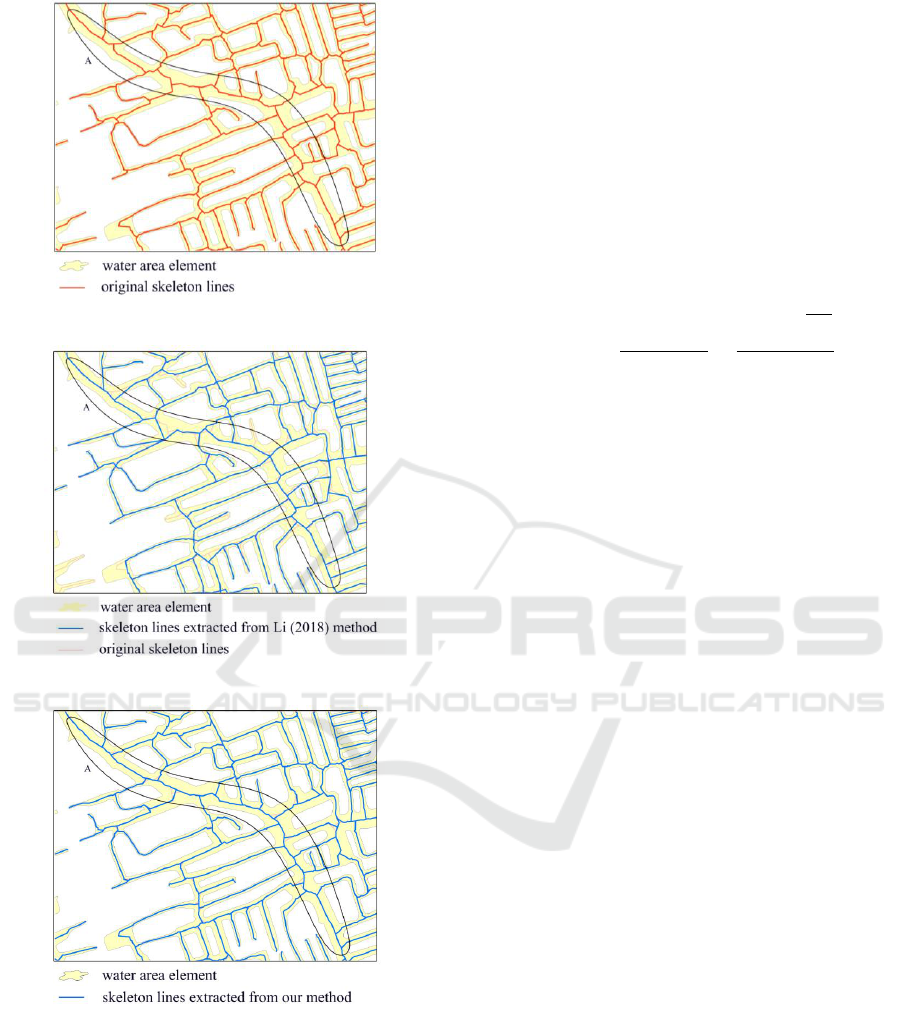
4.2.1 Visual Cognition Analysis
The densely distributed areas of typical junctions in
the experimental area are as shown in Figure 6.
It can be seen from Figure 6 that for complex areas
with dense junctions, the method of Li et al. (2018) is
subject to severe interference of the complex
boundary and arrangement structure of the branch,
unable to process the skeleton line jitter of this area,
and the extracted skeleton line has a large degree of
distortion, thus losing the overall structure of this
region. In contrast, the method of this paper can better
extract the main structure of this region and more
accurately describe the skeleton line of the main
structure. For the backbone area with larger
connectivity within the rectangle A, the skeleton line
extracted in this method can also summarize its
extension characteristics well.
GISTAM 2019 - 5th International Conference on Geographical Information Systems Theory, Applications and Management
198
(a)
(b)
(c)
Figure 6: Comparison in extraction results of skeleton lines
in complex areas with dense junctions. (a) Original skeleton
line, (b) Extraction results of Li (2018), (c) Extraction
results of this paper.
4.2.2 Network Function Analysis
The global efficiency commonly used in complex
network theory is used to evaluate the network function
of the results in this paper. The concept of dual graphs
is introduced, where the nodes represent the connecting
arcs between trident nodes, and the edges represent the
relationship between the connecting arc segments and
other connecting arc segments. It is formalized as
( , )G G V E
, where V is the set of nodes and E is
the set of edges. Then the “global efficiency” of the
network G is calculated as below:
)1(
ij
ji,ji
NN
E
G
,
)1(
d
1
ij
ji,ji
NN
G,
Where N is the total number of nodes,
ij
is the
efficiency between node i and node j, and
ij
d
is the
minimum number of steps required by connecting node
i and node j, i.e., the path length. The global efficiency
range is [0, 1]. Meanwhile, the number of stroke
connections formed by the arcs of the experimental
area is counted, as shown in Table 3.
It can be found from Table 3 that in terms of
global efficiency, the overall efficiency of the result in
this paper is improved by 0.023 compared with the
traditional method, which indicates that the method in
this paper improves the smoothness of information
dissemination in the network. Meanwhile, in the case
of same number of arcs, the number of strokes
constructed by the method in this paper is reduced by
72 compared with the traditional method, indicating
that the network stroke access is better.
5 CONCLUSIONS
Aiming at the problem that the traditional method
cannot accurately maintain the main structure and
extension characteristics of the areas with dense
junctions, a method of extracting the skeleton line of
the areas with dense junctions considering the stroke
feature is proposed in this paper. After verifying the
topographic map of the actual water system in a certain
area of Jiangsu, the main conclusions are shown as fol-
lows:
(1) Applicability: The method in this paper can
better distinguish the areas with dense junctions and
the areas with sparse junctions. For the identified 124
areas with dense junctions, the traditional method can
only process 58% of the tridents, but this method can
process all tridents.
Skeleton Line Extraction Method in the Areas with Dense Junctions Considering Stroke Features
199

Table 3: Comparison in global efficiency and number of stroke connections.
Method
Number of arc
segment
Stroke number
Global efficiency
Method of Li et al. (2018)
3617
1330
0.096
Method in this paper
3617
1258
0.119
(2) Superiority: Visual cognition analysis shows
that for the complex areas with dense junctions, the
skeleton line extracted by this method can better
display the regional main structure and extension
characteristics. The analysis of network function
indicates that the skeleton line extracted by this method
has better accessibility.
The stroke generation strategy has an important
influence on the accuracy of the skeleton line
extraction results by the method in this paper. The next
research focus is to further refine the arc importance
evaluation system and establish a more reasonable
stroke generation strategy, so as to make the skeleton
line extraction result more refined.
ACKNOWLEDGEMENTS
This research was funded by National Natural Science
Foundation of China under grant number 41871375.
REFERENCES
Ai T., Liu Y., 2002. Aggregation and Amalgamation in Land-
use Data Generalization. Geomatics and Information
Science of Wuhan University, 27(5): 486-492. (in
Chinese)
Ai T., Yang F., Li J.,2010. Land-use Data Generalization for
the Database Construction of the Second Land
Resource Survey. Geomatics and Information Science
of Wuhan University, (8): 887-891. (in Chinese)
Lee D. T., 1982. Medial Axis Transformation of a Planar
Shape. IEEE Transactions on pattern analysis and
machine intelligence, (4): 363-369.
Das, G.K., et al., 2010. Computing the straight skeleton of a
monotone polygon in O(nlogn) time. Proceedings of the
22nd Annual Canadian Conference on Computational
Geometry, Winnipeg, Manitoba, Canada; pp. 207–210.
Sintunata, V., and Aoki, T., 2016. Skeleton extraction in
cluttered image based on delaunay triangulation.
multimedia (ISM). 2016 IEEE International Symposium
on. IEEE, California, USA; pp.365–366.
Cao, T., Edelsbrunner, H., and Tan, T., 2015. Proof of
correctness of the digital Delaunay triangulation
algorithm. Computational Geometry: Theory and
Applications, 48.
Ware J. M., Jones C. B., Bundy G. L., 1997. A Triangulated
Spatial Model for Cartographic Generalization of Areal
Objects. In: Kraak M J, Molenaar M eds. Advance in
GIS Research II(the 7th Int. Symposium on Spatial Data
Handling). London: Taylor & Francis, 173-192.
Delucai A. A., Black R. T., 1987. A Comprehensice
Approach to Automatic Feature Generalization.
International Cartographic Conference.
Zou J. J., and Yan H., 2001. Skeletonization of ribbon-like
shapes based on regularity and singularity analyses.
IEEE Transactions on Systems, Man, and Cybernetics,
Part B (Cybernetics), 31(3), 401–407.
Li Z., 2006. Algorithmic foundation of multi-scale spatial
representation. Boca Raton, FA: CRC Press.
Penninga F., Verbree E., Quak W., et al., 2005. Construction
of the Planar Partition Postal Code Map Based on
Cadastral Registration. GeoInformatica, 9(2): 181-204.
Jones C. B., Bunday G. L., Ware M. J., 1995. Map
Generalization with a Triangulated Data Structure.
Cartography and Geographic Information Systems,
22(4): 317-331.
Uitermark H., Vogels A., Van Oosterom P., 1999. Semantic
and Geometric Aspects of Integrating Road Networks.
Interoperating Geographic Information Systems.
Springer, Berlin, Heidelberg, 177-188.
Haunert J. H., Sester M., 2008. Area Collapse and Road
Centerlines Based on Straight Skeletons.
GeoInformatica, 12(2): 169-191.
Li, C.; Yin, Y.; Wu, P.; Liu, X.; Guo, P., 2018. Improved
Jitter Elimination and Topology Correction Method for
the Split Line of Narrow and Long Patches. ISPRS Int. J.
Geo-Inf., 7, 402.
Diakoulaki D, Mavrotas G, Papayannakis L. 1995.
Determining objective weights in multiple criteria
problems: The critic method. Computers & Operations
Research, 22(7): 763-770.
GISTAM 2019 - 5th International Conference on Geographical Information Systems Theory, Applications and Management
200
