
How to Realize a Compact City: Street Activeness and Agent-based
Urban Modeling
Hideyuki Nagai
1
and Setsuya Kurahashi
2
1
Research Group on Fusion of Informatics and Social Science, University of Tsukuba, Tokyo, Japan
2
Graduate School of System Management, University of Tsukuba, Tokyo, Japan
Keywords:
Agent-based Model, Urban Design, Land Use, Compact City.
Abstract:
The purpose of this research is to verify the effectiveness of the combination of the introduction of tramway
with introducing a public facility for urban residents and promoting street activeness around it, on urban
sprawl. An agent-based model (ABM) for simulating the changes of urban structure through autonomous
behavior of urban residents was designed, and the simulation experiments were conducted based on the as-
sumption of combining these policies. As a result, this research clarified the following points and how they
were. First, the synergistic effects of the introduction of tramway, the proper location of a public facility for
urban residents, and the promotion of street activeness around it, are effective in maintaining a poly-centric
compact urban structure. Second, the introduction of tramway targeting the urban sprawl can exert a profound
effect only when combined with the above-mentioned policies, although it takes a long period. Third, a mono-
centric compact urban structure is realized along with the above, while improving the living environment and
revitalizing the urban central area.
1 INTRODUCTION
1.1 Urban Sprawl Issues and Shift into
Compact City
The world population has rapidly increased during
our current century along with the previous century,
and rapid urbanizationhas continued at various places
around the globe (UN, 2012). Under such circum-
stances, urban sprawl has attracted much attention,
in the past few decades, and coming under fire as an
unsustainable form of urbanization. Urban sprawl is
commonly defined by the following land-use charac-
teristics (Schneider and Woodcock, 2008) (Johnson,
2001):
• Expansion of urban area in outer fringe area
• Low-density development
• Scattered development (multi-direction)
• Leapfrog development (discontinuity)
• Commercial strip development
Urban sprawl is also often criticized because of
its following negative impacts (Johnson, 2001) (Deal
and Schunk, 2004):
• Increase in traffic congestion and commuting time,
air pollution, and energy consumption
• Increase in infrastructure cost
• Hollowing out in urban central area, economic dis-
parity, and loss of community
• Loss of agricultural and natural land
Researchers and experts have studied a shift into
”compact city”, as a countermeasure against such ur-
ban sprawl. Compact city is commonly defined by the
following characteristics (Tsai, 2005) (Behan et al.,
2008):
• High-density
• Concentration of development
• Development in public transportation network
• Mono-centric or poly-centric city center
It has been proved that compact city can over-
come some of the negative impacts driven by urban
sprawl and many studies have also indicated that it
can enhance quality of life by offering a broad range
of choices about lifestyle and behavior (Behan et al.,
2008). Considering the urban dynamics including
sprawl as complex phenomena of mutual interactions
of a wide variety of autonomous entities, such as indi-
viduals, households, and firms (Batty, 2007) (Ligten-
berg et al., 2001), however, highlights the difficulty in
direct control of the urban dynamics.
100
Nagai, H. and Kurahashi, S.
How to Realize a Compact City: Street Activeness and Agent-based Urban Modeling.
DOI: 10.5220/0007707201000107
In Proceedings of the 8th International Conference on Smart Cities and Green ICT Systems (SMARTGREENS 2019), pages 100-107
ISBN: 978-989-758-373-5
Copyright
c
2019 by SCITEPRESS – Science and Technology Publications, Lda. All rights reserved

1.2 Purpose of this Research
With these in mind, this research designed an agent-
based model (ABM) to simulate urban structure
changes through the induction of autonomous behav-
ior of urban residents rather than the compulsion, and
this research verified the following points:
• Is the combination of a introduction of tramway
with introducing a public facility for urban residents
and promoting street activeness around it effective in
controlling urban sprawl?
• Is the combination of these policies also effec-
tive in improving existent urban sprawl?
2 RELATED WORKS AND
POSITION OF THIS RESEARCH
2.1 Agent-based LUTI Model
Urban sprawl is a special kind of land-use change,
urban spatial expansion along a city boundary. And
land-use changes come from its complex driving
forces and their interactions (Ligtenberg et al., 2001).
Above all, the fundamentalprinciple that land-use im-
pacts transport and vice versa has been acknowledged
by many researchers and supported by empirical find-
ings (Acheampong and Silva, 2015). These research
efforts have culminated in the development of op-
erational urban land-use/transport interaction (LUTI)
models.
And recently, researchers have supported the mod-
eling approach of an agent-based model (ABM) to ex-
press the real-world complicated system including a
city as a macro-level state that is generated by micro-
level collective interactions and adaptive behavior of
multiple autonomous agents (Batty, 2007) (Railsback
and Grimm, 2011).
A series of agent-based LUTI models, which is an
integration of the abovetwo concept, have contributed
to express complicated macro-level land-use patterns
of cities sprawl as self-organization through micro-
level adaptive behavior of agents, such as households
and firms. And such models have served to explore
urban growth scenarios.
2.2 Revitalization of Urban Central
Area
Jacobs (1969) has emphasized the attractiveness of a
city as a lively and bustling place which has served as
a market for exchange from the time before the estab-
lishment of the concept of nation or trading by cur-
rency (Jacobs, 1969). And researchers and experts
have reevaluated the importance of informal public
spaces for activities of local residents in the way of
an antithesis to urban development on an inhuman
scale as well as another way to regain people in ur-
ban central areas. The two factors are vital to forming
such public space. First, such public space needs to
serve as a hub for people in their daily lives so that
they can visit there casually while they are out. As for
such urban hubs, public complexes based mainly on
a library have recently attracted much attention. The
representative one is the series of Idea Store in Lon-
don, U.K. Several pioneering libraries built and put
into operation recently in Japan are also relevant to
these cases
1
. These public complexes, while offer-
ing the library service as the core function, provide a
wide variety of other services, such as cafe and sup-
port of learning and civic activities. They also try to
enhance convenience by various policies such as an
extension of opening time. By doing so, they play
an important role to serve as a hub for local culture.
Second, such public space needs to generate ”street
activeness” set in an open space, such as a street or a
plaza, around the public space. Street activeness indi-
cates a lively situation where individuals gather and
stroll around downtown while enjoying exchanges,
such as encountering various people, contacting vari-
ous shopping goods, and experiencing other services
(Nagai and Kurahashi, 2017). It has been long argued
that such interactions propel economic activity, and
recent researches have also indicated that such inter-
actions can enhance economic productivity through
creative knowledge spillover (Landry, 2012). Fur-
thermore, the following positive feedback has been
demonstrated empirically: the number of people that
visited a certain place including their sojourn time
they spent there can derive attract further activeness
(Kakoi et al., 2010).
2.3 Position of this Research
By integrating the above-mentioned conceptual
framework, Nagai (2017) built the agent-based model
(ABM) to consider qualitative benefit obtained by vis-
iting informal public space along with the daily travel
of urban residents. And they clarified that the syner-
gistic effects of policies of locating of the public space
and promoting street activeness in such a place, are ef-
fective to maintain a compact urban structure (Nagai
and Kurahashi, 2017). On the other hand, an intro-
duction of tramway is well known as one of the mea-
sures to improve urban environment. Tramway has
1
e.g., Gifu Media Cosmos in Gifu, Japan (2015), Art
Museum & Library, Ota in Gunma, Japan (2017).
How to Realize a Compact City: Street Activeness and Agent-based Urban Modeling
101

been introduced especially in many European cities
(De Bruijn and Veeneman, 2009), and in recent years
momentum for introduction of tramway has also been
raised in Japan. Additionally, especially in Japan, a
large part of the land is mountainous, thus the area
suitable for urbanization is relatively small. And the
population is also declining (MLIT, 2016). For these
reasons, improvementof many cities that have already
sprawled is considered to be more important. With
these in mind, this research develops the conceptual
framework introduced by Nagai (2017) (Nagai and
Kurahashi, 2017) to verify whether the introduction
of tramway is effective in maintaining compact urban
structure, and whether it is also effective in improving
sprawled urban structure.
3 SIMULATION MODEL
The overview of the experimental model was de-
scribed below according to the ODD (Overview, De-
sign concepts, and Details) protocol.
3.1 Purpose
By simulation experiments by the ABM that ab-
stracted a city and behavior of the residents in the
city, this research verified the effects of controlling
the urban structure, which was planned according to
the zoning, based on the combination of the intro-
duction of tramway with introducing a public facil-
ity for urban residents and promoting street activeness
around it. Additionally, this research verified the ef-
fects of improving the urban structure, which has al-
ready sprawled, based on the combination.
3.2 Entities and Scales
Entities are a planar urban schematic and household
agents who act in the urban schematic. Both are
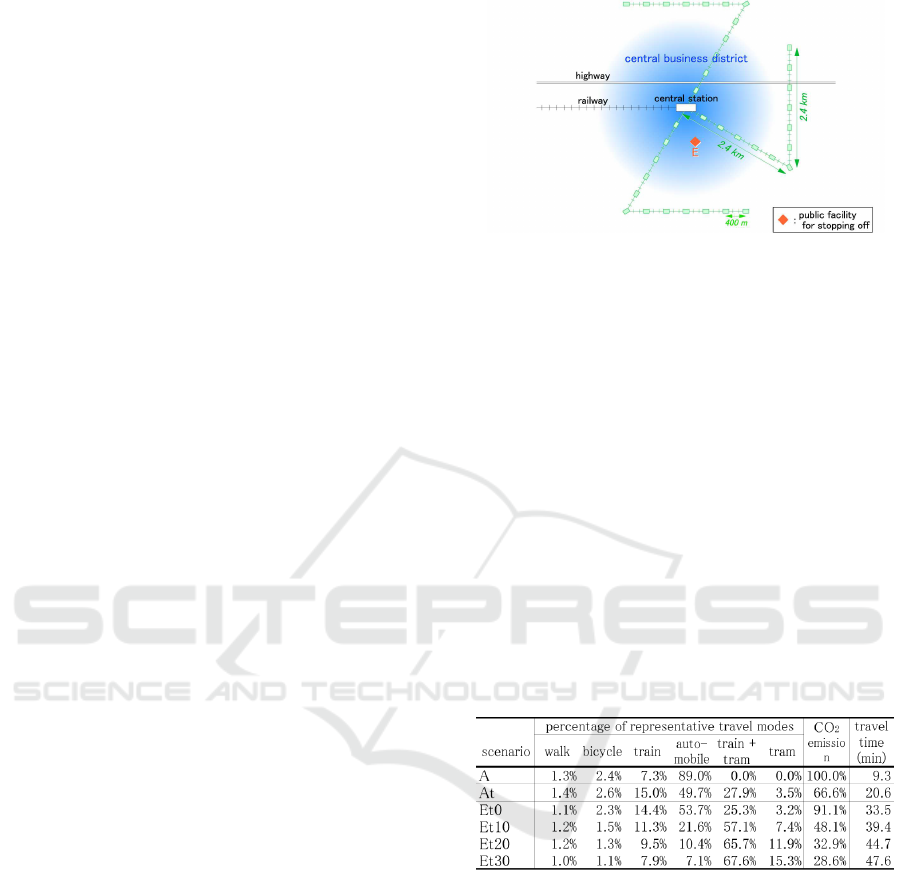
spatially-explicitly expressed. Fig. 1 shows the urban
schematic. This is the abstraction of a part of typical
regional cities in Japan, where a central business dis-
trict (CBD) and bedroom towns connected by railway.
They were planned according to the zoning with sep-
aration between residences and job locations. There-
fore, they are also regarded as the poly-centric com-
pact city, which is composed of multiple hubs linked
with traffic networks and sharing their own role (Tsai,
2005). In the urban schematic, two domains are lo-
cated: a residence district and a central business dis-
trict (CBD). The residence district is the aggregation
of residences, which are the starting point and the fi-
nal destination of each household agent’s daily travel
which corresponds to commuting. CBD is the ag-
gregation of job locations, which are also a halfway
point of the travel. Two railway stations are located
at each center. Additionally, a highway is located
500 meters north of the railway. Furthermore, three
tramway routes are radially installed around the cen-
tral station as a hub (see next section for details). To
simplify the simulation, this schematic is assumed to
have uniform and high-density sidewalks and roads
overall and household agents can freely travel on this
space on foot, by bicycle or private automobile.
In the residence district, residences of the same
number as household agents: 1,000 are located ran-
domly based on normal distribution centering on the
residence station. Similarly, job locations of the same
number are also located in CBD. Additionally, one
public facility such as a complex mentioned in the
previous section: a public facility for stopping off
(PFS), is located in the central area of CBD.
Figure 1: Urban Schematic.
3.3 State Variables of Household Agent
State variables of household agent are as follows:
• Position of the residence
• Position of the job location
• Type of linked trip selected currently
• Value list of linked trips
A linked trip indicates the series of travels of each
household agent from the starting point to the desti-
nation.
3.4 Process Overview and Scheduling
Each household agent repeats daily travel based on
the value list of linked trips, and fixes travel mode
in one way through the learning period. After that, a
part of all household agents randomly chosen relocate
SMARTGREENS 2019 - 8th International Conference on Smart Cities and Green ICT Systems
102

their residences. In this research, after the loop pro-
cess of residential relocation is repeated 20 times, the
simulation stops processing.
2
3.5 Sub-model of Daily Travel
Each household agent repeats daily travel according
to the selected linked trip. The representative travel
mode is either of the following: on foot, by bicy-
cle, train, private automobile, or tramway. The initial
representative travel mode of all household agents is
train according to the original urban planning philos-
ophy. Each household agent leaves the residence for
the job location. And after all household agents arrive
at each job location, they leave for PFS. After arriving
and staying there, finally they return to the residence.
When returning, the total travel cost C is calculated
according to the equation below.
C = w
t
C
t
+ w
c
C
c
+ w
f
C
f
− w
P
P
C
t
, C
c
, C
f
, and P indicate time cost, charge cost,
fatigue cost, and activeness value. w
t
, w
c
, w
f
, and w
P
indicate each preference bias. The preference biases
of all agents are assumed to be equal. According to
this cost, the household agent updates the value V
i
of
the selected i-th linked trip, according to the equation
below.
V
i
←− α(−C) + (1− α)V
i
The following travel is done according to the
linked trip selected by the ε-greedy method based on
this value. And each household agent fixes their travel
mode in one way through the learning period of 30
times’ daily travel. This setting is based on the find-
ings that individuals choose travel modes and routes
rather boundedly rationally and habitually (Ramming,
2001).
3.5.1 Activeness Value
Within 500 meters radius around PFS, a promotion of
street activeness is considered. Here, it is assumed
that street activeness can be generated when house-
hold agents traveling on foot or by bicycle within this
range interact face-to-face. During this time, relevant
household agents acquire benefit brought about by the
street activeness as activeness value P according to
the equation below.
P = η
ac
D
ac
2
This model assumes that a single loop process of res-
idential relocation represent two years in the real-world.
Therefore, 20 loop processes correspond to simulating 40
years of urban dynamics in the real-world.
D
ac
(agent) indicates the number of other house-
hold agents traveling on foot or by bicycle within
100 meters radius centering on the relevant household
agent. η
ac
indicates coefficient of activeness. The
total travel cost is reduced by the amount obtained
by multiplying the activeness value P with preference
bias w
P
. The coefficient of activeness can be regarded
as a level of effort to bring further street activeness
within the relevant range according to the agglom-
eration of pedestrians. This coefficient is enhanced
by projects such as arranging comfortable sidewalks
and cycling roads, arranging attractive retail stores,
or holding attractive events. Improvement in this co-
efficient enhances the benefit for travel on foot or
by bicycle and increases a balanced total travel cost.
Therefore, this coefficient can be regarded as a coef-
ficient of gain.
3.6 Sub-model of Residential Relocation
After all household agents fix their travel mode in one
way, 1/10 of all household agents randomly chosen
relocate their residence. To the relevant household
agents, 10 of candidate residences are presented ran-
domly. Each household agents relocate to the candi-
date residence of which total living cost is the mini-
mum. Travel cost (time) and rent are particularly sig-
nificant constraints for those that households face on
relocation (Acheampong and Silva, 2015) (Taniguchi
and Takahashi, 2011). Based on these findings, the to-
tal living cost of these candidates is set as sum of total
travel cost and land rent. The total travel cost is cal-
culated by conducting virtual daily travel from a can-
didate residence based on the fixed travel mode fixed
through learning. The land rent for the candidate res-
idence increases corresponding to the agglomeration
of neighboring residences and job locations. In other
words, the local interactions between households, and
between a household and an environment, also impact
the change in land-use pattern through the change in
land rent.
3.7 Initialization and Input Data
Setting values of parameters of the urban schematic
and household agent were set carefully based on the
various materials such as statistical data published by
public authorities e.g., the ministry of land, infrastruc-
ture and transport (MLIT, 2016), and previousstudies,
while assuming a regional city in Japan.
How to Realize a Compact City: Street Activeness and Agent-based Urban Modeling
103
3.8 Indicators to Estimate
Experimental Result
By observing the result of each experimental scenario
according to the indicators shown below.
• Percentage of each representative travel mode
• Total CO
2
emission (expressed as percentage rela-
tive to the basic scenario)
• Average travel time
• Distribution map of residences
4 EXPERIMENT 1 -
INTRODUCTION OF
TRAMWAY
4.1 Conditions of Experiment 1
The simulation here assumes that the tramway routes
imitate the ”Karlsruhe Model” (De Bruijn and Veen-
eman, 2009), where the routes are shared with ordi-
nary railway. Therefore, three routes are radially in-
stalled centering on the central station as shown on
Fig. 2, and the routes pass through CBD. Each route
has tramway stops at 400 meters intervals. Along
with this, residents can also choose the additional two
types of linked trips. The first is by train and tramway
in combination, and the other is by tramway. The ex-
periments were conducted under the conditions of the
following two types for the location of a public facil-
ity for stopping off (PFS).
• A : none (no promotion of street activeness)
• E : urban central area, 0.5km south and 0.5km east
from the central station
And the four types, 0, 10, 20, and 30, for coeffi-
cient of activeness. Hereinafter, each of these experi-
ments is expressed e.g., scenario At, Et0 - 30, by com-
bining the symbols of A and E indicating the location
of PFS, the initial letter t for the word of tram, and
the coefficient of activeness. Additionally, this sec-
tion reproduces scenario A, where tramway and PFS
were not introduced, and a promotion of street active-
ness was also not implemented, to compare with the
new scenarios and validate the simulation model.
4.2 Results of Experiment 1
Table 1 shows the quantitative result of scenario A,
At, and Et0 - 30. Fig. 3 shows the final distributions
of residences of the same scenarios.
The result of scenario At, when compared with
scenario A, shows that private automobile users de-
creased by close to 30 points, while train (and
Figure 2: Schematic of tramway routes.
tramway in combination) users increased accordingly.
Along with this, the sprawl on the periphery of CBD
was improved, and the total CO
2
emission also re-
duced considerably.
The results of scenario Et0 - 30 show that, in sce-
nario Et0, the percentages of each travel mode and
the sprawl level were almost the same as scenario
At. As advancing the promotion of street active-
ness, however, private automobile users got decreas-
ing gradually. When the scenario reached Et30, pri-
vate automobile users decreased to less than 10%, and
train (and tramway in combination) users increased to
more than 75%. Along with this, the cluster of resi-
dences of train users around the residence station was
maintained quite clearly. Additionally, tramway users
increased to more than 15%. And the total CO
2
emis-
sion also reduced to less than 30%.
Table 1: result of Experiment 1.
5 EXPERIMENT 2 - SETTING
URBAN SPRAWL AS INITIAL
STATE
5.1 Conditions of Experiment 2
This section sets the final state of scenario A as the ex-
perimental initial state. Most of the residences were
distributed on the periphery of CBD as sprawl, and
private automobile users reached close to 90%. This
shows the state after 20 loop processes of residential
relocation (corresponding to 40 years) from the zon-
ing between residences and job locations. The edge
SMARTGREENS 2019 - 8th International Conference on Smart Cities and Green ICT Systems
104
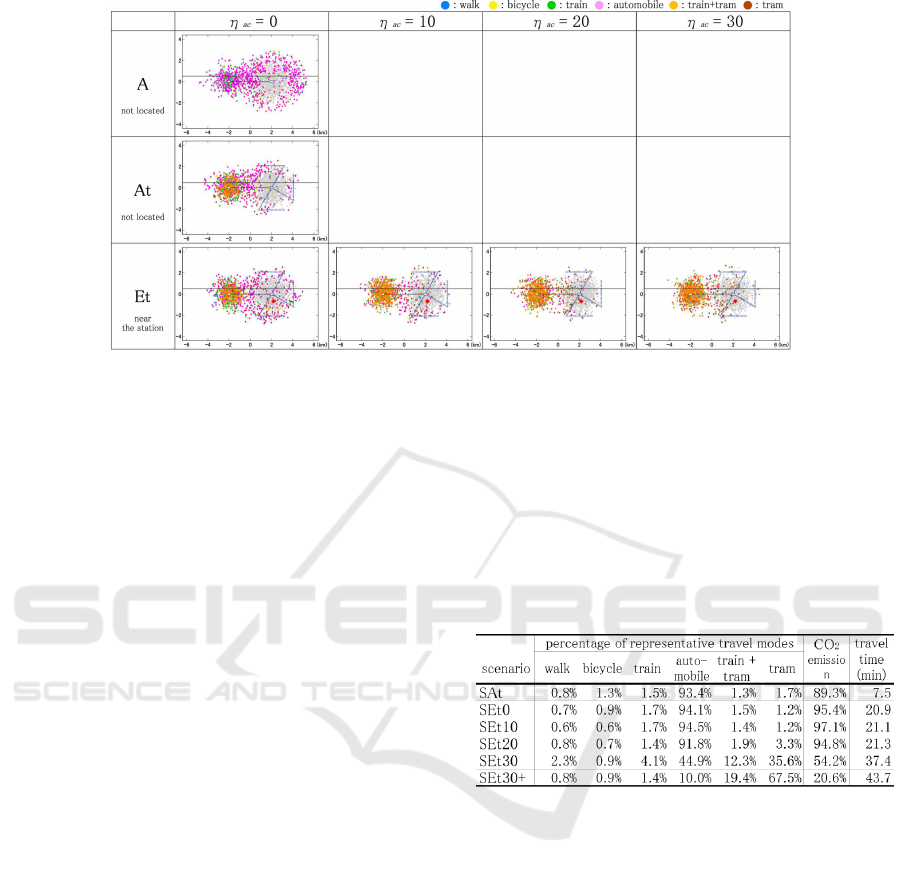
Figure 3: Residences’ final distribution of Experiment 1.
routes of tramway also pass through the suburb area
with sprawled residences.
The experiments were conducted under the condi-
tions of the two types for the location of PFS and the
four types for coefficient of activeness, like the previ-
ous section. Hereinafter, each of these experiments is
expressed e.g., scenario SAt, SEt0 - 30, by combining
the initial letter S for the word of sprawl, the symbols
of A and E indicating the location of PFS, the initial
letter t for the word of tram, and the coefficient of ac-
tiveness. Additionally, scenario SEt30+, which was
run for twice as long as SEt30, was executed.
5.2 Results of Experiment 2
Table 2 shows the quantitative result of scenario SAt,
SEt0 - 30, and SEt30+. Fig. 4 shows the final distri-
butions of residences of the same scenarios.
The result of scenario SAt shows that private auto-
mobile users increased further, and the sprawl of their
residences on the periphery of CBD also advanced
further, unlike scenario At.
The results of scenario SE0 - 30 also show that
both the decrease in the private automobile users and
the cluster of residences of train users around the res-
idence station were not observed, unlike the series of
Et. Particularly in scenario SEt0 - 20, private auto-
mobile users increased further, and the sprawl also
advanced further, like scenario SAt. In advancing
the promotion of street activeness, however, private
automobile users decreased, and tramway (and train
in combination) users increased and reached close to
50% in total in scenario SEt30.
Furthermore, the results of scenario SEt30+,
where scenario SEt30 was run further, shows that
tramway (and train in combination) users reached
close to 90% in total. Along with this, the total CO
2
emission also reduced considerably, and the follow-
ing two clusters of residences were emerged. One
is the cluster by residents commuting by train and
tramway in combination (about 20%), on centering
the residence station. The other is the cluster by res-
idents commuting by tramway alone (about 70%),
along tramway routes from the center to the periph-
ery of CBD.
Table 2: Result of Experiment 2.
6 DISCUSSION
6.1 Estimation of Experimental Results
By combining the introduction of tramway with in-
troducing a public facility for stopping off (PFS) and
promoting street activeness around it, private automo-
bile users decreased, when compared with the cases
when no policies were implemented. And train (and
tramway in combination) users increased accordingly.
Along with this, the total CO
2
emission reduced, and
the compact urban structure, which was formed ac-
cording to the zoning, was maintained. These suggest
that the synergistic effects of the above-mentioned
policies could impact positively on a both static and
dynamic urban environment. This also seems to be
because the promotion of street activeness, which is
How to Realize a Compact City: Street Activeness and Agent-based Urban Modeling
105
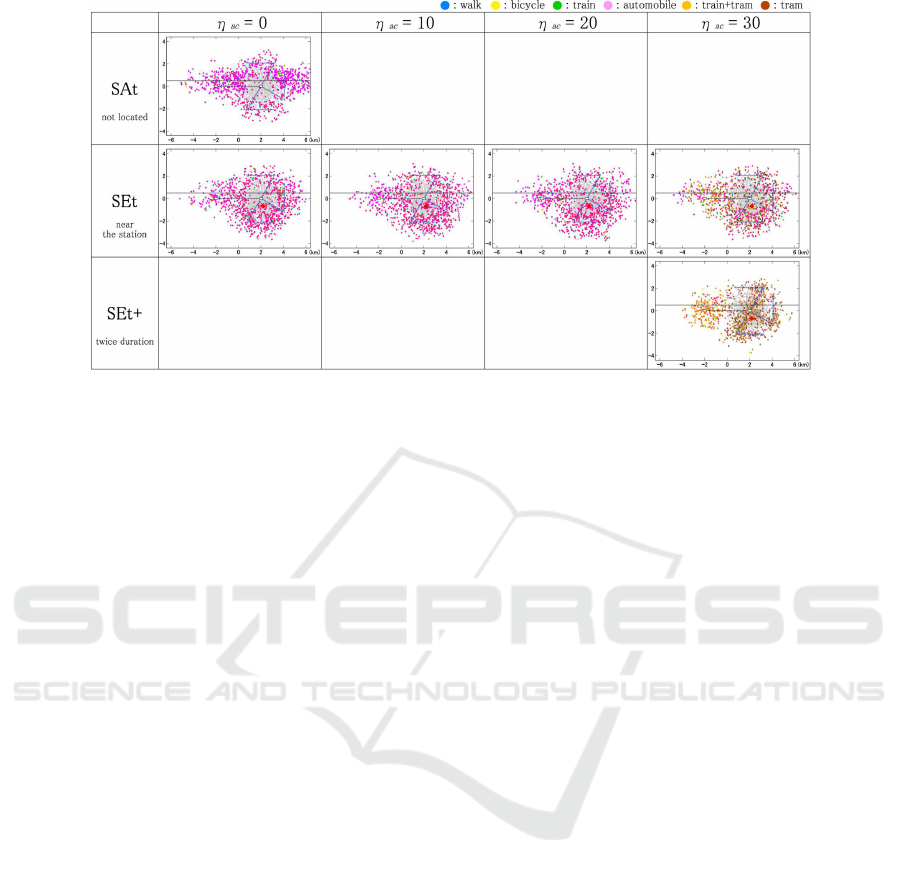
Figure 4: Residences’ final distribution of Experiment 2.
incentive to stroll about downtown, was effective to
increase tramway users.
On the other hand, where the initial state was
sprawl mainly with use of private automobiles, the
introduction of tramway could not serve to control
further sprawl and use of private automobiles. When
combined with the introduction of the public facility
and the promotion of street activeness, however, most
of private automobile users switched to tramway use,
although it took a long period. This suggests that once
residents established the lifestyle of low-density res-
idence in suburb and commuting by private automo-
bile, that becomes robust, irreversible, and very dif-
ficult to be upset. As for the residence distribution
in the same scenario, most of the residences that are
distributed along the tramway routes deviated from
the initial poly-centric compact city. This, however,
can gain the following positive evaluations of a mono-
centric compact city. First, the residents can live
where residences and job locations are nearby based
mainly on use of public transportations, resulting in
being free from traffic congestion and air pollution.
Second, mixed land-use provides the residents with a
broad range of social activities, while revitalizing the
central urban area.
Simply put, the promotion of street activeness is
a policy to lead people to walk by giving them in-
centives. On the other hand, many successful cases
of introducing tramway in the real world are charac-
terized with combining the introduction of tramway
with other policies which serve as a benefit for peo-
ple traveling on foot. That is, this experiment clar-
ified that the introduction of tramway can exert a
profound effect only when combined with policies,
which lead tramway users’ stroll before and after they
use a tramway, and how it can offer great benefits.
6.2 Validation of the Simulation Model
Because of the property of emergence in complex
self-organizing systems, ABMs should be validated
in terms of whether it can capture the basic features
of the system in the real-world (Wu, 2002). Pattern-
Oriented Modeling (POM) procedure is an effective
validation procedure. In POM procedure, after iden-
tifying the observed patterns in the real-world charac-
terizing the system to be modeled, an ABM is evalu-
ated by whether the observed patterns are reproduced
(Railsback and Grimm, 2011).
First, the history of urban area in Japan for 40
years based on 1970 and the history of residential area
in scenario A for the first experiment are very similar,
so this scenario can be regarded as reproducing the
fact of the constant expansion of urban area in many
cities in Japan (Eaton and Eckstein, 1997). Addition-
ally in this scenario, the residence distribution signif-
icantly changed from separation between residences
and job locations to sprawl on the periphery of CBD.
This can be regarded as the reproductionof the growth
process of a concentric low-density suburb based on
the mono-centric urban model proposed by Alonso
(1964) (Alonso, 1964), and subsequently supported
by many related researches. Next, the travel mode
used by most of the household agents has switched
from train to private automobiles. This can be also
regarded as the reproduction of the fact that the main
travel mode in commuting has switched from train to
private automobiles (MLIT, 2016).
Our highly abstracted urban dynamics model
based on a small number of elements and simple
rules reproduced the above multiple social phenom-
ena which were not directly incorporated into the
model. These reproductionsdemonstrate that the sim-
SMARTGREENS 2019 - 8th International Conference on Smart Cities and Green ICT Systems
106

ulation model can explain the real society to a certain
level, and the experimental results of this research are
valid.
7 CONCLUSION
The purpose of this research was to verify the ef-
fectiveness of the combination of the introduction of
tramway with introducing a public facility for urban
residents and promoting street activeness around it,
on urban sprawl. An agent-based model (ABM) for
simulating the changes of urban structure through au-
tonomous behavior of urban residents was designed.
Then the simulations were conducted based on the as-
sumption of zoning between residences and job loca-
tions as the initial state and combining these policies.
These were followed by other simulations based on
the assumption of setting urban sprawl as the initial
state. As a result, this research clarified the follow-
ing points and how they were. First, the synergistic
effects of the introduction of tramway, the proper lo-
cation of a public facility, and the promotion of street
activeness around it, are effective in maintaining a
poly-centric compact city in accordance with the ini-
tial plan. Second, the introduction of tramway tar-
geting the urban sprawl can exert a profound effect
only when combined with the above-mentioned poli-
cies, which lead tramway users’ stroll before and af-
ter riding the tramway, although it takes a long period.
Third, a mono-centric compact city is realized along
with the above-mentioned point, while improving the
living environment for the residents and revitalizing
the urban central area.
REFERENCES
MLIT (2016). White paper on land, infrastructure and trans-
port in 2016 - the ministry of land, infrastructure and
transport. http://www.mlit.go.jp/hakusyo/mlit/h28/
index.html.
Acheampong, R. A. and Silva, E. (2015). Land use–
transport interaction modeling: A review of the litera-
ture and future research directions. Journal of Trans-
port and Land Use, 8(3).
Alonso, W. (1964). Location and land use. toward a general
theory of land rent.
Batty, M. (2007). Cities and complexity: understand-
ing cities with cellular automata, agent-based models,
and fractals. The MIT press.
Behan, K., Maoh, H., and Kanaroglou, P. (2008). Smart
growth strategies, transportation and urban sprawl:
simulated futures for hamilton, ontario. The Canadian
Geographer/Le G´eographe canadien, 52(3):291–308.
De Bruijn, H. and Veeneman, W. (2009). Decision-making
for light rail. Transportation Research Part A: Policy
and Practice, 43(4):349–359.
Deal, B. and Schunk, D. (2004). Spatial dynamic model-
ing and urban land use transformation: a simulation
approach to assessing the costs of urban sprawl. Eco-
logical Economics, 51(1):79–95.
Eaton, J. and Eckstein, Z. (1997). Cities and growth: The-
ory and evidence from france and japan. Regional sci-
ence and urban Economics, 27(4-5):443–474.
Jacobs, J. (1969). The economy of cities. Vintage Books.
Johnson, M. P. (2001). Environmental impacts of ur-
ban sprawl: a survey of the literature and pro-
posed research agenda. Environment and planning A,
33(4):717–735.
Kakoi, M., Nakamura, R., and Saito, S. (2010). Causal
structure modeling of consumer’s decision-making on
selection of commercial facilities. Fukuoka University
economics review, 54(3-4):241–256.
Landry, C. (2012). The creative city: A toolkit for urban
innovators. Earthscan.
Ligtenberg, A., Bregt, A. K., and Van Lammeren, R. (2001).
Multi-actor-based land use modelling: spatial plan-
ning using agents. Landscape and urban planning,
56(1):21–33.
Nagai, H. and Kurahashi, S. (2017). Bustle changes the city
- facility for stopping off and modeling urban dynam-
ics. Transactions of the Japanese Society for Artificial
Intelligence, 32(1):D–G26
1.
United Nations Department of Economic and Social Affairs
(2012). World urbanization prospects, the 2011 revi-
sion. In Final Report with Annex Tables. United Na-
tions, New York.
Railsback, S. F. and Grimm, V. (2011). Agent-based and
individual-based modeling: a practical introduction.
Princeton university press.
Ramming, M. S. (2001). Network knowledge and route
choice. Unpublished Ph. D. Thesis, Massachusetts In-
stitute of Technology.
Schneider, A. and Woodcock, C. E. (2008). Compact, dis-
persed, fragmented, extensive? a comparison of ur-
ban growth in twenty-five global cities using remotely
sensed data, pattern metrics and census information.
Urban Studies, 45(3):659–692.
Taniguchi, T. and Takahashi, Y. (2011). Multi-agent simu-
lation about urban dynamics based on a hypothetical
relationship between individuals’ travel behavior and
residential choice behavior. Transactions of the Soci-
ety of Instrument and Control Engineers, 47(11):571–
580.
Tsai, Y.-H. (2005). Quantifying urban form: compactness
versus’ sprawl’. Urban studies, 42(1):141–161.
Wu, F. (2002). Calibration of stochastic cellular automata:
the application to rural-urban land conversions. In-
ternational Journal of Geographical Information Sci-
ence, 16(8):795–818.
How to Realize a Compact City: Street Activeness and Agent-based Urban Modeling
107
