
Performance Evaluation of Universities and Colleges based on
Method of Principal Component Analysis and Data Envelopment
Analysis
Yan Xia, Xinlin Wu and Hui Feng
Shanghai Joint Laboratory for Discipline Evaluation, Shanghai Education Evaluation Institute, Shanghai, China
Keywords: Principal Component Analysis, Data Envelopment Analysis, Dimension Reduction, Higher Education
Performance and Performance Evaluation.
Abstract: The implementation of performance evaluation on higher education is beneficial to optimize resource
allocation and to promote sustainable development of higher education. It is challenging how to establish a
scientific model of performance evaluation on universities and colleges objectively. This paper proposes a
method of performance evaluation based on Data Envelopment Analysis with dimension reduction of
performance evaluation indicators based on Principal Component Analysis. An automatic system is
developed, implementing the method and analysing data from universities and colleges in Shanghai. It
provides advice and guidance for performance evaluation, and establishes foundation for higher education
development strategy.
1 INTRODUCTION
With the reform of public management system, the
expansion of demand for education resources, and
the continuous growth of education financial input in
China, the government and the society pay more
attention to the performance of higher education.
Performance evaluation of higher education is the
core part of performance management system
(Sarrico et al., 2010). With the evaluation result as
basis of decision making of higher education
management, it can improve the utility efficiency of
funds and optimize resource allocation. Thus it
promotes development of construction and optimizes
discipline distribution in universities and colleges
(Wang and Feng, 2012). It has become a hotspot in
higher education field how to implement systematic
and scientific performance evaluation to promote the
development of universities and colleges. Currently
there are some problems in performance evaluation
of universities and colleges. Firstly, the evaluation
indicator system is complicated, in which some
indicators have implicit dependency on others.
Secondly, the evaluation process is easily influenced
by subjective factors. Thirdly, there are uniform
evaluation criteria for different types of universities
and colleges. Therefore the evaluation result isn’t so
inaccurate due to the above reasons.
This paper proposes an optimized performance
evaluation method based on Principal Component
Analysis (PCA) and Data Envelopment Analysis
(DEA). PCA is used to remove dependent indicators
so as to simplify the performance evaluation
indicator system by reducing dimension. DEA is
used to establish model of performance evaluation.
Then it analyses data from universities and colleges
by the method comprehensively and systematically.
It enriches the content of performance evaluation of
universities and colleges. It provides advice and
guidance for scientific development strategy in
universities and colleges.
2 RELATED WORK
Performance evaluation of universities and colleges
is carried out in about 1980s, the result of which is
considered as significant evidence of resource
allocation and management mode improving. Higher
Education Funding Council for England (HEFCE),
Scottish Higher Education Funding Council
(SHEFC), Higher Education Funding Council for
Wales (HEFCW) and the Department of
Xia, Y., Wu, X. and Feng, H.
Performance Evaluation of Universities and Colleges based on Method of Principal Component Analysis and Data Envelopment Analysis.
In Proceedings of the 11th International Conference on Computer Supported Education (CSEDU 2019), pages 55-61
ISBN: 978-989-758-367-4
Copyright
c
2019 by SCITEPRESS – Science and Technology Publications, Lda. All rights reserved
55
Employment and Learning, Northern Ireland etc
organize Research Assessment Exercise (RAE),
responsible for evaluating the quality of research for
higher education institutes in UK and allocating
funds (Kitagawa and Lightowler, 2013). Association
of universities in the Netherlands (VSNU) is
responsible for the process of external evaluation of
universities (Bosch and Christine, 2000). Australian
University Quality Agency (AUQA) and Australia
Higher Education Evaluation Committee do
performance evaluation for universities from various
perspectives (CWA, 2003). The performance
evaluation of higher education in China officially
began from 21
st
Century. Performance Evaluation
Report of Universities in China was published by
National Institute of Education Sciences.
Performance evaluation of 72 universities which are
led by Ministry of Education of China was
conducted in the report (NIES, 2009). The kinds of
performance evaluation above mainly use traditional
expert evaluation method and statistical analysis
method combining with input-output model.
However the evaluation indicator system is
complicated with implicit dependent indicators. The
evaluation result is easy to be influenced by the
subjectivity etc during the evaluation process
(Afsharian and Emrouznejad, 2018) .
In order to solve the existing problems in
performance evaluation of universities and colleges,
this paper proposes a new evaluation method based
on PCA and DEA. An automatic system is
developed, implementing the method and analysing
data from universities and colleges.
3 PERFORMANCE EVALUATION
METHOD BASED ON DEA AND
PCA
The performance evaluation method of universities
and colleges is based on DEA and PCA. The theory
of DEA and PCA is introduced firstly. The method
is then described in details in application.
3.1 Model of PCA
PCA is a multivariate statistical analysis method that
converts multiple indicators into fewer
comprehensive independent ones (Warmuth and
Kuzmin, 2008). It is widely used in the fields of
economics and management science (Abdi and
Williams, 2010). In multi-indicator systems, there
are always dependencies among indicators, which
reveal overlapping information. PCA takes the idea
of dimension reduction to simplify the situation (Liu
et al., 2017). Several principal independent
indicators are chosen to represent the whole
components, which contains information as much as
possible in the system. The basic steps of PCA are as
follows.
1. Standardize sample data.
Let
be the
sample data matrix. is the sample size. is the
number of indicators. Standardize matrix X as
.
(1)
(2)
2. Set dependency matrix of indicators.
Let
,
is the
dependency coefficient of indicators i and j, which
expresses the correlation between them.
(
(3)
3. Find the eigenvalue and eigenvector of matrix R,
and get the principal component expression.
According to eigen equation
, p
eigenvalues are obtained,
which are
arranged as
.
is the variance
of principal indicator, which indicates its importance
in evaluation indicator system. Each eigenvalue
corresponds to an eigenvector
. Principal indicators are
converted to principal component expression,
.
(4)
4. Find the variance contribution rate to determine
the number of principal components.
Due to the dependency of indicators, k (k<p)
principal components are chosen to do performance
evaluation. If the accumulation variance
contribution rate, VCR, is greater or equal to 95%,
almost all the information of indicator system is
contained in these principal components.
CSEDU 2019 - 11th International Conference on Computer Supported Education
56

95%
(5)
3.2 Model of DEA
DEA is a system evaluation method based on relative
efficiency (Ramanathan, 2003)( Chen and Zhu,
2018). It overcomes limits of existing methods
(Bouwmans et al., 2015). The universities and
colleges which are participated in the performance
evaluation are considered as decision making unit
(DMU). The operation process can be considered as
converting the input resource to output (Avkiran,
2001). Therefore the performance of universities and
colleges can be evaluated by the input and output.
After simplifying the evaluation indication system by
dimension reduction of PCA, the basic steps of DEA
are as follows.
1. Set the input and output indicators with principal
components.
Let
,
. They are the input and
output of jth university or college.
2. Calculate the comprehensive efficiency,
, and
technical efficiency,
, by C2R and VRS model of
DEA.
(6)
(7)
is the input redundancy, while
is the
output deficiency.
3. Determine the performance of universities and
colleges.
Definition 1
If
, it is weak efficiency of
for
C
2
R model.
If
, it is efficiency of
for C
2
R model.
Definition 2
If
, it is weak efficiency of
for
VRS model.
If
, it is efficiency of
for VRS model.
Definition 3
Set
as the performance efficiency
rate. According to (6) and (7),
,
Definition 4
If
, performance efficiency rate of
is efficient.
If
, performance
efficiency rate of
decreases.
If
, performance
efficiency rate of
increases.
Use the calculation of (6) and (7) to do
performance evaluation of universities and
colleges.
4 APPLICATION OF THE
METHOD ON PERFORMANCE
EVALUATION OF
UNIVERSITES
4.1 Evaluation Indicator System of
University and College
Performance
This paper uses the optimized evaluation indicators
from Performance Evaluation Indicator System for
reference, which is promulgated by National Institute
of Education Sciences (NIES, 2009). The content of
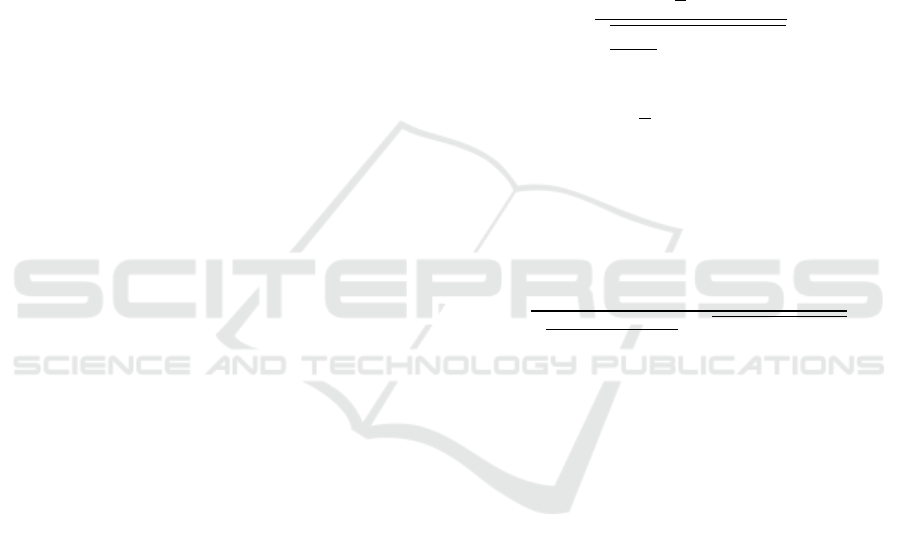
Performance Evaluation Indicator System is shown in
Table 1. The Evaluation Indicator System is
composed of 2 parts, input indicators and output
indicators. Input indicators consist in 3 primary
indicators, including Human Resource, Financial
Resource, and Material Resource. Output indicators
consist in 4 primary indicators, including Personnel
Cultivation, Scientific Research, Social Service,
Development and Characteristics. Each primary
indicator is composed of several secondary
indications, 14 secondary indicators in all. Each
secondary indicator contains some observation points
with different weight, which can be considered as
Performance Evaluation of Universities and Colleges based on Method of Principal Component Analysis and Data Envelopment Analysis
57
tertiary indicators. For example, Personnel
Cultivation, one of the primary indicators, contains 2
secondary indicators. There are 15 observation points
in Cultivation Quality, one of the secondary
indicators, such as Survey result of student
satisfaction, Number of teaching achievement award
and so on. There are 68 observation points in all.
Table 1: Performance Evaluation Indicator System.
Parts
Primary
Secondary
Observation Point
Input
Human Resource
Teacher Structure
Number of full-time teachers and researchers
Number of part-time teachers in enterprises
Outstanding teachers
Ratio of full-time teachers with oversea learning experiences
Ratio of doctoral degree in full-time teachers and researchers
Number of professor and associate professor
…
Student Structure
Average score in college entrance examination
Ratio of master students who graduate from first class universities
Ratio of master students who graduate from excellent universities
…
Financial
Resource
Financial Income
Amount of government funds (RMB)
Amount of business expenses (RMB)
…
Tuition and other Income
Amount of appropriation for education (RMB)
…
Material Resource
Teaching Area
Covering area
…
Teaching Resource
Number or volume of books
Value of fixed assets
Amount of experimental facilities
…
Output
Personnel
Cultivation
Cultivation Scale
Number of students
Number of graduate students
…
Cultivation Quality
Survey result of student satisfaction
Number of teaching achievement award
Number of foreign students with academic background
Rate of employment signature
Survey result of employer satisfaction
…
Scientific
Research
Research Funds
Amount of science and technology funds (RMB)
…
Research Achievement
Number of monograph
Number of academic papers published domestically and internationally
Number of science and technology projects
Number of patent authorizations
…
Social Service
Research
Number of transformation of achievement
Number of contract of technology transfer
Income of technology transfer (RMB)
Number of consulting report
…
Teaching
Teaching resources open to society
…
Development
Characteristics
Financial Management
…
Innovation and
Improvement
…
CSEDU 2019 - 11th International Conference on Computer Supported Education
58
4.2 Data Selection
In order to ensure authenticity, reliability and
authority, all the data related to the Performance
Evaluation Indicator System are from reports of the
educational administrative department, reports of
universities and colleges. Performance evaluation is
implemented on 61 universities and colleges in
Shanghai. According to the regular pattern of higher
education, the output is hysteretic to input. Data of
continuous five years are collected, and the average
value is taken as the attribute value of the indication.
4.3 Dimension Reduction of Evaluation
Indicator System by PCA
SPSS Statistic 24.0 is used to do PCA to reduce
dimension of evaluation indicator system.
4.3.1 Principal Component Selection of
Indicator System
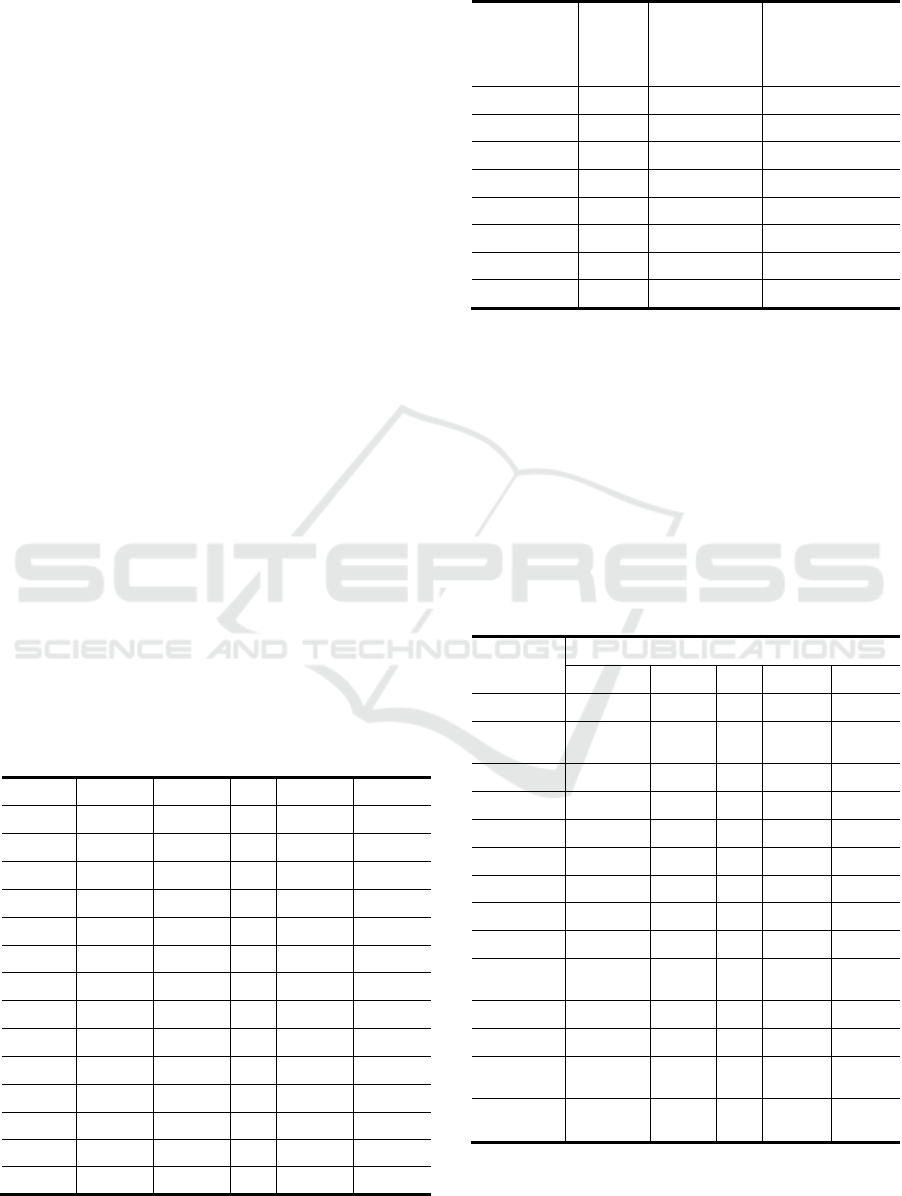
The dependency matrix of input and output indicators
is analysed by PCA firstly with accumulation variance
contribution rate, VCR, greater or equal to 955%. The
dependency matrix of input indicators is shown in
table 2. The eigenvalue and accumulation variance
contribution rate are shown in table 3. The input
indicators can be transferred to 28 principal
components.
The dependency matrix of output indicators,
accumulation variance contribution rate and the
output principal components can be obtained in the
same way.
Table 2: The dependency matrix of input indicators.
Input
1
Input
2
Input
3
…
Input
67
Input
68
0.7401
0.5120
0.9541
…
0.6739
0.0658
0.7093
0.5109
0.9502
…
0.4348
0.1202
0.5508
0.5037
1.0000
…
0.1008
0.2303
0.4519
0.5047
0.9595
…
0.0692
0.1159
0.9117
0.6738
0.9531
…
0.1403
0.0529
…
…
…
…
…
…
…
…
…
…
…
…
0.6062
0.6703
0.9464
…
0.2194
1.0000
0.4003
0.6649
0.9338
…
0.5000
0.1073
0.5119
0.5144
0.9826
…
0.0020
0.6924
0.4939
0.6275
0.8968
…
0.2300
0.1116
1.0000
0.9261
1.0000
…
0.0020
0.0973
0.9164
1.0000
1.0000
…
0.0000
0.0086
0.5989
0.6360
1.0000
…
1.0000
0.0100
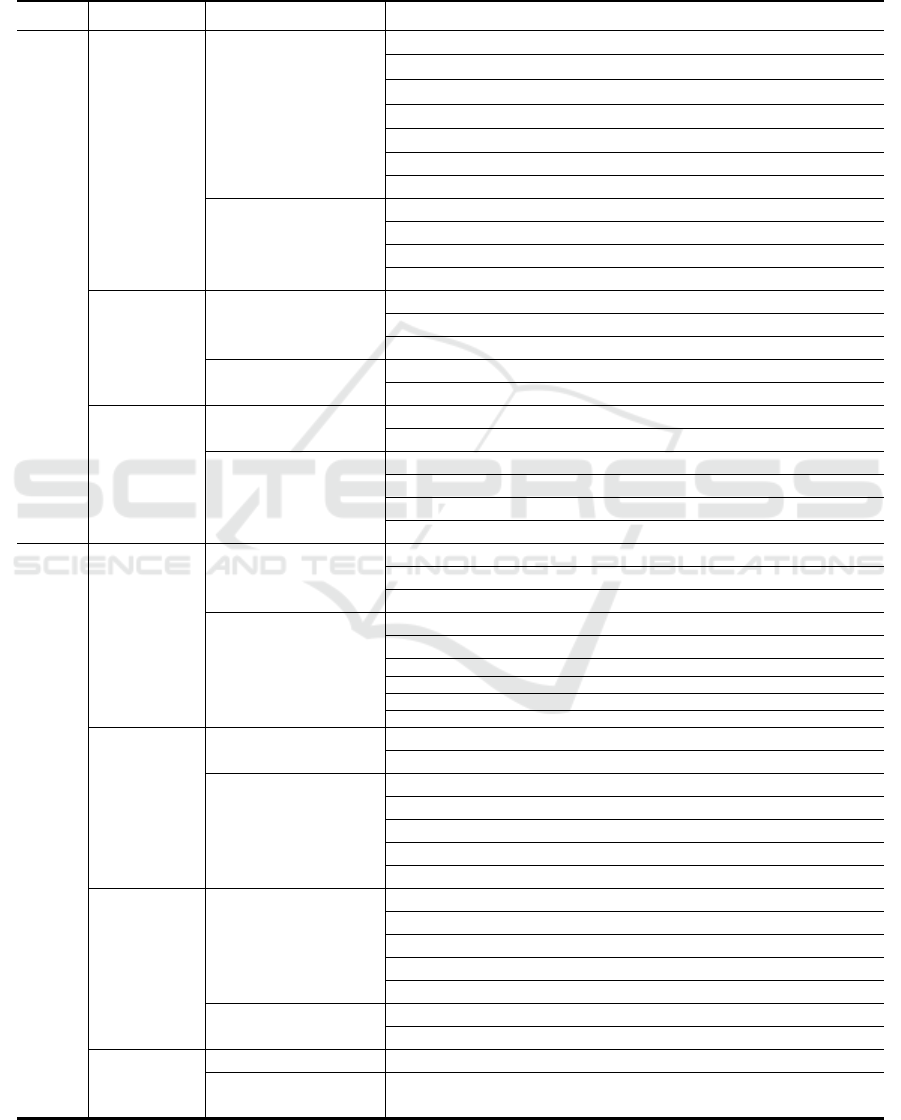
Table 3: The eigenvalue and accumulation variance
contribution rate.
Component
Eigen
value
variance
contribution
rate
accumulation
variance
contribution
rate
F
1
4.208
35.065%
35.065%
F
2
2.276
18.967%
54.032%
F
3
2.169
18.079%
72.111%
F
4
2.012
17.725%
80.361%
…
…
…
…
…
…
…
…
F
27
0.617
7.538%
93.479%
F
28
0.548
6.901%
95.012%
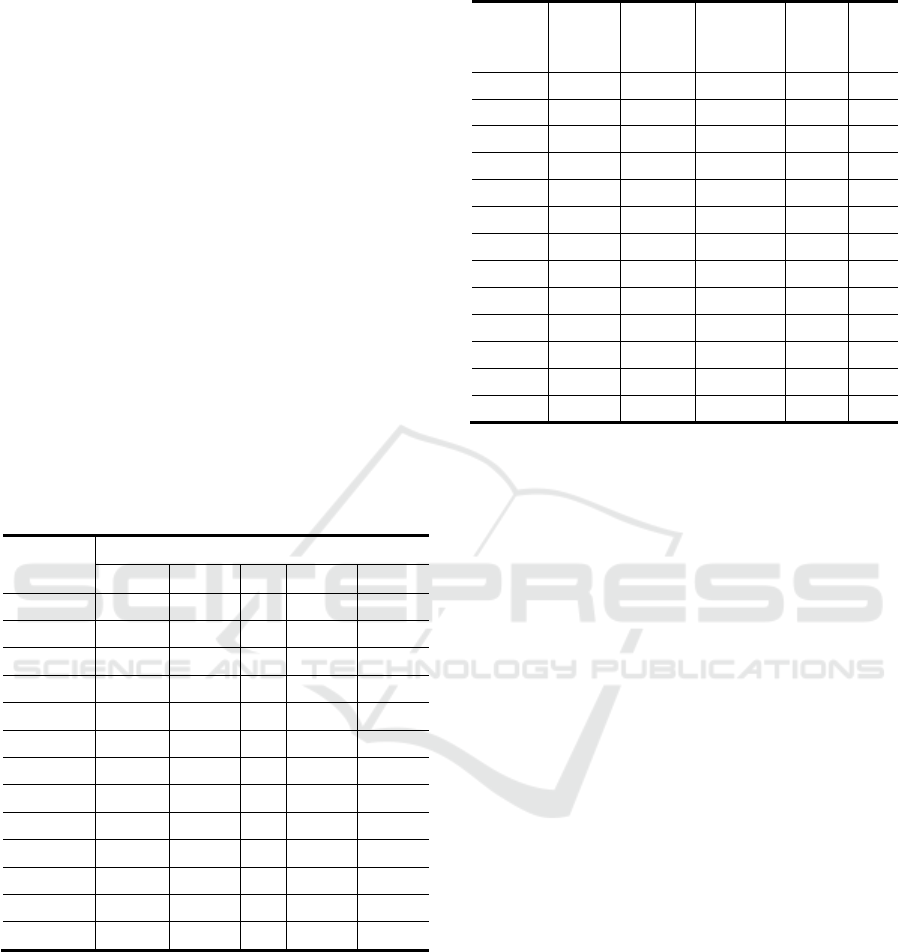
4.3.2 Principal Component Expression
Through varimax rotation, the principal component
matrix of input indicators is shown in table 4. The
principal component expression is shown in (8). The
coefficient reflects the influence of original input
indicators.
The principal component matrix of output
indicators and output principal component
expression can be obtained in the same way.
Table 4: The principal component matrix of input
indicators.
Input
Indicators
Principal Components
F
1
F
2
…
F
27
F
28
Input
1
0.247
0.597
…
0.520
0.364
Input
2
-0.245
-
0.307
…
0.404
0.771
Input
3
-0.246
0.323
…
0.570
-0.158
Input
4
0.848
0.112
…
0.276
0.239
Input
5
0.790
0.474
…
-0.268
0.106
…
…
…
…
…
…
…
…
…
…
…
…
Input
62
0.951
0.039
…
-0.009
0.113
Input
63
0.929
0.145
…
-0.064
-0.09
Input
64
0.669
-
0.549
…
0.457
-0.054
Input
65
0.019
0.600
…
0.184
-0.671
Input
66
-0.254
0.759
…
0.119
0.232
Input
67
0.484
-
0.095
…
-0.782
0.071
Input
68
0.411
-
0.463
…
0.626
-0.442
Performance Evaluation of Universities and Colleges based on Method of Principal Component Analysis and Data Envelopment Analysis
59
(8)
4.4 Performance Evaluation by DEA
MATLAB 2017a and DEAP 2.1 are used to do DEA
to evaluate the performance of 61 universities and
colleges in Shanghai.
4.4.1 Comprehensive Score of Principal
Components of Input and Output
Indicators
According to the principal component expression,
comprehensive score of principal components of
input and output indicators can be calculated. The
eigenvalue is set as weight of corresponding
principal component. The comprehensive score of
input indicators is shown in table 5 for example.
Table 5: The comprehensive score of input indicators.
University
and
College
Principal Components
F
1
F
2
…
F
27
F
28
DMU
1
2.8621
2.4989
…
0.6527
0.0604
DMU
2
2.3737
1.8620
…
0.6527
0.0555
DMU
3
2.0445
1.0124
…
0.6527
0.0331
DMU
4
2.2334
2.4351
…
0.6527
0.8824
DMU
5
2.7093
2.1054
…
0.8824
0.1672
…
…
…
…
…
…
…
…
…
…
…
…
DMU
56
1.8124
1.7335
…
0.8824
0.1937
DMU
57
1.4282
1.0487
…
0.8824
0.1722
DMU
58
1.1745
1.6277
…
1.1268
0.6217
DMU
59
0.9424
1.1940
…
0.8342
0.4670
DMU
60
1.9292
0.2176
…
0.0090
0.9522
DMU
61
3.8928
1.3893
…
0.6210
0.6037
4.4.2 DEA Operation to Evaluate
Performance
Comprehensive score of principal components of
input and output indicators are standardized as input
parameters in DEA module. Comprehensive
efficiency,
, and technical efficiency,
, in (6)
and (7) are calculated to evaluate the performance of
61 universities and colleges in Shanghai. The
evaluation result is shown in table 6.
Table 6: Performance Result of Universities and Colleges.
University
and
College
Compreh
ensive
Efficienc
y
Technic
al
Efficien
cy
Performanc
e Efficiency
Rate
Perfor
mance
Ranki
ngs
DMU
1
1.0000
1.0000
1.0000
-
1
DMU
2
0.7969
1.0000
0.7969
decrease
8
DMU
3
0.7269
0.7841
0.9271
decrease
19
DMU
4
0.6532
0.7025
0.6254
-
31
DMU
5
0.7453
0.7453
1.0000
increase
10
…
…
…
…
…
…
…
…
…
…
…
…
DMU
56
0.4450
0.5237
0.5028
increase
47
DMU
57
0.7308
0.9612
0.7603
-
11
DMU
58
0.6357
0.7147
0.5896
decrease
26
DMU
59
0.4891
0.7532
0.5230
-
38
DMU
60
0.8525
0.9758
1.0000
-
5
DMU
61
0.6984
0.9892
0.7131
decrease
23
4.5 Performance Evaluation Result
Analysis
From the running result of MATLAB 2017a and
DEAP 2.1, comprehensive efficiency, , technical
efficiency, , and performance efficiency rate, , of
61 DMUs are obtained.
Since , universities and
colleges of DMU
1
, DMU
5
, DMU
60
, etc are efficient
by DEA. They obtain better achievement in
performance. The ratio of efficient DMU is 50%. It
shows that the performance management of higher
education in Shanghai is better.
Since , universities and
colleges of DMU
2
, DMU
4
, DMU
61
etc are
insufficient or redundant in input investment while
the internal management and resource allocation is
rational. After analysing , performance efficiency
rate of DMU
2
and DMU
61
are found in the status of
decreasing, while performance efficiency rate of
DMU
4
are in the status of increasing. Therefore the
universities of DMU
2
and DMU
61
shall reduce input
investment and increase output efficiency. The
university of DMU
4
shall increase input investment
in order to improve the output efficiency.
Since, universities and
colleges of DMU
38
etc are rational in current scale
status. It shall optimize management quality and
resource allocation.
Since, universities and
colleges of DMU
38
etc are inefficient by DEA. It
shall optimize in current scale, management scale
and resource allocation. After analysing , there are
CSEDU 2019 - 11th International Conference on Computer Supported Education
60

redundant input investment in these universities and
colleges. Human resource and financial resource
shall be optimized.
In general, the performance evaluation method of
universities and colleges based on PCA and DEA
pays attention to dimension reduction in indicator
system and value combination of comprehensive
efficiency, technical efficiency and performance
efficiency rate, etc. The rankings of the performance
of 61 universities and colleges in Shanghai by this
method is consistent with the popular university and
college rankings in the country.
5 DISCUSSION AND
CONCLUSIONS
This paper proposes a new method of performance
evaluation based on PCA and DEA. PCA is used to
simplify the performance evaluation indicator
system by reducing dimension. DEA is implemented
to evaluate performance of universities and colleges.
61 universities and colleges in Shanghai are
carefully analysed by the method. The study of the
method is helpful to reveal improve the utility
efficiency of funds and resource allocation.
Meanwhile it provides basis for the educational
administrative department to develop new optimized
strategies for higher education.
In the future, we will take further research on
analysing specific principal component with PCA
and DEA to deduce performance evaluation result
more scientifically.
ACKNOWLEDGEMENTS
This work is supported by the Young Scholar in
University Cultivation Fund of Shanghai Municipal
Education Commission (Grant Nos: ZZPGY14002)
and ISTIC-THOMSON REUTERS Joint
Scientometrics Laboratory Open Fund. The Open
Fund is set up by Institute of Scientific and
Technical Information of China and company of
Thomson Reuters. The authors thank Jie Yang
(Professor in Graduate School of Education at
Shanghai Jiao Tong University) and Zhongping
Zhang (Professor in School of Information Science
and Engineering at Yanshan University) for helpful
discussions. Finally, we thank the reviewers for
helpful suggestions leading to an improved
manuscript.
REFERENCES
Abdi, H., Williams, L.J., 2010. Principal Component
Analysis, Wiley Interdisciplinary Reviews:
Computational Statistics, vol. 2.
Avkiran, N.K., 2001. Investigation Technical and Scale
Efficiencies of Australian Universities through DEA,
Socio Economic Planning Sciences, vol. 35.
Bosch, H., Christine, Teelken, 2000. Organisation and
Leadership in Higher Education: Learning from
Experiences in the Netherlands, Higher Education
Policy, vol. 13.
K. Chen, J. Zhu, 2018. Scale efficiency in two-stage
network DEA, Journal of the Operational Research
Society, vol. 2.
Common Wealth of Australia, 2003. Our Universities:
Backing our Future, Canberra: DEST.
H. A. Afsharian, A. Emrouznejad, 2018, Recent
developments on the use of DEA in the public sector,
Socio-Economic Planning Sciences, vol. 61.
Kitagawa, F., Lightowler, C., 2013. Knowledge Exchange:
A Comparison of Policies, Strategies, and Funding
Incentives in English and Scottish Education,
Research evaluation, vol. 22.
National Institute Of Education Sciences, 2009.
Performance Evaluation of Universities under the
Ministry of Education in China, University Academic,
vol. 11.
Ramanathan, R., 2003. An Introduction to Data
Envelopment Analysis: A tool for Performance
Measurement, Sage Publishing, 1st edition.
Sarrico, C.S., Rosa, M.J., Teixeira, P.N. et al., 2010.
Assessing Quality and Evaluating Performance in
Higher Education: Worlds Apart or Complementary
Views, Minerva, vol. 48.
T. Bouwmans, A. Sobral, S. Javed, S. Jung, E. Zahzah,
2015. Decomposition into Low-rank plus Additive
Matrices for Background/Foreground Separation: A
Review for a Comparative Evaluation with a Large-
Scale Dataset. Computer Science Review. 23: 1
Wang, Qi, Feng, Hui, 2012. Research on Performance
Evaluation of Higher Education, Higher Education
Press. Beijing, 1st edition.
Warmuth, M.K., Kuzmin, D., 2008. Randomized Online
PCA Algorithms with Regret Bounds that are
Logarithmic in the Dimension, Journal of Machine
Learning Research, vol. 9.
Y. Liu, G. Zhang, B. Xu, 2017. Compressive sparse
principal component analysis for process supervisory
monitoring and fault detection. Journal of Process
Control, vol. 50.
Performance Evaluation of Universities and Colleges based on Method of Principal Component Analysis and Data Envelopment Analysis
61
