
Managing Application-level QoS for IoT Stream Queries in Hazardous
Outdoor Environments
Holger Ziekow
1
, Annika Hinze
2
and Judy Bowen
2
1
Business Information Systems, Furtwangen University, Germany
2
Computer Science Department, Waikato University, New Zealand
Keywords:
Internet of Things, Quality of Service, RIoT, Stream Queries, Complex Event Processing, Hazard Prevention.
Abstract:
While most IoT projects focus on well-controlled environments, this paper focuses on IoT applications in the
wild, i.e., rugged outdoor environments. Hazard warnings in outdoor monitoring solutions require reliable
pattern detection mechanisms, while data may be streamed from a variety of sensors with intermittent com-
munication. This paper introduces the Morepork system for managing application-level Quality of Service in
stream queries for rugged IoT environments. It conceptually treats errors as first class citizens and quantifies
the impact on application level. We present a proof of concept implementation, which uses real-world data
from New Zealand forestry workers.
1 INTRODUCTION
It is the now well-established aim of the Internet-of-
Things (IoT) to merge physical and virtual worlds
with the goal of creating so-called ‘smart environ-
ments’. However, most IoT initiatives emphasise ver-
sions of smart cityscapes. Our project context targets
the harder problem of a smart landscape, which will
then be equally applicable to an urban setting.
In rugged, hard-to-reach and rough environments,
such as hazardous outdoor workplaces (e.g., forestry,
mining, and fishing) or recreational spaces (e.g.,
mountaineering and wild-water rafting), the Internet
of Things is challenged by scarcity of resources and
issues of robustness. Data may have to be obtained
from sensor-equipped safety clothing (or other body-
area-network contexts) as well as from machine-
based sensors.
Our project embraces the notion of a Rugged In-
ternet of Things– RIoT (Bowen et al., 2017b), sup-
porting robust communication in remote outdoor en-
vironments that involve factors not typically consid-
ered in city-focussed IoT (weather, heavy machin-
ery, safety clothing, environmental hazards and po-
tentially rough handling). Communication may be in-
termittent and collaboration/data transfer between dif-
ferent types of sensors may be hard to establish and
maintain.
Actions may need to be taken based on aggre-
gated data and patterns detected in the RIoT. The re-
quired pattern detection mechanisms therefore have to
consider possible errors and delays in available data
streams.
This paper introduces the Morepork system,
an uncertainty quantifier system which manages
the application-level errors introduced by data
stream distortions in a rugged IoT environment,
through deliberate Quality-of-Service management
at application level. It consists of an architectural
framework that manages quality of service for RIoT
applications. In Morepork, data stream errors are
considered as first class citizens. To demonstrate we
use the real life application of the Hakituri project
(isdb.cms.waikato.ac.nz/research-projects/hakituri/)
which develops a wearable monitoring approach
for New Zealand (NZ) workers in hazardous work
environments, particularly a forestry context.
The remainder of this paper is structured as fol-
lows: Section 2 provides a RIoT use case descrip-
tion from the Hakituri project on monitoring forestry
workers in hazardous work environments and intro-
duces our concept of application-level QoS man-
agement for RIoT applications, while Section 3 de-
scribes the architecture of Morepork, which imple-
ments these QoS management concepts. A proof of
concept application of the Morepork system with real-
world data from the Hakituri project is described in
Section 4. Related approaches are discussed and com-
pared in Section 5, and the paper finishes with a sum-
mary.
Ziekow, H., Hinze, A. and Bowen, J.
Managing Application-level QoS for IoT Stream Queries in Hazardous Outdoor Environments.
DOI: 10.5220/0007656602230231
In Proceedings of the 4th International Conference on Internet of Things, Big Data and Security (IoTBDS 2019), pages 223-231
ISBN: 978-989-758-369-8
Copyright
c
2020 by SCITEPRESS – Science and Technology Publications, Lda. All rights reserved
223

2 USE CASE AND MOREPORK
CONCEPT
This section describes the use case defined by the
Hakituri project, the data collections undertaken, and
the core concept of our Morepork approach.
2.1 Use Case: Hazard Detection in NZ
Forestry Outdoor Work
Environments
Because New Zealand forestry has a high rate of
workplace fatalities, our project targets this industry’s
specific settings as a test use-case. Forestry is labour-
intensive (most work more than 40-60 h/week), with
the tree felling and breaking out being main activities
contributing to serious accidents. The work is both
physically and mentally demanding, with operations
being performed irrespective of the weather.
An independent review identified a number of fac-
tors contributing to the high accident rate such as fa-
tigue, lack of training, poor health and safety cul-
tures (Adams et al., 2014). We focus on identifica-
tion of fatigue as it results in slowing of reaction times
and decision making which are crucial to safety in a
hazardous environment. Fatigue is a subjective phys-
iological state experienced by individuals as a result
of either physical or mental exertion (Hockey, 2013).
Physiological changes occurring as one enters a fa-
tigued state can be used as indicators of reduced per-
formance, for example, changes in heart rate and heart
rate variability (physical fatigue) and reduced reaction
time (mental fatigue).
2.2 Data Collection: Personal
Monitoring of Forestry Workers
We are using data obtained in the wild through the
Hakituri project, which aims to predict hazardous sit-
uations in forestry by using wearable technology and
environmental sensors. This data constitutes the re-
sults of the first in-situ data collection on fatigue in
the forestry industry in NZ. Three studies were con-
ducted with forestry workers in their outdoor working
environment. Participants were sourced from three
forestry industry subcontractors performing harvest-
ing operations (Bowen et al., 2017a). The studies col-
lected streaming data on heart rate (HR) and heart
rate variability (HRV) as potential measures of fa-
tigue. HRV consists of changes in the time intervals
between consecutive heartbeats. They also measured
aggregated step counter data as a measure of physical
work. Additional point data were collected as feed-
back on mental and physical fatigue (reaction times
and NASA-TLX questionnaire) and contextual data
such as temperature and humidity.
2.3 Morepork Concept: Data Errors as
First Class Citizens
The fundamental concept of the Morepork system is
to treat data errors as first class citizens. This means
that instead of considering data errors as the exception
in otherwise well-formed and complete data streams,
data errors are treated as an ordinary part of the ap-
plication data streams. Dealing with errors as ex-
ceptions in the data stream means that typically ef-
forts are made to reduce their impact through pre-
processing (i.e., cleaning), while the data analysis it-
self proceeds without acknowledging errors. In the
case of Morepork, instead of implementing primitive
QoS metrics that capture properties of the input, we
shift to metrics that are relevant for the application
level as part of the data analysis. That is, we present
a generic approach to model the impact of data errors
on application level. We use such models to make
the application-level error explicit as a QoS param-
eter and monitor it at run time. Morepork thus cre-
ates awareness for errors and their magnitude, while
any reduction of errors is subject to the error handling
mechanisms in the application logic.
This paper showcases how these application-
level QoS measures are implemented for IoT stream
queries in Morepork, and uses real-world data from
forestry studies to explore the implications for data
stream analysis. To eliminate communication errors,
the studies described above collected the data at the
point of origin. These data streams can therefore be
used in our work as best case data, without exter-
nal system interference. Interference, e.g., through
poor communication, is understood to cause incom-
plete data streams. In our model, these data errors
are treated as first class citizens and application-level
QoS is used as a quality measure for the analyt-
ics model depending on the current data quality (i.e.
completeness of the data stream).
3 MOREPORK SYSTEM
ARCHITECTURE
In this section we introduce our architectural frame-
work for managing quality of service for the harsh
conditions of a rugged internet of things (RIoT). Fig-
ure 1 provides an overview of the key components
IoTBDS 2019 - 4th International Conference on Internet of Things, Big Data and Security
224
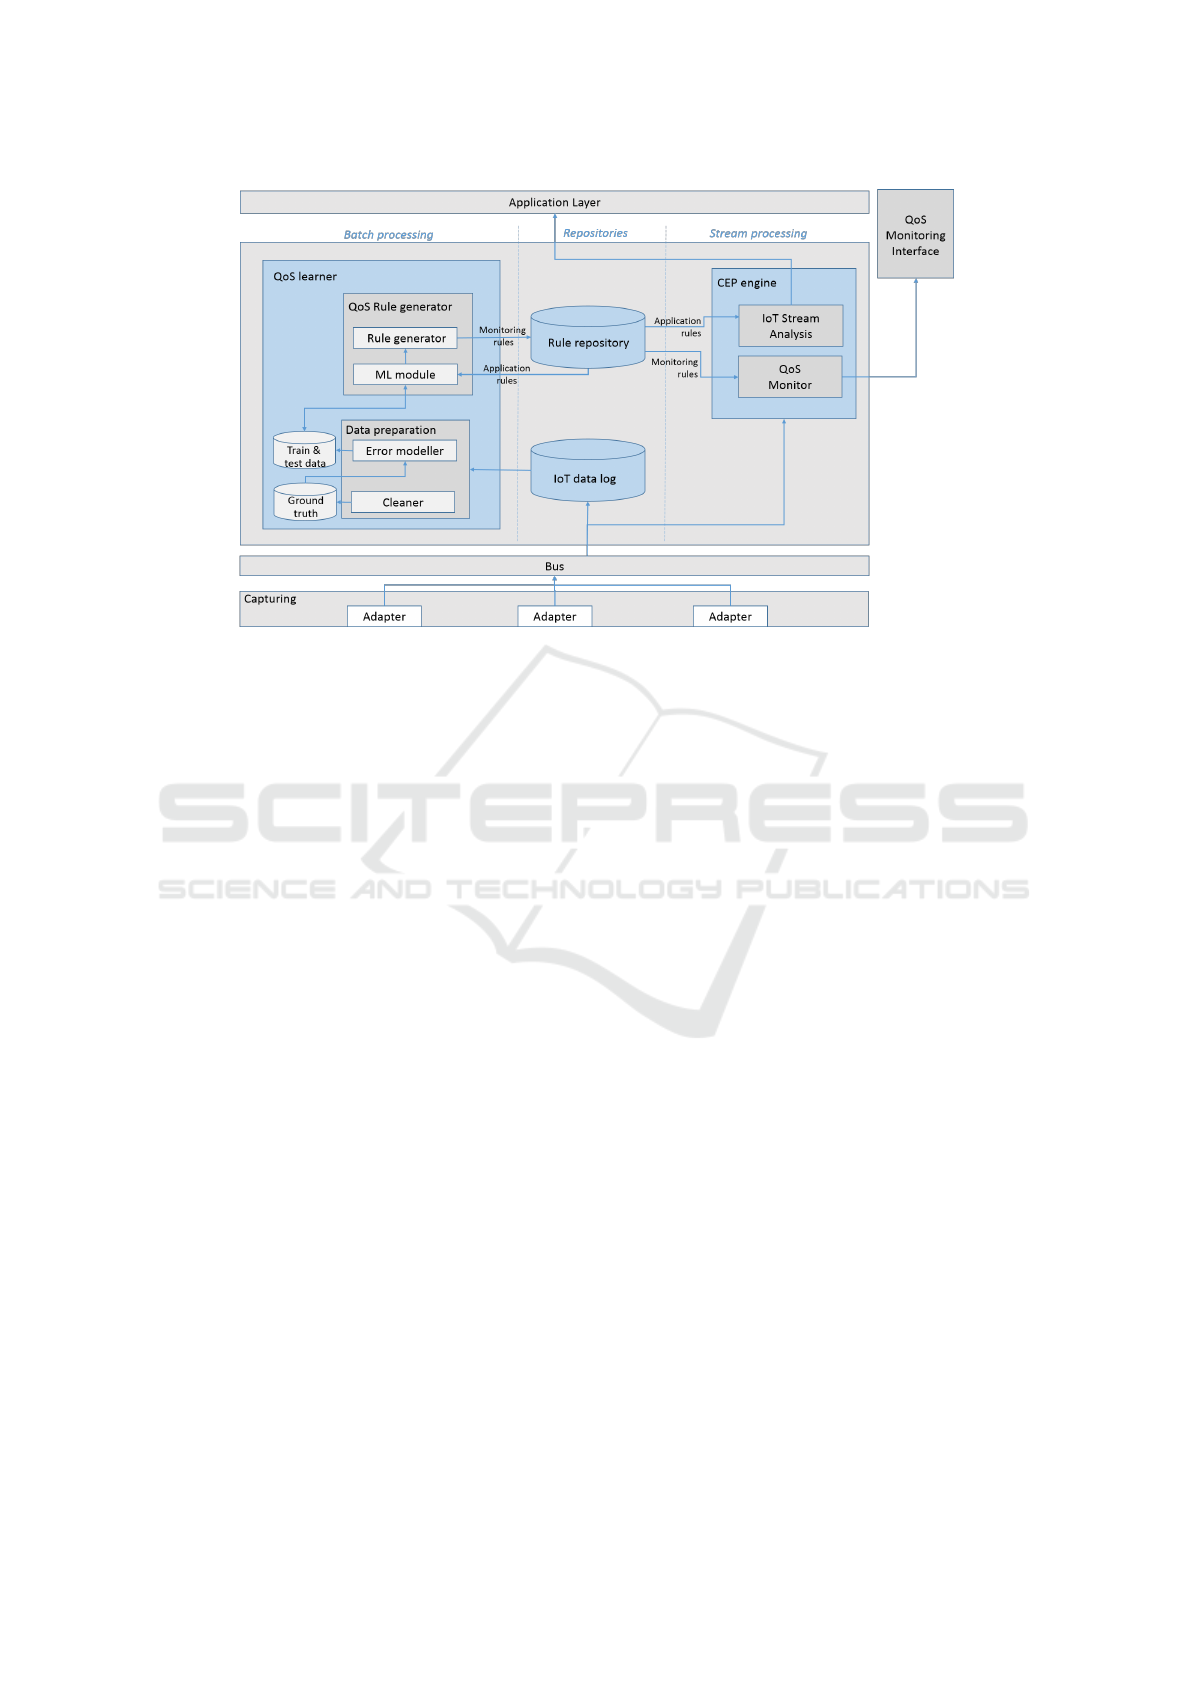
Figure 1: Morepork Architecture and Components.
and their relations. The architecture follows a com-
mon IoT middleware structure, see e.g. (Bandyopad-
hyay et al., 2011). The core of the system is built
on top of a data capturing layer (Fig. 1 bottom) that
acts as adapter to different sensor sources. Sensor
data arrives at the core (Fig. 1 middle) in an event-
based manner via a message bus. The core wraps the
application-specific stream analytics and augments it
with the functionality to continuously monitor the
application-level QoS. The core outputs two main
data streams: (1) the result stream of application-
specific stream analysis, toward the application layer,
and (2) the application-level QoS information, acces-
sible via QoS monitoring interface.
Overall we distinguish three groups of compo-
nents. These are (1) repositories, (2) batch processing
components for QoS learning, and (3) stream process-
ing components for live analysis. We describe these
components in detail throughout the next subsections.
3.1 Storage Components
Morepork includes two types of databases. The first
database is the IoT data log. It stores all incoming
raw data from IoT sensors. Conceptually it is equiv-
alent to the master data set in the lambda architecture
(Marz and Warren, 2015). The second database is the
Rule repository. It holds the processing logic for the
components IoT Stream Analysis and QoS Monitor.
It thereby serves as the basis for rule managers as
discussed in (Cugola and Margara, 2012). Note,
that the specific encoding of these rules depend
on the execution environment (i.e. the specific choice
of CEP engine).
3.2 Batch Processing: QoS Learning
The batch processing components for QoS learning
automatically derive rules for continuously evaluating
the application-level QoS. They comprise two main
components: the QoS Rule Generator and a compo-
nent for Data Preparation. Each of these include two
sub-components.
Data Preparation. The Data preparation compo-
nent takes raw data from the IoT log as input and pro-
duces data that is subsequently used for training and
testing QoS monitoring rules. In a first step, the data
is cleaned such that a data set can be obtained that is
free of errors and can serve as ground truth for fur-
ther processing. A default approach is to only keep
data streams of a defined minimum length and with-
out gaps.
The second step of the data preparation is done by
the Error modeller, generating training and test data
for the subsequent learning of QoS monitoring rules.
The error modeller analyses data in the IoT log to
build a model that describes the occurrence of errors.
An alternative is that domain experts create a model
of what errors to expect. The error modeller then
uses the model on the error-free data streams (ground
truth) to create a copy that contains realistic errors.
The result is a repository of erroneous data streams
where the correct version of the stream is known as
well.
Managing Application-level QoS for IoT Stream Queries in Hazardous Outdoor Environments
225
QoS Rule Generator. The QoS Rule Generator
uses machine learning to create monitoring rules for
continuously predicting the quality of service for
the application specific stream analytics (Application
Rules). It comprises the two sub-components ML
module and Rule Generator.
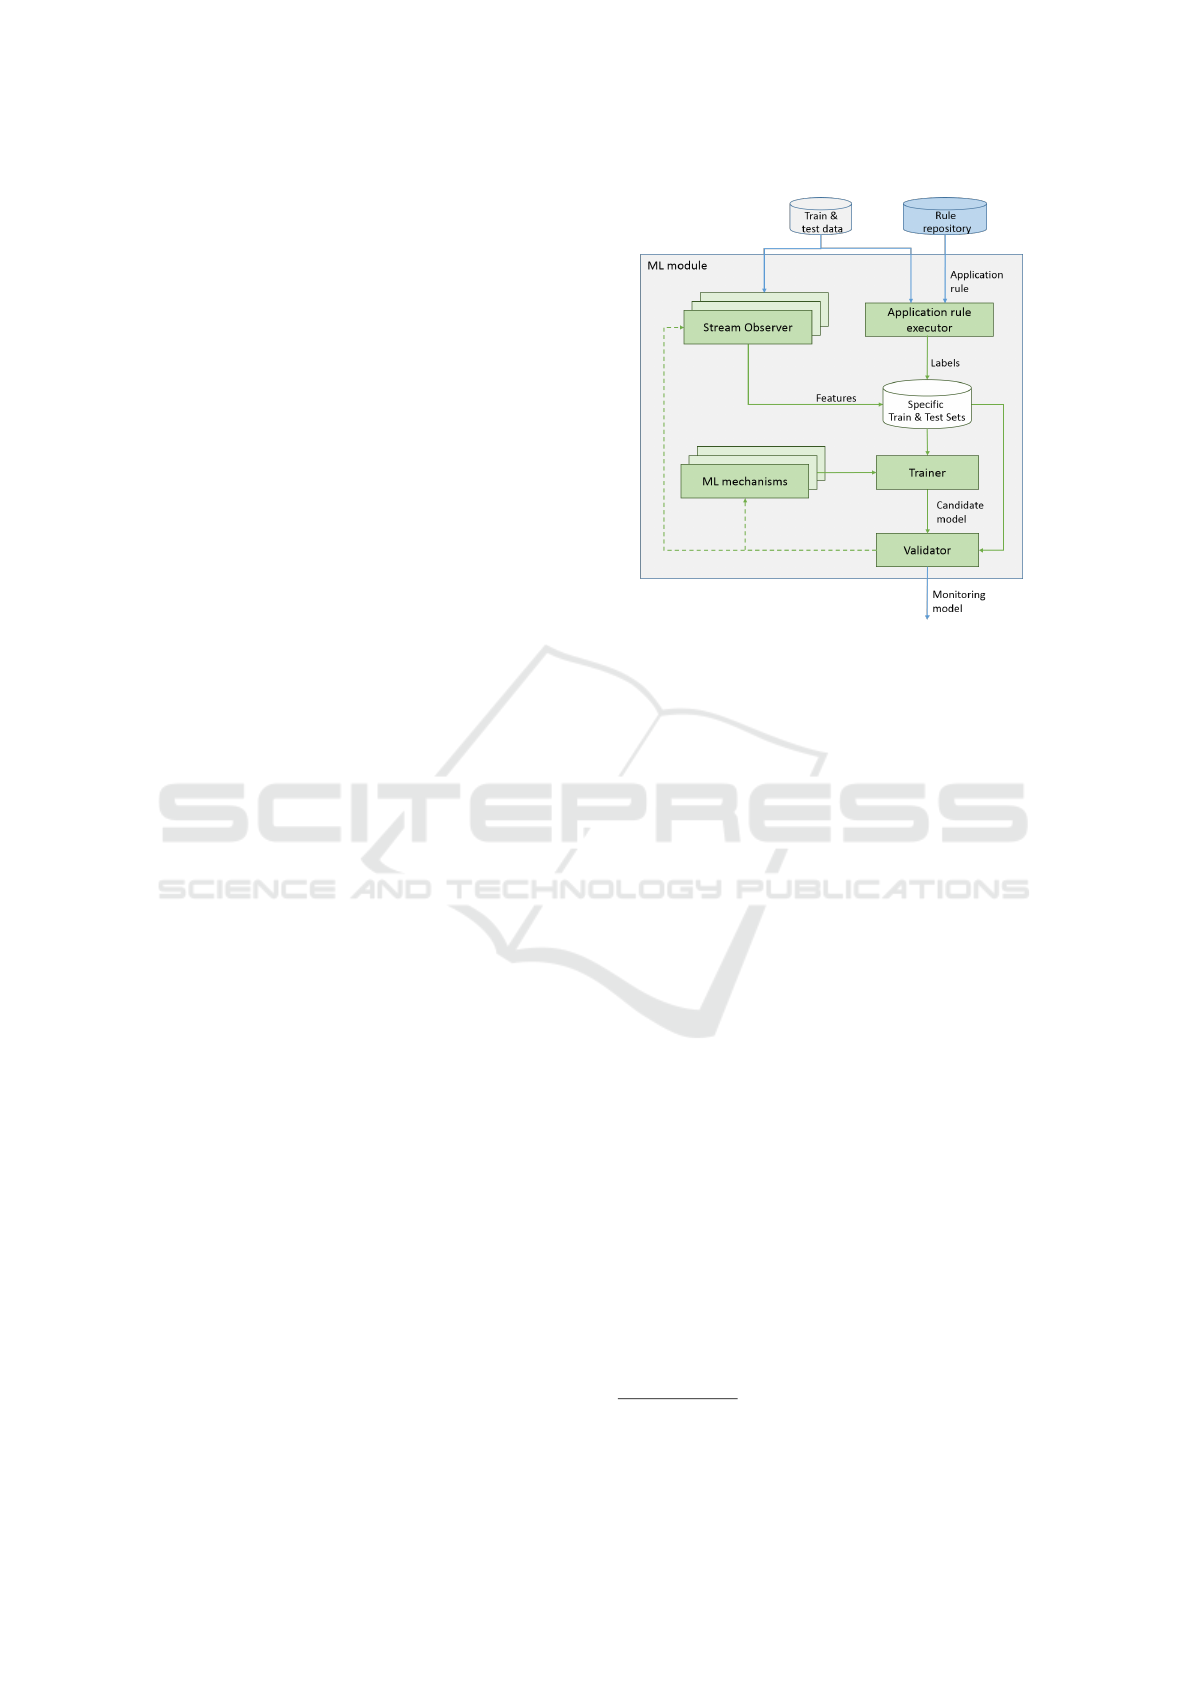
Figure 2 shows details of the operations within the
ML module. The module runs in batch mode to cre-
ate monitoring rules for each application rule in the
rule repository. It first creates training and test sets
for learning the relation between errors in the input
stream and the QoS of each rule. This is done by re-
playing the corresponding stream from the Train &
Test Data Storage to create rule specific test and train-
ing sets. These test and training sets have error char-
acteristics of the input stream as features and corre-
sponding errors of the analytics results (application
rule) as labels. The system can determine the ap-
plication error by leveraging the previously extracted
ground truth (i.e. error free streams) and correspond-
ing streams with introduced errors in the train & test
data storage. Formally, the computation of the error
is
ε(s, s
0
) = err(appRule(s), appRule(s
0
)).
Here err is an error metric (e.g. absolute error) and
appRule is the output of running the application rule
over an error free stream s and a version s
0
of the
stream with introduced errors. The feature set is for-
mally defined as f (S
0
) where f is a function that out-
puts a set of aggregates over S
0
. An example for in-
stantiating f is to compute the percentage of missing
messages and the variance of the data values over a
time window.
With the training set and test set of the structure
h f (S
0
), err(appRule(S), appRule(S
0
))i, the ML mod-
ule builds a prediction model for estimating applica-
tion level QoS. Note that with the given structure, the
prediction model may not only base predictions on
the error characteristics (i.e. missing values) but also
on the currently observable data characteristics. For
instance, it may learn that missing values affect the
error more when the data stream currently shows high
variance than when values are currently stable.
Figure 2 also illustrates how the ML module may
use a multitude of stream observers to create candi-
date feature sets and a multitude of ML mechanisms
to build candidate prediction models.
The subsequent processing step after the ML mod-
ule is the Rule generator. The rule generator takes the
learned models for application level QoS prediction
as input and transforms them into executable rules.
Here we use the term rules to denote a format that is
executable in the CEP engine. Note, that this format
depends on the chosen embodiment of this engine.
Figure 2: Morepork ML module.
For instance, one may chose Esper for the CEP engine
and create the rules in the declarative event process-
ing language EPL
1
. Alternatively, one may wrap the
model in a bolt for executing it in a Storm topology
2
.
3.3 Stream Processing: Real-time Data
Analysis
The stream processing components realise the appli-
cation logic (IoT Stream Analysis) and correspond-
ing QoS monitoring (QoS Monitor) at runtime. That
is, these components continuously run over live in-
put data from IoT devices. Within the Morepork we
propose to use a complex event processing engine
(CEP engine) or stream processing engine as execu-
tion environment for the continuous analysis. These
are dedicated systems that leverage in-memory tech-
nology for efficient event-driven processing. (Cugola
and Margara, 2012). The specific choice of engine
determines how to define the processing logic, i.e. ap-
plication rules and monitoring rules in the rule repos-
itory.
The Morepork rule repository contains monitor-
ing rules monRules for the QoS Monitor and appli-
cation rules for the IoT Stream Analysis over the er-
roneous live data S
0
. Executing a monitoring rule
monRules(S
0
) consists of two main parts. The first
part is to observe the current input stream and to de-
rive the features for QoS prediction in real-time. The
second part is to feed the extracted features in the
1
http://www.espertech.com/
2
http://storm.apache.org
IoTBDS 2019 - 4th International Conference on Internet of Things, Big Data and Security
226

model for QoS prediction and to derive the current
application level QoS. The application rules are of ar-
bitrary structure and we deliberately do not pose any
constraints on them in the Morepork system.
4 PROOF OF CONCEPT
In this section we describe an instantiation of More-
pork components as well as tests of this instantiation
with data from the application domain. We thereby
provide proof of concept as well as an illustrative ex-
ample of how to build an embodiment of the More-
pork concept. First we describe the data and sam-
ple application logic that we use in the tests. Second,
we describe our sample implementation and third, we
discuss the results of our tests.
4.1 Sample Application and Data
For our tests we choose a simple logic for stress and
fatigue monitoring as an example, based on the use
case data collected, see Section 2.1.
We used data measures of heart rate variability
(HRV), taken every minute for each worker, provided
as stream data. The data was collected in the con-
text of the experiments described in (Bowen et al.,
2017b). HRV data are personalised measures that re-
quire baseline determination, with generally higher
HRV indicating greater physical fitness. Complex
HRV signals provide data in high-frequency (HF),
low-frequency (LF), and very low-frequency (VLF)
bands, of which the LF/HF ratio is typically used as an
indicator for occupational stress and fatigue (J
´
arvelin-
Pasanen et al., 2018). Heightened occupational stress
is associated with lowered HRV, specifically with an
increase in LF/HF ratio, with the threshold being de-
pendent on person-related baselines. Specifically, for
our tests we use HRV recordings of one of the study
participants, taken on five consecutive days, focussing
on the LF/HF ratio. The measurements were taken
over 8 hours each day, resulting in 3151 measure-
ments overall.
The sample application logic is to monitor the
sliding average of the LF/HF ratio and to detect if a
threshold is crossed. Crossing a threshold indicates a
high stress level and one may initiate a break or re-
frain from dangerous work in response. For our test
we use a sliding average over 10 values to indicate the
stress level.
However, if measurements get lost in the commu-
nication, the application shows an average value that
differs from the true value. With the Morepork con-
cept, the system can learn to estimate the magnitude
of this error for each data point and make this trans-
parent to the user. It can factor in, for instance, the
number of lost messages and the current context (e.g.
if the LF/HF ratio is rapidly changing or rather con-
stant) to produce an estimate. It is then possible on
application level to factor in the current certainty of
the data, that is, one can make an educated decision if
the displayed stress level is alarming or not, given the
current certainty of the value.
4.2 Proof-of-concept Instantiation
We here describe a proof-of-concept instantiation of
the Morepork concept for the sample application.
We discuss implementation of the components and
dataflow that was described in Section 3.
The starting point for the analysis is the IoT data
log with a history of captured raw measurements (re-
ferred to as S). In our sample, we base this log on
the five days recording of LF/HF data. For simplic-
ity we concatenate the values of the five days into one
continuous value stream.
3
4.2.1 Data Preparation
The first step in the processing pipeline is data prepa-
ration, to create ground truth as well as the training
and testing data. For the ground truth we need to ex-
tract undistorted parts of the IoT data log.
In our sample application we obtained that data
from an experiment that recorded locally and with-
out distributed transmission. Hence we are in a spe-
cial situation where we get training data that is free of
communication errors and can omit the cleaning step.
The second step is modelling the communication
errors that we expect in the application setup in the
wild, where measurements are transmitted via wire-
less communication from remote locations and one
must expect gaps in the stream. In the Morepork
framework this is the responsibility of the error mod-
eller. For our test we choose a simple error model
that drops messages with a probability of 50%. The
error modeller stores the undistorted data S as well as
a version with gaps in the repository for test and train-
ing data (named S
0
). We then continue the processing
with half of the values (S
train
and S
0
train
) and set aside
the rest to later use in simulation test (S
sim
and S
0
sim
).
3
This means that at the beginning of a new day, some
data from the previous evening is part of the data window.
However, the very first values of each day typically carry
distortions because of how the sensors are mounted, and
any effects of the data concatenation are minimal.
Managing Application-level QoS for IoT Stream Queries in Hazardous Outdoor Environments
227
4.2.2 QoS Rule Generator
The next component in the processing pipeline is the
QoS Rule Generator with the ML module.
Specific test and training sets are created using the
(a) addressed application logic from the rule repos-
itory and (b) data from the repository for test and
training data. That is, the ML module creates fea-
tures and labels for the subsequent model training. In
our sample application, we compute a rolling average
avg(t, S
train
, n) over a data window of size n from data
stream S
train
for each time slice t. Hence, our objec-
tive is to learn a model that predicts the application
level error, given data losses.
We compute the corresponding label by running
the application log (sliding average) over the undis-
torted data (ground truth) S
train
as well as over
the copy S
0
train
with introduced communication er-
rors. Both data sets are outputs of the preced-
ing Data preparation component. The absolute
value of the difference between the two computations
|avg(t, S
train
, n)− avg(t, S
0
train
, n)| is the label for each
time slice t in our specific test and training set.
Similarly, we compute the features as function
f (t, S
0
train
, n) over a data window of size n from data
stream S
0
train
for each time slice t. Again S
0
train
is the
copy of the ground truth with induced errors. In our
sample implementation, we use two features: One
is the number of data gaps in the current data win-
dow. This captures the current data quality. The
other feature is the variance over the window. This
feature captures the current context with regards to
how stable/unstable the measurements are. (Note that
the variance serves as example for context data in our
proof-of-concept implementation and additional con-
text information–such as time of the day–may be in-
cluded as well). With this limited set of features and
for the sake of simplicity in this example, we omit a
search through the feature space and decide on only
one candidate model type (i.e. decision tree).
Subsequent to the creation of the specific training
and testing sets, the model building is performed. In
our implementation, we train a model that predicts the
application level error distribution for each data point.
For this we use a regression tree from the R pack-
age party (http://party.r-forge.r-project.org), which is
based on the algorithm described in (Hothorn et al.,
2006). The resulting tree predicts the expected er-
ror and not an error distribution. However, it asso-
ciates each leaf node of the tree with the correspond-
ing training samples. For each node we use these
training samples to fit a Gaussian distribution of the
error size in each node.
The Morepork concept uses a Rule Generator to
transform the model into a form that can run over a
Figure 3: Data on application level.
data stream. However, in our Proof of Concept imple-
mentation, we simulate a live data stream by iterating
through a pre-recorded log and therefore proceed di-
rectly with the R code instead of CEP rules.
4.2.3 CEP Engine
The components for IoT stream analysis and QoS
Monitor run in parallel in the CEP engine. In our
instantiation, we simulate the IoT stream analysis
through the replay of S
0
sim
to generate the application
level output. For the evaluation we additionally run
the application logic over a replay of S
sim
to obtain
the application level ground truth.
The QoS Monitor provides continuous feedback
about the application level quality of service in terms
of the accuracy of the query results. In our sample
application we realize this through providing a con-
fidence interval around the query results. We obtain
this interval though applying the previously learned
tree for error prediction on the current data window
and looking up the leaf-specific error distribution. We
then tested the QoS monitor through a replay of the
set-aside data S
0
sim
and comparison with a replay of
S
sim
. Thereby we can observe the effects of having
a dynamic (i.e. context dependent) confidence inter-
val and can test if the predicted interval is valid. The
subsequent section shows the results.
4.3 Experimental Results
The aim of the experiments with the proof-of-concept
implementation is to test the viability of the Morepork
approach. Specifically, we aim to validate the appli-
cability on real data and to analyze how the More-
pork concepts play out in a sample scenario. We
tested the implementation with the above described
measurements of LF/HF ratio and an assumed loss of
50% of the values. The application-level QoS metric
is here defined as the absolute difference between the
computed sliding average in the LF/HF ratio measure-
ments with complete data (ground truth) and incom-
plete measurements (application output with errors).
IoTBDS 2019 - 4th International Conference on Internet of Things, Big Data and Security
228
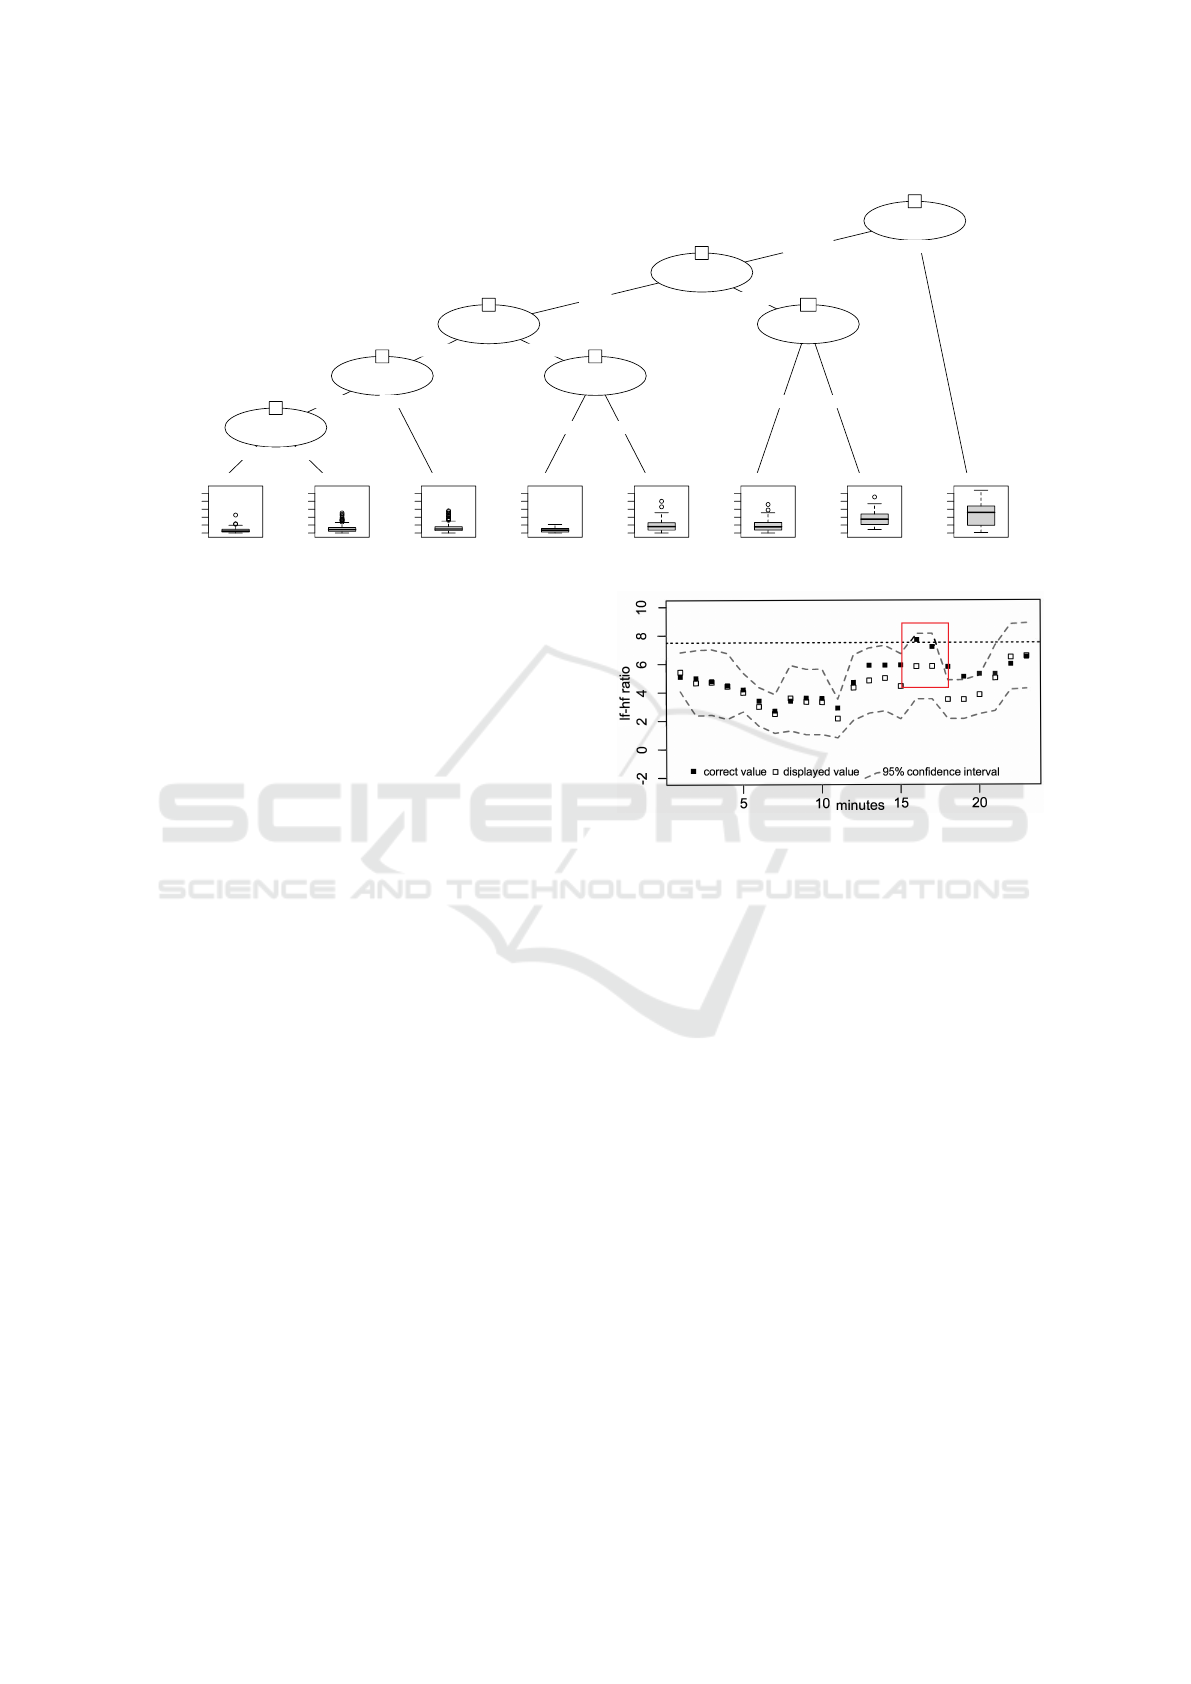
variance
1
£ 55.467 > 55.467
gap_percentage
2
£ 0.5 > 0.5
variance
3
£ 12.268 > 12.268
gap_percentage
4
£ 0.4 > 0.4
variance
5
£ 2.619 > 2.619
Node 6 (n = 133)
0
1
2
3
4
5
Node 7 (n = 185)
0
1
2
3
4
5
Node 8 (n = 152)
0
1
2
3
4
5
gap_percentage
9
£ 0.2 > 0.2
Node 10 (n = 22)
0
1
2
3
4
5
Node 11 (n = 141)
0
1
2
3
4
5
variance
12
£ 17 > 17
Node 13 (n = 136)
0
1
2
3
4
5
Node 14 (n = 15)
0
1
2
3
4
5
Node 15 (n = 32)
0
1
2
3
4
5
Figure 4: Learned model.
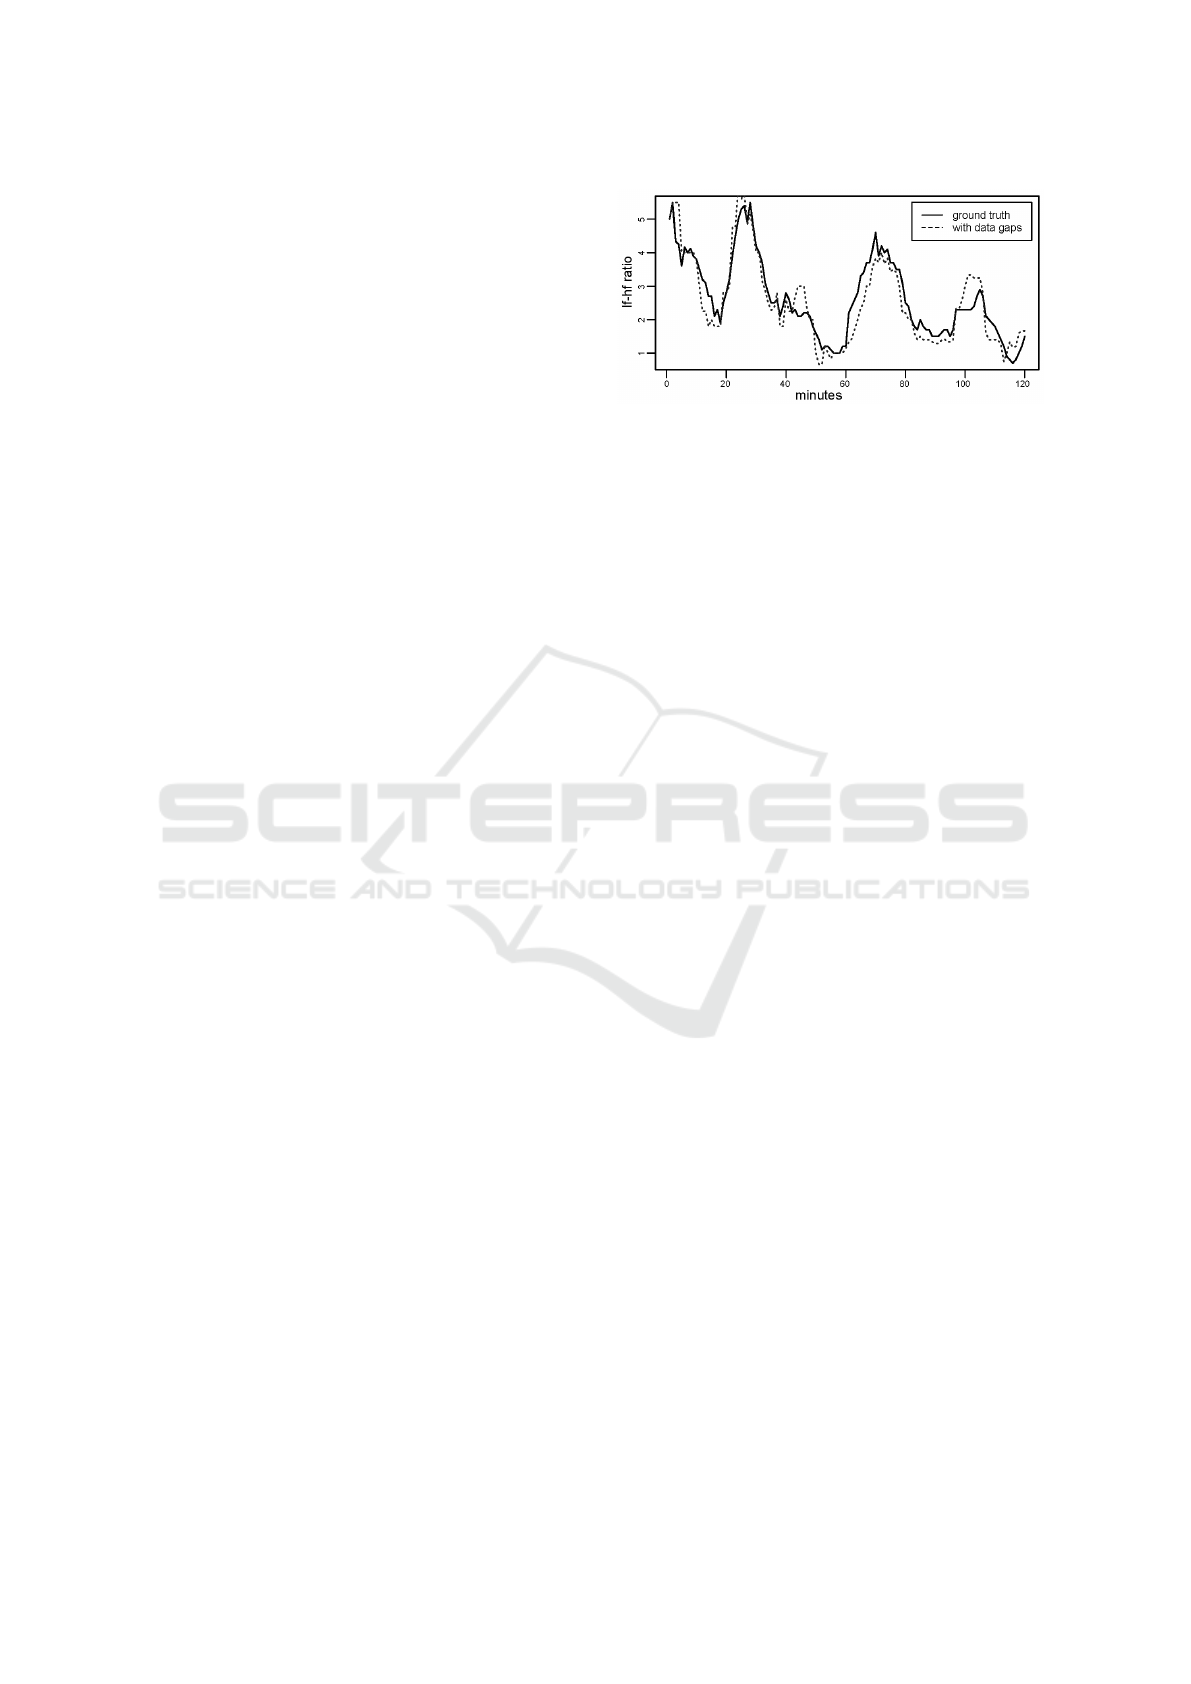
Figure 3 displays a snap shot of the application level
data (i.e. smoothed LF/HF ratio). It shows at appli-
cation level the difference between the ground truth –
without communication errors – and the results based
on an input stream with gaps. The QoS monitor in
Morepork dynamically quantifies the expected mag-
nitude of the errors for each data point through a con-
fidence interval.
In our experiments we used both S
train
and S
0
train
for training a regression tree that predicts the error.
Figure 4 shows the resulting tree. According to the
model structure, the application error depends on the
current data quality (gap_percentage) as well as on
the current data context (variance). This manifests
in the corresponding model nodes. The statistics for
the leaf nodes show clearly distinctive distributions
for the application level errors dependent on the cur-
rent gap_percentage and variance. This suggests
the feasibility of providing a confidence interval for
each data value.
We set aside the second half of the 3151 LF/HF
ratio measurements (S
sim
and S
0
sim
) for testing the ap-
plicability of an adaptive confidence interval in the
QoS Monitor. Figure 5 shows a snapshot of the re-
sults. The figure depicts the application-level data
(sliding average of the LF/HF ratio) with data gaps
(white squares) and without data gaps (black squares)
in the input data. We selected here a situation that il-
lustrates the crossing of a threshold (which is marked
by a horizontal line). The QoS monitor adds for each
data point a 95% confidence interval that quantifies
the expected application level data quality. The con-
fidence interval is inferred individually for each point
based on our learned model, depending on the gaps
and variance in the respective data window. The snap-
shot shows how the confidence interval changes over
time and adapts for each value.
Figure 5: Data with confidence level in QoS monitor.
We highlighted a potential area of interest in
which the (erroneous) application data appear to be
well away from the threshold, however, the wide con-
fidence interval reaches beyond the threshold and in-
dicates that another level of fatigue may have been
reached. Inspecting the real data value shows that this
has indeed been the case.
Overall we found that 92% of the data were within
the 95% confidence interval. 87% of the data were in
a 90% confidence interval and 79% in an 80% confi-
dence interval. These observations with the proof-of-
concept implementation confirm the applicability of
the Morepork concepts on real data.
5 RELATED WORK
The closest related work to Morepork are IoT middle-
ware and complex event processing (CEP) systems.
Such systems have been proposed for a range of ap-
plication domains (e.g., (Merlino et al., 2014; Stro-
hbach et al., 2015; T
¨
onjes et al., 2014; Adeleke et al.,
2017)). These works are related in the sense that they
present architectures and system for handling IoT data
streams. However, such systems have little or no ex-
Managing Application-level QoS for IoT Stream Queries in Hazardous Outdoor Environments
229

plicit support to deal with quality of service in the
presence of errors. A common approach is to address
errors in a best effort manner in a cleaning step. Of-
ten, it is left to the application developers to deal with
the errors. In contrast, Morepork treats errors as first
class citizens and offers dedicated support for estimat-
ing their impact on application level. A CEP system
that addresses QoS is Aurora (Abadi et al., 2003). It
adapts processing under consideration of QoS param-
eters. It considers response time, tuple drops and pro-
duced values as QoS parameters. Unlike Morepork, it
offers no support to estimate and monitor the QoS on
application level.
Another example of related work is the MILTON
measure for event detection (Efros et al., 2017). The
MILTON measure aims to quantify the effect of lossy
transformation on event detection processes. The gen-
eral concept of MILTON is similar to our approach of
quantifying the effect of errors on application level
QoS; our work draws on the principles behind the
MILTON measure. However, MILTON does not ex-
plicitly consider communication errors and provides
no architecture for dealing with QoS in an IoT sys-
tem. In that sense it is only loosely related to our
work. Similar, the machine learning approaches sug-
gested by (Shrestha and Solomatine, 2006) are related
to parts of the Morepork system. Specifically, our ap-
proach in training a model for estimating the error of
another model is inspired by the work of Shrestha et
al. However, these works only address a small part of
the Morepork concept and do not aim at providing a
system of similar scope.
6 CONCLUSION
This paper introduced the Morepork system for man-
aging application-level Quality of Service in stream
queries for rugged IoT environments. To the best of
our knowledge the system is unique in its approach
for treating errors as first class citizens and provid-
ing a generic solution for making application-level
QoS explicit in an IoT system. Morepork thus ac-
knowledges the error-prone nature of data streams
from real-world IoT applications in rugged outdoor
environments. It provides a system for generic sup-
port of IoT applications with application-level QoS.
In Morepork, machine learning components are used
as wrappers around the application-specific data an-
alytics logic. To explore the Morepork concept for
a real-world setting, we used data from the Hakituri
project in a Proof of Concept implementation.
ACKNOWLEDGEMENTS
We acknowledge the work of Chris Griffiths in col-
lecting the forestry data, and the support of the
forestry contracting companies and workers.
REFERENCES
Abadi, D. J., Carney, D., C¸ etintemel, U., Cherniack, M.,
Convey, C., Lee, S., Stonebraker, M., Tatbul, N., and
Zdonik, S. (2003). Aurora: A new model and architec-
ture for data stream management. The VLDB Journal,
12(2):120–139.
Adams, G., Armstrong, H., and Cosman, M. (2014). Inde-
pendent forestry safety review – an agenda for change
in the forestry industry. report published by the NZ
Ministry for Business and Innovation, Wellington.
Adeleke, J. A., Moodley, D., Rens, G., and Adewumi, A. O.
(2017). Integrating statistical machine learning in a se-
mantic sensor web for proactive monitoring and con-
trol. Sensors, 17(4):807.
Bandyopadhyay, S., Sengupta, M., Maiti, S., and Dutta, S.
(2011). Role of middleware for internet of things: A
study. International Journal of Computer Science and
Engineering Survey, 2(3):94–105.
Bowen, J., Hinze, A., and Griffiths, C. (2017a). Investigat-
ing real-time monitoring of fatigue indicators of new
zealand forestry workers. Accident Analysis and Pre-
vention. in press.
Bowen, J., Hinze, A., Griffiths, C., Kumar, V., and Bain-
bridge, D. (2017b). Personal data collection in the
workplace: Ethical and technical challenges. In
British Computer Society Human Computer Interac-
tion Conference, pages 57:1–57:11.
Cugola, G. and Margara, A. (2012). Processing flows of
information: From data stream to complex event pro-
cessing. ACM Computing Surveys (CSUR), 44(3):15.
Efros, P., Buchmann, E., Englhardt, A., and B
¨
ohm, K.
(2017). How to quantify the impact of lossy trans-
formations on event detection. Big Data Research,
9:84–97.
Hockey, R. (2013). The Psychology of Fatigue, Work, Effort
and Control. University of Sheffield.
Hothorn, T., Hornik, K., and Zeileis, A. (2006). Unbiased
recursive partitioning: A conditional inference frame-
work. Journal of Computational and Graphical statis-
tics, 15(3):651–674.
J
´
arvelin-Pasanen, S., Sinikallio, S., and Tarvainen, M.
(2018). Heart rate variability and occupational stress-
systematic review. Industrial Health.
Marz, N. and Warren, J. (2015). Big Data: Principles and
best practices of scalable real-time data systems. New
York; Manning Publications Co.
Merlino, G., Bruneo, D., Distefano, S., Longo, F., and Pu-
liafito, A. (2014). Stack4things: integrating iot with
openstack in a smart city context. In Smart Comput-
ing Workshops, pages 21–28.
IoTBDS 2019 - 4th International Conference on Internet of Things, Big Data and Security
230

Shrestha, D. L. and Solomatine, D. P. (2006). Ma-
chine learning approaches for estimation of predic-
tion interval for the model output. Neural Networks,
19(2):225–235.
Strohbach, M., Ziekow, H., Gazis, V., and Akiva, N. (2015).
Towards a big data analytics framework for iot and
smart city applications. In Modeling and processing
for next-generation big-data technologies, pages 257–
282. Springer.
T
¨
onjes, R., Barnaghi, P., Ali, M., et al. (2014). Real time
iot stream processing and large-scale data analytics for
smart city applications. In European Conference on
Networks and Communications.
Managing Application-level QoS for IoT Stream Queries in Hazardous Outdoor Environments
231
