
Adversarial Media-fusion Approach to Strain Prediction for Bridges
Takaya Kawakatsu
1
, Kenro Aihara
2
, Atsuhiro Takasu
2
and Jun Adachi
2
1
The University of Tokyo, 2-1-2 Hitotsubashi, Chiyoda, Tokyo, Japan
2
National Institute of Informatics, 2-1-2 Hitotsubashi, Chiyoda, Tokyo, Japan
Keywords:
Generative Adversarial Network (GAN), Civil Engineering, Structural Health Monitoring, Multimodal.
Abstract:
This paper contributes to the wide acceptance of autonomous health monitoring for real bridges. Our approach
involves dynamic simulation, whereby damage may be identified by detecting abnormal mechanical behavior
in the bridge components in response to passing vehicles. Conventionally, dynamic simulation requires expert
knowledge of mechanics, components, materials, and structures, in addition to accurate modeling. Moreover,
it requires detailed specification of the external forces applied, such as vehicle speeds, loci, and axle weights.
This paper introduces a novel media-fusion framework to obtain a bridge dynamic model in a fully data-driven
fashion. The proposed generative model also successfully simulated strain responses for a real road bridge by
using a camera and strain sensors on the bridge. The generative network was trained by an adversarial learning
algorithm customized for media-fusion analysis.
1 INTRODUCTION
With the widespread adoption of compact devices and
drones, attention is being directed toward a fully au-
tomated approach to monitor the health of bridges us-
ing sensor fusion involving heterogeneous sensors in-
stalled on the target bridge. Our main interest in this
paper is the detection of fatal faults that may cause a
bridge to collapse, such as fractures and the corrosion
of reinforcing rods, girders, and decks. Unfortunately,
the mechanisms for damage progression on individual
real bridges are yet to be fully clarified. Furthermore,
there has been no open collection of ground-truth data
for damage identification, which would be helpful for
approaches involving data mining.
Studies of damage detection based on mechanics
can be classified according to two major approaches.
The first uses long-term behavior of the bridge, such
as natural vibration (Bicanic and Chen, 1997), which
does not depend strongly on individual vehicles. The
second uses transient state analysis, which identifies
an abnormal movement by the bridge components
in response to every passing vehicle (Huang et al.,
2016). Compared with the first approach, the second
may provide rich information sampled under a variety
of traffic conditions. To detect anomalous mechanical
responses, the dynamic system of the bridge must be
modeled in advance. One powerful solution is to use
finite element analysis (FEA) (Wu et al., 2017; Shah
et al., 2018). However, FEA requires accurate model
making by hand, which is not feasible for the majority
of existing bridges.
Our solution is to use a generative neural network
that predicts the transient responses for every passing
vehicle, which must be observed by sensors installed
upon the bridge components. The generative network
involves two networks, namely encoder and decoder.
The encoder network collects vehicle properties in a
media-fusion fashion that combines a video network
and a sensor data network. The video is recorded by
a surveillance camera above the bridge entrance and
contains rich information about every passing vehicle,
including speed, locus (left/right position in the lane),
and axle positions. The sensor data are recorded by a
strain sensor underneath the bridge deck and contain
information about axle weights. The decoder network
generates the dynamic response caused by the vehicle,
by taking the output of the encoder as its input. That
is, our neural network takes the raw sensor-data signal
as input and outputs a decoded sensor signal, thereby
modeling the transfer function between the sensors.
To realize realistic predictions, we have improved
the generative adversarial networks (GANs) (Radford
et al., 2016; Goodfellow et al., 2014). In addition, we
implemented generative networks which were trained
just by minimizing mean squared errors (MSEs). The
results in Section 4 demonstrate the effectiveness of
our approach to modeling bridge dynamics.
736
Kawakatsu, T., Aihara, K., Takasu, A. and Adachi, J.
Adversarial Media-fusion Approach to Strain Prediction for Bridges.
DOI: 10.5220/0007555007360743
In Proceedings of the 8th International Conference on Pattern Recognition Applications and Methods (ICPRAM 2019), pages 736-743
ISBN: 978-989-758-351-3
Copyright
c
2019 by SCITEPRESS – Science and Technology Publications, Lda. All rights reserved

2 RELATED WORK
It is usual for a road bridge to bend and distort as a
vehicle passes over the bridge. If we assume that all
of a vehicle’s properties could be obtained in advance,
the bridge structural response including normal strain,
shear strain and displacement would be predictable by
using a bridge model. Existing modeling techniques
can be classified according to two major approaches,
namely explicit modeling and implicit modeling. The
explicit approaches use FEA (Mohamed et al., 2017;
Mohamed and Tahar, 2017), where bridge models are
typically created manually and optimized by iterative
model updates using a test vehicle (Wu et al., 2017).
By comparing uninjured and damaged models (Shah
et al., 2018), the damage can be localized.
On the other hand, the implicit approach abandons
explicit construction of bridge structural models, not
least because accurate FEA modeling is costly. In this
approach, there are two main methods for anomalous
behavior detection. The first method is based on using
model parameters that dominate the bridge dynamics,
such as natural frequencies (Bicanic and Chen, 1997),
damping ratios (Cao et al., 2017), and stress influence
lines (Chen et al., 2014). The second method is based
on physical observation where the anomaly is defined
as a dissociation between sensor data and predictions.
The predicted data can be static (Liu and Wang, 2010;
Ma and Bi, 2011) or dynamic (Zhang et al., 2018).
Traditionally, the transient signals were explained
by using Kalman filtering (Bing et al., 2011; Xiao and
Fang, 2016; Quansheng et al., 2010; Palanisamy and
Sim, 2015) for the case of quasistatic linear responses.
In a recent approach, Neves et al. (Neves et al., 2017;
Neves et al., 2018) modeled bridge vibration signals
by using a neural network that took previous 5-gram
acceleration samples, axle loads, and axle positions as
its input.
Aspects of bridge dynamics such as normal strain
and displacement can be estimated by introducing the
concept of an influence line (Chen et al., 2014; Huang
et al., 2016). The strain response by components, e.g.,
flanges, girders, and deck slabs, may be explained by
a linear response model where the strain measurement
s(t) at time t is proportional to the product of axle load
w(x, t) and the value of the influence line i(x) at axle
point x:
s(t) ≈ ˆs(t) =
Z
l
0
w(x, t)i(x)dx, (1)
where l is the bridge length. The function i(x) denotes
a proportionalityfactor for w(x, t), which is specific to
each bridge.
To predict the dynamic responses or to extract the
influence line from sensor data, the vehicle properties,
including speed, loci, axle positions, and weights, are
needed. Zaurin and Catbas (Zaurin and Catbas, 2011)
also investigated the collection of vehicle properties
via video surveillance. A problem with their approach
was that the targets were limited to test vehicles with
known axle loads. The most obvious approach to axle
weighing is to use an axle-load meter. However, it is
hard to retrofit an axle-load meter to existing bridges
because this meter needs paving work for installation.
Moreover, an axle-load meter is fragile and requires
frequent repair. Additionally, accurate axle weighing
may impose severe limits on vehicle traveling speed.
An alternative solution uses a bridge weigh-in-motion
(BWIM) (Lydon et al., 2015; Yu et al., 2016) system
that estimates axle weights by Eq. (1), but if the bridge
becomes damaged, the influence line may change and
lead to inaccurate axle-load estimates. The influence
line may also change its shape if the running position
in the lane changes. Accordingly, we must develop a
complex model to handle the large number and wide
variety of patterns of strain responses collected by test
runs in advance.
In a previous paper (Kawakatsu et al., 2018a), we
abandoned the collection of axle weights. Instead, we
proposed an anomaly-detection method based on the
assumption that vehicle appearances and bridge strain
responses may share common features for the passing
vehicles. As we have previously reported (Kawakatsu
et al., 2018b; Kawakatsu et al., 2019), the strain data
themselves contain rich information about the passing
vehicles. By using two convolutional neural networks
(CNNs) for video and strain signals and by comparing
the video and sensor data in a common feature space,
we could successfully identify anomalous responses.
The main problem in this work is the interpretation of
anomalous scores that are not directly associated with
physical abnormalities.
3 MEDIA-FUSION GAN
Fig. 1 illustrates the architecture of the generative net-
work. The network comprises two subnets, namely
the encoder and the decoder. The encoder extracts the
features of each vehicle, and the decoder predicts the
strain signal. Both subnets involve many preactivated
residual blocks (He et al., 2016). Note that we applied
an additional activation function to the output of each
block in addition to the two activation functions inside
the block. In this paper, we used leaky ReLU (Maas,
2013) for all activation functions except for those in
the output layers.
The encoder network shown in Fig. 1(a) is derived
from the SpiNet (Kawakatsu et al., 2018a). To obtain
Adversarial Media-fusion Approach to Strain Prediction for Bridges
737
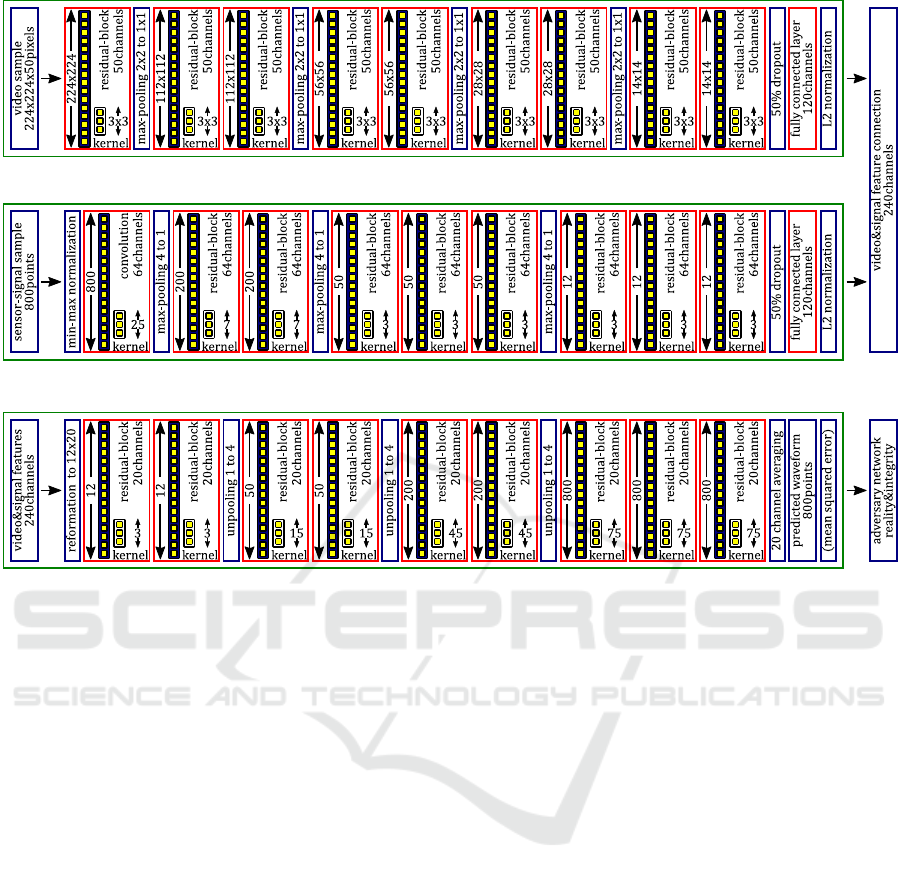
(a) Encoder network.
(b) Decoder network.
Figure 1: Media-fusion generator network architecture.
accurate predictions, the parameters of the unknown
target vehicle need to be acquired by using sensors on
the target bridge. As described in Eq. (1), the required
parameters include traveling speed, locus, axle loads,
and axle positions. These parameters are obtained by
the multimodal encoder, which combines two CNNs
for video and strain signals.
First, the video CNN receives 50 grayscale video
frames (taken over two seconds) recorded from when
the passing vehicle enters the camera’s field of view.
Each frame is resized to 224×224 pixels in advance.
Next, the strain CNN receives four-second batches
of raw strain signals sampled at 200 Hz. We fed raw
signal sequence directly to the CNN, following Dai et
al. (Dai et al., 2017). Each sequence starts (or ends)
at the same time as the vehicle enters (LtoR) or leaves
(RtoL) the bridge. Then, each sample is scaled so that
its maximum and minimum values are normalized to
1 and 0, respectively, to enable effective learning.
Finally, the multimodal encoder outputs a feature
vector of 240 channels by combining video and signal
features of the target vehicle. To suppress overfitting,
we inserted a 50% dropout between the last residual
block and the following linear layer in each network.
In addition, we again normalized the video and signal
features individually to enable effective learning.
The decoder network shown in Fig. 1(b) receives
the feature vector for each target vehicle and predicts
a target waveform of 800 signal points (four seconds),
which is rescaled in the same way as the source signal.
The decoder was designed as a deep residual network,
which upsamples the feature vector by three times to
obtain target signals at 200 Hz. The upsampling was
performed just by copying each element in the source
vector into four neighboring signal points in the target
vector. A generous kernel width for each convolution
layer was set, similar to WaveGAN (Donahue et al.,
2018), to enable the layer to handle the low-frequency
signals seen in Fig. 4. The target signal was obtained
by averaging 20 channels of the feature vector into a
single channel in the final layer.
The generator network was trained introducing the
GAN (Goodfellow et al., 2014; Radford et al., 2016)
approach. Typically, an adversary network examines
whether the generated fake data are as realistic as the
observed data (Goodfellow et al., 2014). In addition,
our adversary network examines the integrity between
the source signal and prediction, which should be high
because they were both caused by the same vehicle.
Therefore, our adversary takes a pair comprising
two signal sequences from the source sensor signal y
and target sensor signal z (or prediction ˆz), similar to
ICPRAM 2019 - 8th International Conference on Pattern Recognition Applications and Methods
738

Figure 2: Media-fusion adversary network architecture.
Table 1: Classification problem for the adversary.
Real z Fake ˆz
Consistent {y
n
, z
n
} {y
n
, ˆz
n
∼ G(x
n
, y
n
)}
Inconsistent {y
′
n
, z
n
} {y
′
n
, ˆz
n
∼ G(x
n
, y
n
)}
pix2pix (Isola et al., 2017), and classifies the pair into
four classes, as shown in Table 1. These four types of
pairs are created uniformly for each n-th observation
sample {x
n
, y
n
, z
n
} by the sampling function s
k
:
s
1
(n) = {y
n
, z
n
}, (2)
s
2
(n) = {y
′
n
, z
n
}, (3)
s
3
(n) = {y
n
, G(x
n
, y
n
)}, (4)
s
4
(n) = {y
′
n
, G(x
n
, y
n
)}. (5)
y
′
n
was selected from the samples other than y
n
in the
mini batch in each training iteration. Accordingly, 4N
pairs were fed to the adversary for N samples during
the training.
Fig. 2 illustrates the architecture of the adversary
network. We modified the Model 1 CNN proposed in
a previous paper (Kawakatsu et al., 2019) to take the
source sensor signal y and target signal z as the input.
The adversary is shallower than the generator, which
may suppress overfitting. The target signal input may
comprise real or fake strain sequences, while the other
input is always real but is sometimes inconsistent with
the target signal. The loss function for the adversary
D is defined as the cross entropy for the four classes:
L
D
=
1
N
N
∑
n=1
1
4
4
∑
k=1
logD(kks
k
(n)), (6)
where D takes a pair created by s
k
selected uniformly
as input and predicts the probability that the input pair
is classified to the k-th class in Table 1.
The generator G was trained so that the prediction
ˆz looks real and consistent with the observation y. To
stabilize the GAN optimization process, we added an
auxiliary MSE element to the cross entropy, following
Yang et al. (Yang et al., 2017) to obtain Eq. (7).
L
G
=
1
N
N
∑
n=1
logD(1ks
3
(n)) + λk ˆz − zk
2
, (7)
where λ was set to 1. Both networks were trained in
a mini-batch fashion that the losses L
G
and L
D
were
minimized. In each training iteration, G was updated
first and then D was updated.
It should be noted that our generator did not take
a random noise variable as input, unlike the previous
GAN studies (Goodfellow et al., 2014; Radford et al.,
2016), because we required deterministic models and
the contribution of the random input was not obvious
in our study. In future work, we may explore a method
for handling non-deterministic behavior of the bridge
by exploiting random variables in future work.
4 EXPERIMENTAL RESULTS
Section 4 demonstrates our generative network for the
case of a 300-m prestressed concrete (PC) bridge in
Japan, denoted Bridge C, which has two lanes and
four spans. We deployed a traffic surveillance camera
at the bridge entrance to capture images of vehicles in
close proximity to the vehicles. We also installed four
strain sensors beneath the bridge deck to collect strain
signals in the direction orthogonal to the bridge axis.
These sensors are shown as four red triangles denoted
as S1P4, S2P4, S3P4, and S4P4 in Fig. 3. The strain
sensor model was PKM-50S, manufactured by Tokyo
Measuring Instruments Laboratory, Co. Ltd. We also
installed an accelerometer at the center of the leftmost
span, as shown by the yellow triangle denoted A3ZP8
in Fig. 3. All of the sensors were synchronized except
for the camera, and their sampling rate was 200 Hz.
The frame rate of the camera was then set to 25 frames
per second.
Fig. 4 show two examples of the observed signals
after a large vehicle entered Bridge C from left to right
(LtoR) and from right to left (RtoL). The signal peaks
indicate the times when a wheel axle passed over the
sensor. As investigated previously (Kawakatsu et al.,
2018b; Kawakatsu et al., 2019), the response signals
contain various information about the vehicles, which
may include speed, loci, and axle numbers, although
the accuracy may be lower than that derived from the
video. However, axle weights may be better obtained
from strain data than from video data.
In preparation for the experiments, we needed to
collect times when vehicles entered or left the bridge.
For this purpose, we utilized the traffic dataset DS601
prepared previously (Kawakatsu et al., 2019). DS601
was created automatically using Faster R-CNN (Ren
et al., 2015) and contains information about 996,093
vehicles which crossed over the bridge between 08:00
and 16:00 from November 2016 to April 2017. In this
work, we ignored all vehicles with two axles because
Adversarial Media-fusion Approach to Strain Prediction for Bridges
739
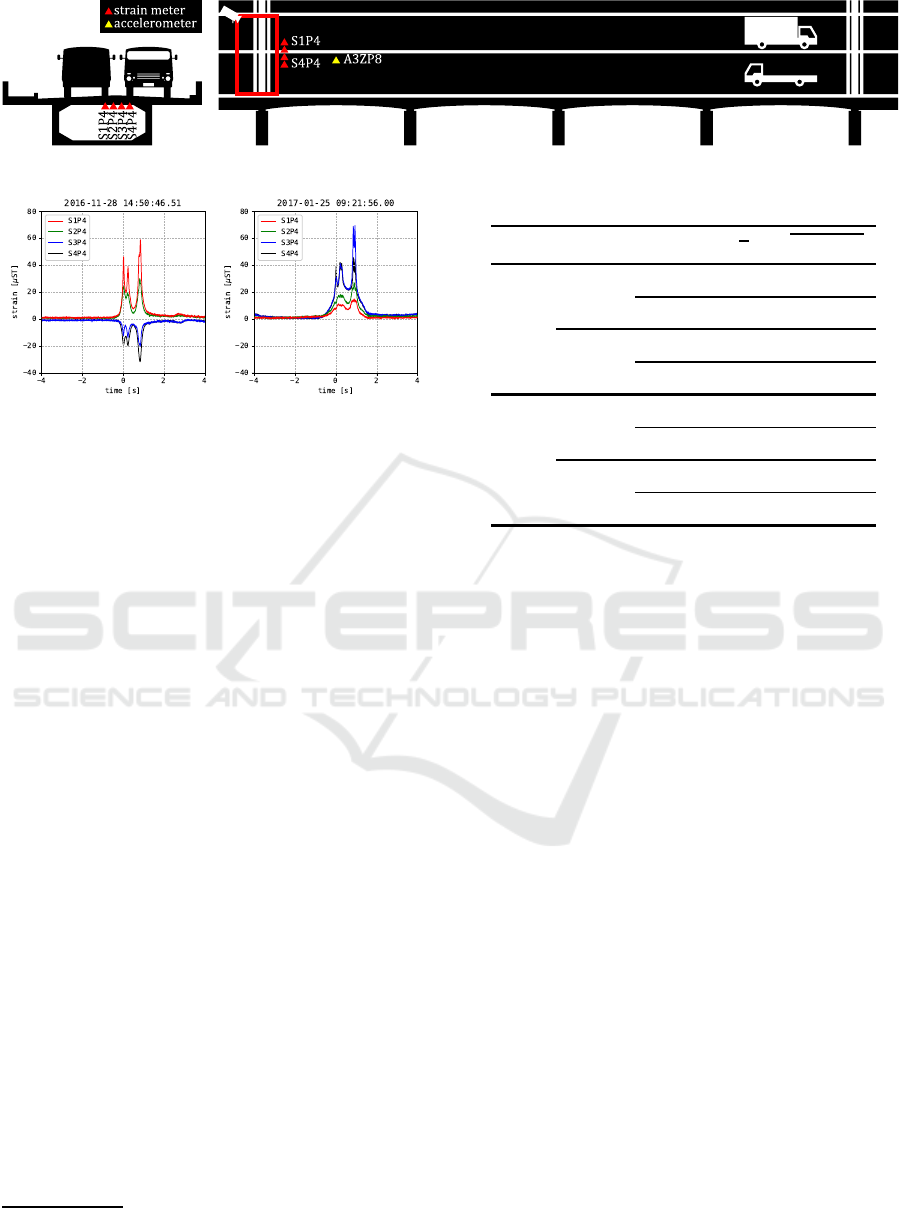
Figure 3: Installation positions of strain sensors and an accelerometer on Bridge C.
(a) An LtoR vehicle. (b) An RtoL vehicle.
Figure 4: Examples of strain responses caused by vehicles.
civil engineers are mainly interested in large vehicles.
We then collected videos of the target vehicles and
strain signals caused by the vehicles. The n-th vehicle
record is described as a triplet {x
n
, y
n
, z
n
} composed
of a video x, source sensor signal y, and target signal
z for the n-th vehicle. The traffic dataset was divided
randomly into two subsets, namely trainval data and
evaluation data. In addition, 20% of the trainval data
were assigned as validation data, while the remaining
80% were assigned as training data. The training data
were utilized for the generator optimization, while the
validation dataset was utilized for early stopping (Yao
et al., 2007). The evaluation was performed only once
using a model that updated the minimum of the MSE
for the validation data. The trainval dataset therefore
involved 17,757 LtoR and 20,996 RtoL vehicles, and
the evaluation data involved 17,967 LtoR and 21,078
RtoL vehicles.
We implemented two derivative generator models
on Chainer
1
5.0.0. One was the GAN model described
in Section 3, and the other was a MSE model trained
without the GAN mechanism. They were accelerated
by a GPU (NVIDIA GeForce GTX 1080 Ti), utilizing
CUDA
2
9.2. We also employed the AMSGrad (Reddi
et al., 2018) for optimization, and the mini-batch size
was set to 10. The two models were trained over 200
epochs, and the evaluation processes were performed
in the manner of early stopping (Yao et al., 2007).
First, we evaluated the signal correlation between
the observationz and the prediction ˆz. Unfortunately,
there are no accepted metrics for waveform similarity
1
http://chainer.org
2
http://developer.nvidia.com/cuda
Table 2: Kendall τ coefficients and MSEs for the GAN.
Lane Source Target τ k ˆz − zk
2
2
RtoL S1P4 S3P4 0.747 2.756
S4P4 0.730 3.035
S2P4 S3P4 0.756 2.645
S4P4 0.720 3.015
LtoR S3P4 S1P4 0.748 1.242
S2P4 0.687 2.018
S4P4 S1P4 0.691 1.268
S2P4 0.674 1.881
beyond squared distance and cross-correlation. In this
work, we focused on the fact that the values of signal
points could be estimated by a linear combination of
influence lines and therefore evaluated the correlation
between the signal points of the ground truth and the
prediction. It should be noted that the distributions of
the signal values were not uniform but biased strongly
toward 0 µST, as shown in Fig. 4. Therefore, we used
the rank correlation coefficient τ’s (Kendall, 1938) as
metrics. Table 2 shows the average τ coefficients and
the MSEs for the evaluation data. From these results,
the proposed GAN model was able to achievea strong
correlation between observation and prediction.
After the waveform prediction for the evaluation
dataset, we sorted the waveforms in terms of squared
error and extracted the first and third quantiles. Fig. 5
shows examples of strain responses for LtoR vehicles
passing over strain sensor S1P4, which were predicted
using sensor S4P4. The numbers in brackets indicate
the anomaly scores (Kawakatsu et al., 2018a) for real
and fake signals. For both quantiles, the GAN model
generated realistic signals that were indistinguishable
from the real observation data. As seen in Fig. 5, the
waveforms generated by the MSE model were much
smoother than those obtained by the GAN model. The
GAN simulated not only the macroscopic signals but
also the noise components. The strain peaks indicate
the times at which axles passed over the sensors, and
the two generators successfully simulated these peaks
both in terms of peak heights and times.
ICPRAM 2019 - 8th International Conference on Pattern Recognition Applications and Methods
740
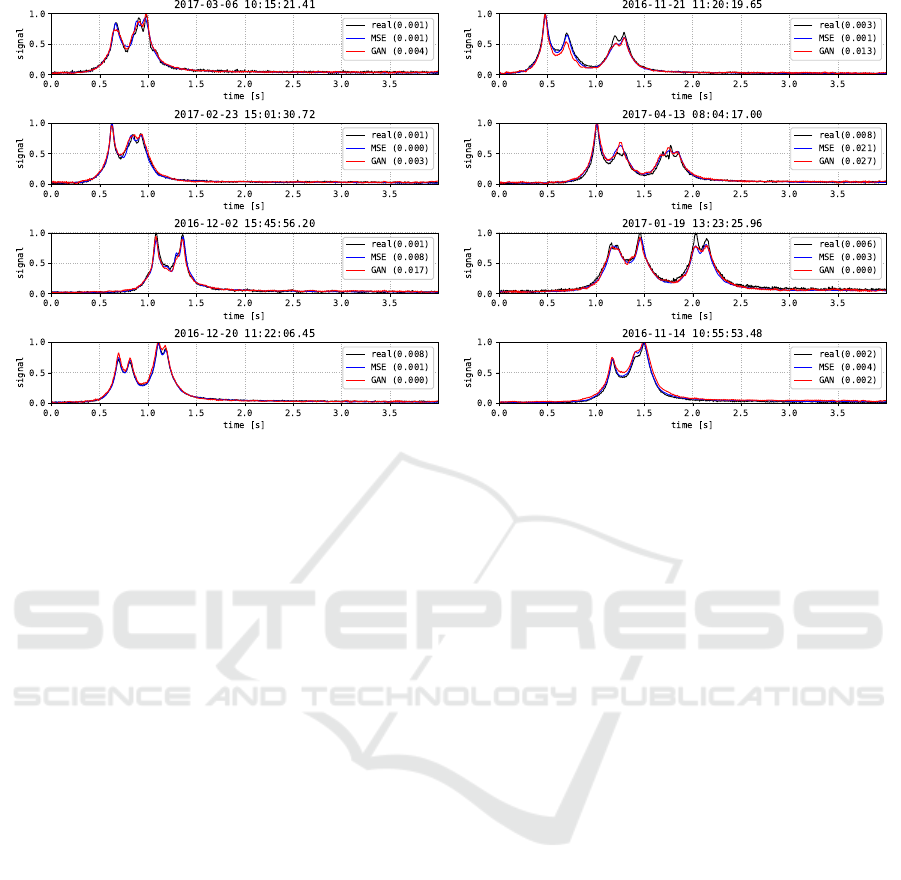
(a) 1st quartile. (b) 3rd quartile.
Figure 5: Strain signal prediction and anomaly scores for strain sensor S1P4 and LtoR vehicles using strain sensor S4P4.
Fig. 6 shows examples of strain signals for RtoL
vehicles crossing over strain sensor S4P4, which were
estimated using sensor S1P4. Due to the asymmetric
structure of the box girder, the shapes of the observed
signals were very different from those in Fig. 5. These
differences can be seen best in the skirts of the waves,
whose heights relative to the peaks were much greater
than those in Fig. 5. Again, our proposal successfully
simulated these gentle slopes, which start and end just
as the vehicle enters and leaves the target span on the
bridge.
5 DISCUSSION
In this work, we focused mainly on strain signals, al-
though the bridge components may produce various
kinds of mechanical responses when a vehicle crosses
the bridge. Strain responses on the deck have a strong
spatio-temporal locality, with the strain meters having
very little reaction to wheel loads at distant points and
recovering to the zero points rapidly after the vehicle
departs. In contrast, an accelerometer installed at the
center of the bridge span can react to distant vehicles,
and vibrations at the natural frequencies are likely to
be persistent. These properties make bridge vibration
analysis more difficult compared with strain analysis.
Whenever abnormal strain responses are found by
comparing the predicted and observed responses, we
may locate the area of bridge damage by reference to
wheel positions on the bridge, as has been explored in
some studies (Chen et al., 2014; Huang et al., 2016).
Unfortunately, strain sensors are prone to peeling off
the surface of bridge components and thus requiring
regular inspection. This is one major motive for using
less expensive accelerometers instead of strain meters
in civil engineering applications (Sekiya et al., 2018).
Therefore, in future work, we should develop a GAN
for acceleration-response prediction as an alternative
to strain-response prediction. Note that the proposed
generator may aid in the inspection process for strain
sensors.
6 CONCLUSION
We have proposed a novel media-fusion approach to
long-term bridge health monitoring. The proposed
GAN enables direct translation between strain sensors
deployed underneath the bridge deck by consulting a
surveillance camera on the bridge. The video features
may specify vehicle properties including speed, locus,
shape, and wheel positions as explanatory variables in
the strain prediction. Even though the video may lack
informationabout axle loads, this can be compensated
for by analyzing the source sensor signals. We tested
our generative network on real observation data, with
the results demonstrating highly accurate predictions
of measured waveforms.
We expect that bridge damage (and sensor faults)
may be revealed by comparing the error distributions
of predictions collected soon after the construction of
Adversarial Media-fusion Approach to Strain Prediction for Bridges
741
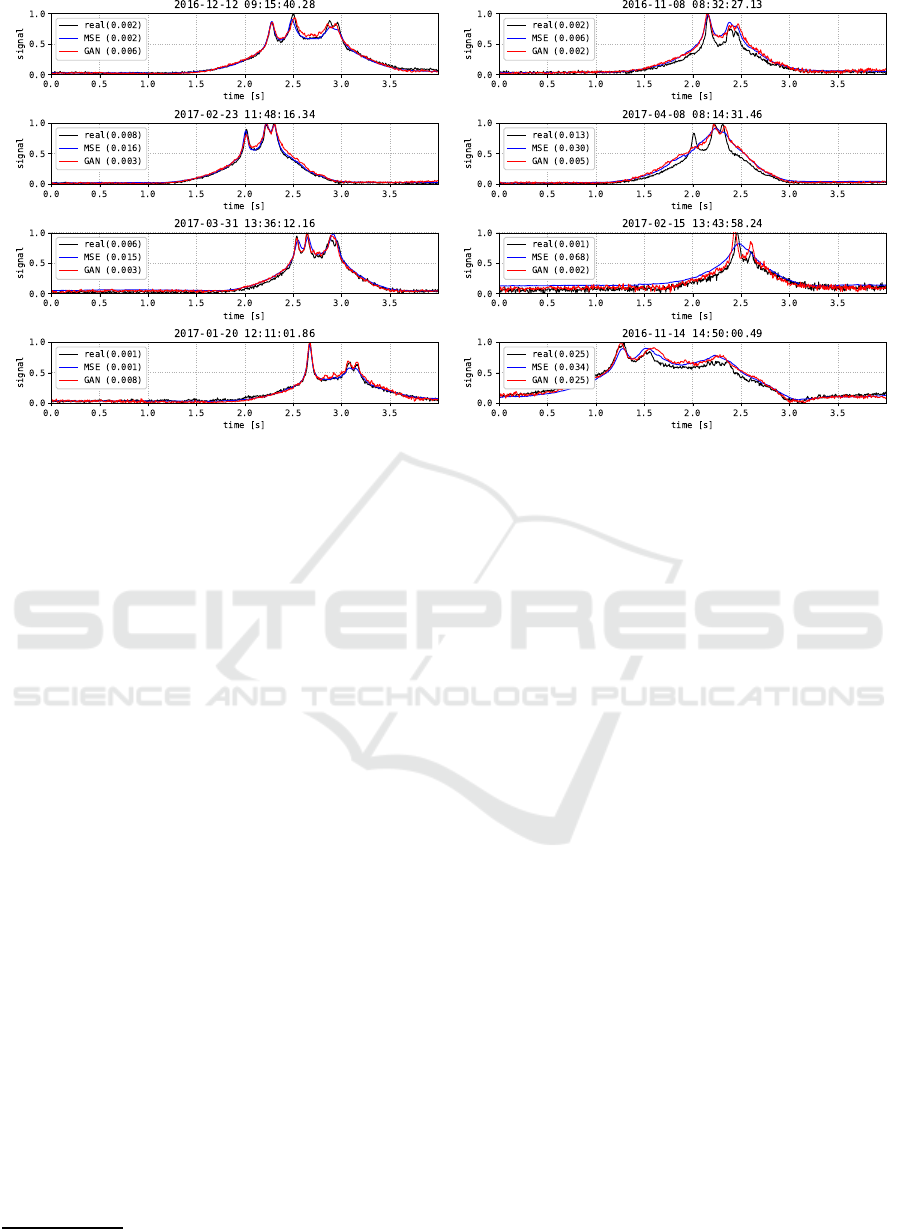
(a) 1st quartile. (b) 3rd quartile.
Figure 6: Strain signal prediction and anomaly scores for strain sensor S4P4 and RtoL vehicles using strain sensor S1P4.
the bridge with the current ones. Compared with the
direct comparison of video and strain-signal data in a
common feature space, the proposed network enables
the visualization of changes in physical quantities for
individual bridge components. In future experimental
work, we will investigate the connections between the
anomaly scores and strain-signal prediction errors. In
addition, we also aim to investigate sensor types other
than strain meters for use as alternativesignal sources.
ACKNOWLEDGEMENT
This work was supported by the cross-ministerial
Strategic Innovation Promotion (SIP) program
3
of the
Cabinet Office, Government of Japan.
REFERENCES
Bicanic, N. and Chen, H.-P. (1997). Damage identifica-
tion in framed structures using natural frequencies.
IJNME, 40(23).
Bing, Z., Tiesheng, W., and Shanshan, L. (2011). The re-
search of monitoring model for bridge running. In IC-
SSEM.
Cao, M. S., Sha, G. G., Gao, Y. F., and Ostachowicz, W.
(2017). Structural damage identification using damp-
ing: a compendium of uses and features. SMS, 26(4).
3
http://www.jst.go.jp/sip/k07.html
Chen, Z., Cai, Q., Lei, Y., and Zhu, S. (2014). Damage
detection of long-span bridges using stress influence
lines incorporated control charts. SCTS, 57(9).
Dai, W., Dai, C., Qu, S., Li, J., and Das, S. (2017). Very
deep convolutional neural networks for raw wave-
forms. In ICASSP.
Donahue, C., McAuley, J., and Puckette, M. (2018). Adver-
sarial audio synthesis. In ICLR.
Goodfellow, I. J., Pouget-Abadie, J., Mirza, M., Xu, B.,
Warde-Farley, D., Ozair, S., Courville, A., and Ben-
gio, Y. (2014). Generative adversarial nets. In NIPS.
He, K., Zhang, X., Ren, S., and Sun, J. (2016). Identity
mapping in deep residual networks. In ECCV.
Huang, Y., Zhu, C., Ye, Y., and Xiao, Y. (2016). Damage
detection of arch structure by using deflection influ-
ence line. In SEEIE.
Isola, P., Zhu, J.-Y., Zhou, T., and Efros, A. A. (2017).
Image-to-image translation with conditional adversar-
ial networks. In CVPR.
Kawakatsu, T., Kinoshita, A., Aihara, K., Takasu, A., and
Adachi, J. (2018a). Adversarial spiral learning ap-
proach to strain analysis for bridge damage detection.
In DaWaK.
Kawakatsu, T., Kinoshita, A., Aihara, K., Takasu, A., and
Adachi, J. (2018b). Deep sensing approach to single-
sensor bridge weighing in motion. In EWSHM.
Kawakatsu, T., Kinoshita, A., Aihara, K., Takasu, A., and
Adachi, J. (2019). Deep sensing approach to single-
sensor vehicle weighing system on bridges. IEEE Sen-
sors, 19(1):243–256.
Kendall, M. G. (1938). A new measure of rank correlation.
Biometrika, 30(1-2).
Liu, Y. and Wang, X. (2010). The application of BP neural
network in cable-stayed bridge construction monitor-
ing. In ICCIS.
ICPRAM 2019 - 8th International Conference on Pattern Recognition Applications and Methods
742

Lydon, M., Taylor, S., Robinson, D., Mufti, A., and OBrien,
E. (2015). Recent developmenets in bridge weigh in
motion (bwim). CSHM, 6.
Ma, Y. and Bi, H. (2011). Cable tension monitoring of sus-
pender arch bridges during cable tension adjustment
stage basis on neural network algorithm. In RSETE.
Maas, A. L. (2013). Rectifier nonlinearities improve neural
network acoustic models. In ICML.
Mohamed, B. and Tahar, E. (2017). Remote sensing of dam-
age bridge structure of free vibration by using finite
element method based on subspace fitting. In ICIS.
Mohamed, B., Tahar, E., and Houria, R. (2017). Remote
sensing of damage bridge structure of free vibration
by using finite element method based on jerk-energy.
In SERA.
Neves, A. C., Gonzalez, I., Leander, J., and Karoumi, R.
(2017). Structural health monitoring of bridges: a
model-free ANN-based approach to damage detec-
tion. CSHM, 7(5).
Neves, A. C., Gonzalez, I., Leander, J., and Karoumi,
R. (2018). A new approach to damage detection in
bridges using machine learning. In EVACES.
Palanisamy, R. P. and Sim, S.-H. (2015). Bridge scour mon-
itoring using extended kalman filter. In AESE.
Quansheng, S., Haiying, Y., Xiaoguang, G., Jiawei, W., and
Tong, W. (2010). Application of kalman’s filtering
method in construction control for cable replacement
of the cable-stayed bridge. In ICECE.
Radford, A., Metz, L., and Chintala, S. (2016). Unsuper-
vised representation learning with deep convolutional
generative adversarial networks. In ICLR.
Reddi, S., Kale, S., and Kumar, S. (2018). On the conver-
gence of adam and beyond. In ICLR.
Ren, S., He, K., Girshick, R. B., and Sun, J. (2015). Faster
R-CNN: Towards real-time object detection with re-
gion proposal networks. In NIPS.
Sekiya, H., Kubota, K., and Miki, C. (2018). Simpli-
fied portable bridge weigh-in-motion system using ac-
celerometers. JBE, 23(1).
Shah, A. A., Chowdhry, B. S., Daudpoto, J., and Ali, I.
(2018). Transient structural health monitoring of the
test bridges using finite element method. In IMTIC.
Wu, B., Lu, H., Chen, B., and Gao, Z. (2017). Study
on finite element model updating in highway bridge
static loading test using spatially-distributed optical
fiber sensors. Sensors, 17(7).
Xiao, C. and Fang, Z. (2016). Research on multi-sensor
information fusion algorithm with sensor fault diag-
nosis. In ICIICII.
Yang, S., Xie, L., Chen, X., Lou, X., Zhu, X., Huang, D.,
and Li, H. (2017). Statistical parametric speech syn-
thesis using generative adversarial networks under a
multi-task learning framework. In ASRU.
Yao, Y., Rosasco, L., and Caponnetto, A. (2007). On early
stopping in gradient descent learning. Constructive
Approximation, 26(2).
Yu, Y., Cai, C., and Deng, L. (2016). State-of-the-art review
on bridge weigh-in-motion technology. Advances in
Structural Engineering, 19(9).
Zaurin, R. and Catbas, F. N. (2011). Structural health mon-
itoring using video stream, influence lines, and statis-
tical analysis. SHM, 10(3).
Zhang, L., Sun, Z., Zhang, C., Dong, F., and Wei, P.
(2018). Numerical investigation of the dynamic re-
sponses of long-span bridges with consideration of
the random traffic flow based on the intelligent ACC-
BPNN model. IEEE Access, 6:28520–28529.
Adversarial Media-fusion Approach to Strain Prediction for Bridges
743
