Image-based Discrimination and Spatial Non-uniformity Analysis of
Effect Coatings
Ji
ˇ
r
´
ı Filip
1
, Radom
´
ır V
´
avra
1
, Frank J. Maile
2
and Bill Eibon
3
1
The Czech Academy of Sciences, Institute of Information Theory and Automation, Prague, Czech Republic
2
Schlenk Metallic Pigments, GmbH, Roth-Barnsdorf, Germany
3
PPG Industries, Cleveland, Ohio, U.S.A.
Keywords:
Effect Coating, Pigment, Discrimination, Cloudiness, Non-uniformity.
Abstract:
Various industries are striving for novel, more reliable but still efficient approaches to coatings characteri-
zation. Majority of industrial applications use portable instruments for characterization of effect coatings.
They typically capture a limited set of in-plane geometries and have limited ability to reliably characterize
gonio-apparent behavior typical for such coatings. The instruments rely mostly on color and reflectance char-
acteristics without using a texture information across the coating plane. In this paper, we propose image-based
method that counts numbers of effective pigments and their active area. First, we captured appearance of
eight effect coatings featuring four different pigment materials, in in-plane and out-of-plane geometries. We
used a gonioreflectometer for fixed viewing and varying illumination angles. Our analysis has shown that the
proposed method is able to clearly distinguish pigment materials and coating applications in both in-plane and
out-of-plane geometries. Finally, we show an application of our method to analysis of spatial non-uniformity,
i.e. cloudiness or mottling, across a coated panel.
1 INTRODUCTION
Coating industry uses a wide range of pigment materi-
als in combination with physical principles to achieve
eye-catching appearance of the coated surfaces that
stand out from the crowd (Maile and Reynders, 2010).
Metallic pigments rely mainly on geometrical proper-
ties of flakes and their reflectance, interference pig-
ments introduce effects due to light wave interference
with transparent substrate coated with materials of
high refractive indices, and diffraction pigments de-
compose light at a diffraction grating of a frequency
close to the wavelength of the incoming light. Note
that in practice many effect coatings are often combi-
nations of the above classes.
Majority of industrial and refinish aftermarket ap-
plications use portable instruments for characteriza-
tion of effect coatings. They typically capture be-
tween 3 and 6 standard in-plane geometries for fixed
illumination and variable observation angles. Such a
limited set of capturing geometries restricts their abil-
ity to reliably characterize gonio-apparent behavior
typical for effect coatings.
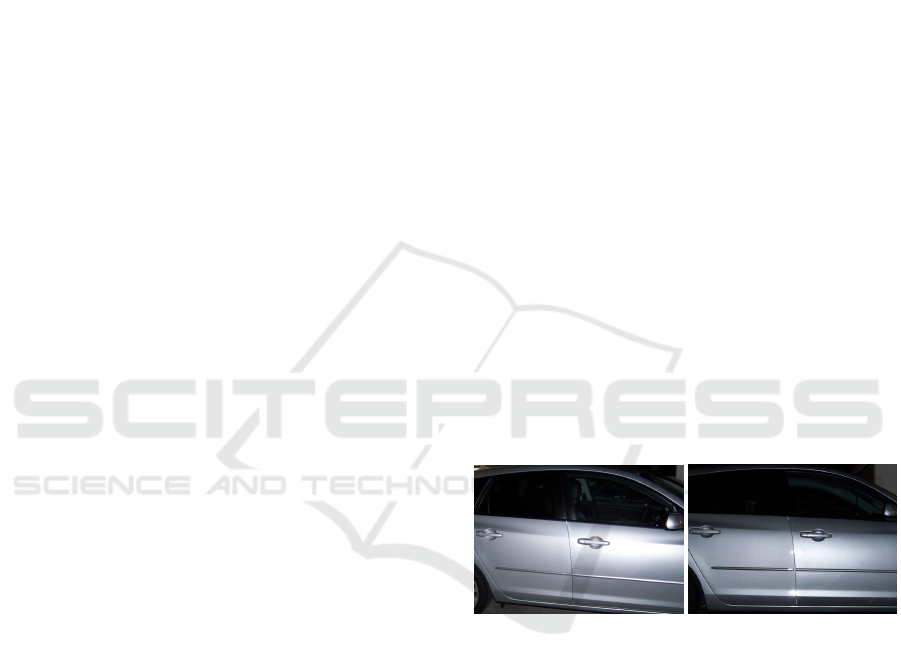
As an example can serve a car body refinishing
in Fig. 1, where coating appearance of the front and
Figure 1: Example of a car body part visually different from
the rest of body due to an insufficient number of illumina-
tion/viewing validation angles.
rear doors is not matched due to insufficient angular
sampling.
Therefore, industries are striving for novel, more
reliable but still efficient approaches to coatings char-
acterization (H
¨
ope et al., 2014). Majority of the meth-
ods rely mostly on color and reflectance characteris-
tics. Spatial information is not commonly used in in-
dustrial instruments. Currently, only two of them can
capture texture maps and use proprietary algorithm to
derive the levels of sparkliness and graininess refer-
ring to coating properties under directional and dif-
fuse illumination; however, their definitions and their
relation to typical user observations are unknown.
One of the promising approaches to effect pig-
Filip, J., Vávra, R., Maile, F. and Eibon, B.
Image-based Discrimination and Spatial Non-uniformity Analysis of Effect Coatings.
DOI: 10.5220/0007413906830690
In Proceedings of the 8th International Conference on Pattern Recognition Applications and Methods (ICPRAM 2019), pages 683-690
ISBN: 978-989-758-351-3
Copyright
c
2019 by SCITEPRESS – Science and Technology Publications, Lda. All rights reserved
683

ments characterization is using complementary in-
formation about pigment flakes density, distribution
and orientation in the coating layer. To this end,
we perform this analysis using a gonioreflectome-
ter for in-plane and out-of-plane geometries of fixed
viewing and varying illumination angles. Next, we
propose image-based coating characterization method
that counts numbers of effective pigments and their
coverage area. Our method allows robust discrimina-
tion of different pigment materials as well as the same
material with different coating technology.
Our paper first discusses a prior work in the field
in Section 2. Then the analyzed coating samples
and acquisition method are introduced in Section 3.
Method of pigment flakes detection is outlined in Sec-
tion 4 and its results are given in Section 5. Applica-
tion of the method to spatial uniformity analysis of
coatings is presented in Section 6, while the Section 7
concludes the paper.
2 RELATED WORK
One of the first survey works on application of angle-
dependent optical effects deriving from submicron
structures of films and pigments was presented in
(Pfaff and Reynders, 1999). A detailed overview of
special effect pigments is given in (Maile et al., 2005)
and (Pfaff, 2008).
Before considering to use any novel measure-
ment geometries, one can validate current industrial
standards (DIN (DIN, 1999) and ASTM (E2194-12,
2012),(E2539-12, 2012) used for the measurement
of appearance stemming from past research of gloss
and chromatic appearance (Hunter, 1937), (McCamy,
1996). This led to development of industrial multi-
angle gonioreflectometers: MA68 and MA98 by X-
rite, BYK-mac by Gardner, and MultiFX10 by Dat-
acolor as described more in detail in (Perales et al.,
2013). These devices typically capture between 5–12
in-the-plane geometries and BYK-mac even allows
pigment texture measurement using a built-in camera.
However, when it comes to effect coatings character-
ization, these devices, due to limited set of measure-
ment geometries, often struggle to identify individual
coatings reliably (G
´
omez et al., 2016).
A wide body of research work has been devoted to
analysis of bidirectional reflectance distribution func-
tions (BRDF) (Nicodemus et al., 1977) and chromatic
properties of effect coatings. Different measurement
geometries were analyzed in (Kirchner and Cramer,
2012), (Ferrero et al., 2015). A BRDF characteri-
zation of effect coatings using a half-difference pa-
rameterization of individual flakes was presented in
(Ferrero et al., 2013). The same parameterization was
applied in (Strothk
¨
amper et al., 2016) to predict the
global color appearance of coated surfaces and to an-
alyze color estimation using multi-angle spectropho-
tometers (Ferrero et al., 2015). Characterization of
diffraction pigments was studied in (Ferrero et al.,
2016).
Method of BRDF measurement and modelling
of effect coatings was introduced in (Mih
´
alik and
ˇ
Durikovi
ˇ
c, 2013). Kim et al. (Kim et al., 2010)
proposed a novel image-based method of pearlescent
paints spectral BRDF measurement using a dedicated
goniometric setup relying on a spherical sample and
derived a non-parametric bivariate reflectance model.
Lans et al. (Lans et al., 2012) presented an empiri-
cal approach to the realistic modelling of special ef-
fect flakes fitting patch-based model parameters us-
ing sparse texture data obtained by a portable multi-
angle spectrophotometer. In (Rump et al., 2009) were
presented extensions towards gonioapparent coatings
texture measurement and modelling using bidirec-
tional texture function (BTF) (Dana et al., 1999).
Although this research advanced considerably an
understanding of the processes driving the reflectance
and chromatic appearance of effect coatings, we are
not aware of any technique simultaneously analyzing
both spatial and gonioapparent appearance of effect
coatings at pigment size level.
3 COATING SAMPLES
ACQUISITION
Effect pigments can be, based on the principle of
chroma and sparkling effect generation, roughly di-
vided into three categories (Maile et al., 2005): metal-
lic , interference, and diffractive pigments. We tested
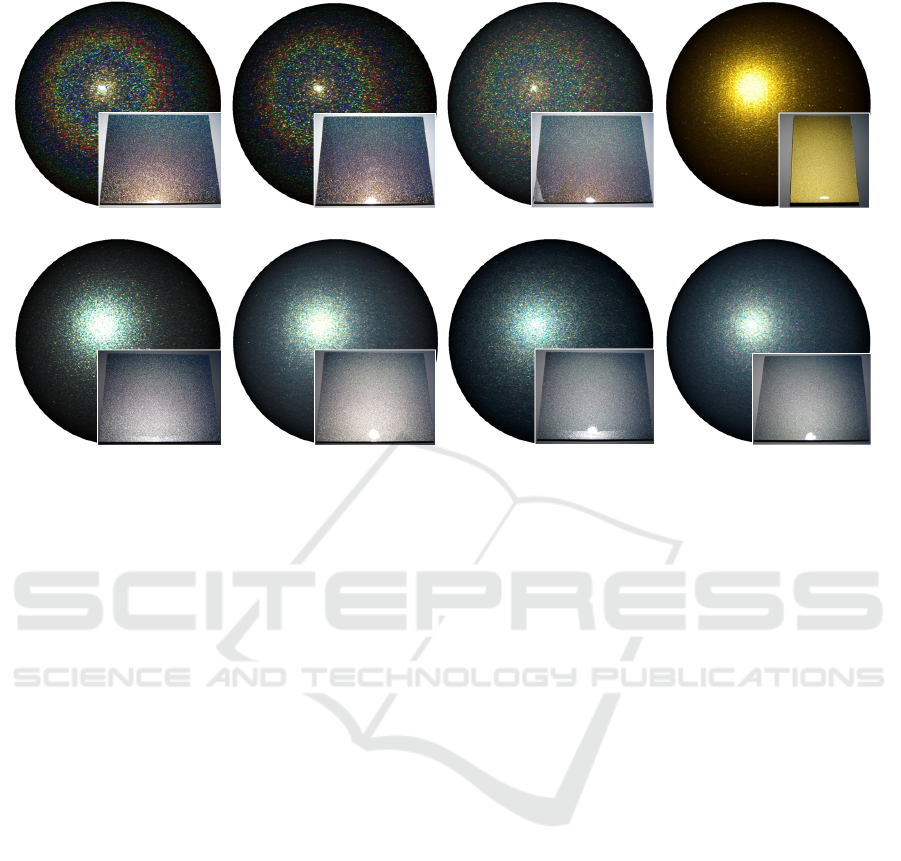
eight effect coatings featuring four different pigment
materials and different coating technology as shown
in inset images in Fig. 2:
• Polychromatic (MultiFlect
R
) – a polychromatic
coating including a diffraction pigment varying
in liquefying agent (water - poly1,poly3, solvent
- poly2) and its density (medium - poly1, poly2
and high - poly3).
• Ultra thin pigment (Zenexo
R
) a high-sparkle con-
trast, pearlescent coating including an ultra-thin,
colored aluminium pigment: UTP.
• Aluminum – coating including aluminum flakes
of silverdollar morphology: solvent (alu1) and
water-based (alu2).
• Mica – coating including white mica flakes flakes:
solvent (mica1) and water–based (mica2).
ICPRAM 2019 - 8th International Conference on Pattern Recognition Applications and Methods
684
(a) polychromatic1 (b) polychromatic2 (c) polychromatic3 (d) UTP
(e) aluminum1 (f) aluminum2 (g) mica1 (h) mica2
Figure 2: Photos (insets) of the tested coatings and their appearance captured as BTF visualized on a sphere: three samples
containing polychromatic effect pigments (a,b,c), one sample with ultra-thin pigment (d), two samples using aluminum flakes
(e,f), and two samples featuring white mica pigment (g,h).
All samples have comparable mean particle sizes ≈25
µm.
To capture the appearance of the tested effect coat-
ings we used UTIA gonioreflectometer (Filip et al.,
2013). It has four degrees of freedom (DOF) realized
by a turntable with the measured sample (1 DOF) and
by two arms: one holding a RGB camera (1 DOF),
and one holding a LED light (2 DOF). The inner arm
holds the LED light source 1.1m from the sample
and produces a narrow and uniform beam of light.
The outer arm holds an industrial, full-frame 16Mpix
RGB camera AVT Pike 1600C. The sensor’s distance
from the sample is 2m. By combination of camera
exposures and lighting intensities we capture high-
dynamic-range RGB images of the coating, where a
single pixel occupies approximately 46µm. The an-
alyzed coating area was approximately 6x6mm. Ap-
pearance of the test coating captured as BTF is shown
in Fig. 2
4 SPATIAL ANALYSIS OF
EFFECT COATINGS
In order to identify the number of visible, i.e. active
pigment flakes, in each image I, we performed the fol-
lowing analysis in each RGB channel. We decided to
use RGB instead of common L*a*b as it is native col-
orspace of our camera and to avoid possible errors due
to a conversion process. First, we selected a candidate
whose image pixels had distinct color in the particular
color channel, e.g., for the red channel, the following
conditions had to apply
(P
R
> P
G
+ d) & (P
R
> P
B
+ d) , (1)
where P are pixel intensity values, d = 0.2, i.e., 20%
of the image dynamic range and subscripts
R,G,B
de-
note individual color channels.
However, these conditions are insufficient in the
center of the high-reflectance pigments, whose values
often tend to be achromatic. Therefore, we extended
the color information from the pixel’s neighborhood
by filtering the image I using a Gaussian filter (width
10 pixels, standard deviation σ = 1.0) to produce a fil-
tered image I
F
. The following alternative conditions
were used
(P
R
> m) & (P
G
> m) & (P
B
> m) & . . .
& (P
F
R
> P
F
G
) & (P
F
R
> P
F
B
) , (2)
where P
F
are pixels from filtered image and m = 0.9,
i.e., 90% of the image dynamic range. The equations
for the other two channels are similar.
If any of the above conditions for the tested pixel
apply, the pixel becomes a candidate for a respective
color channel. To remove visual noise outliers result-
ing from possible flakes interreflections, the image is
the subject of a morphological opening operator, dis-
Image-based Discrimination and Spatial Non-uniformity Analysis of Effect Coatings
685
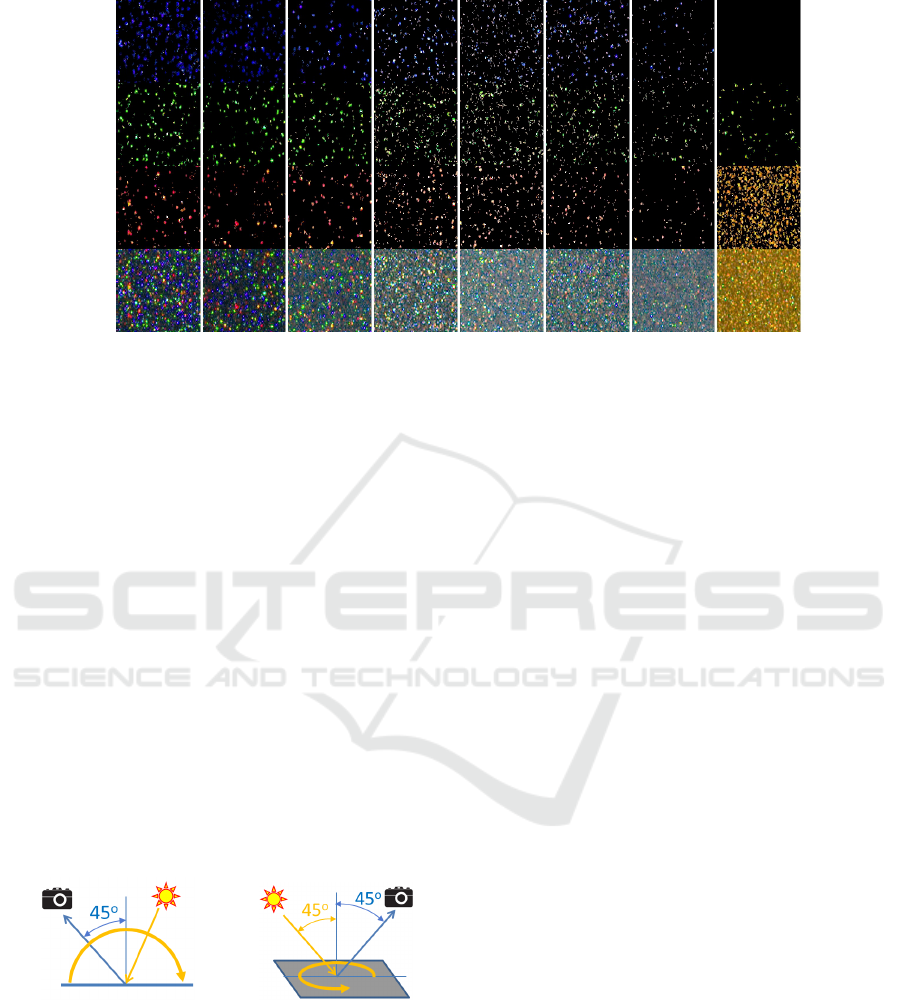
poly1 poly2 poly3 alu1 alu2 mica1 mica2 UTP
original Red Green Blue
Figure 3: Example of identified flakes in individual RGB color channels for seven effect pigments (out-of-plane geometry and
illumination azimuthal angle 230
◦
, area 6×6 mm).
carding all elements with a size smaller than 3 x 3 pix-
els. Finally, the number of the remaining connected
regions and their pixel area are counted. Fig. 3 shows
examples of identified pigments in each color chan-
nel. The original image is on the bottom.
Once individual pigments are identified in each
color channel, we can use this information to derive
several computational features. The most straightfor-
ward one is the count of isolated pigments. The sec-
ond one is percentage of sample surface the coverage
by the segmented pigments, while the third one is the
average intensity of segmented pigments.
Our method depends on three parameters: chan-
nels difference threshold d, pixel intensity m, and
Gaussian filter variance σ. The first two related to a
dynamic range of all acquired images. Their settings
was relatively stable in the proximity of the values
given above, but they can be adjusted when different
coating types or different effect particle sizes are ana-
lyzed.
(a) (b)
Figure 4: The tested (a) in-plane and (b) out-of-plane illu-
mination/viewing geometry configurations.
5 RESULTS
We performed in-plane and out-of-plane analyses.
For in-plane analysis, we used the geometry shown
in Fig. 4-a, i.e., with the camera fixed at an elevation
angle 45
◦
from the surface normal, while the illumi-
nation elevation angles covered the whole plane from
-90
◦
to 90
◦
. In the case of the out-of-plane analy-
sis, we had the camera fixed at the same elevation an-
gle 45
◦
from surface normal (Fig. 4-b). The sampling
step of measurement for all three geometries was one
degree. Please note that both geometries have a blind
spot of a span of around 25
◦
due to occlusion of the
camera’s view by the arm with the light.
The captured in-plane data consisted of 180 im-
ages while the out-of-plane data consisted of 360 im-
ages of resolution 140×140 pixels corresponding to
sample size 6 × 6 mm.
The results of in-plane analysis are shown in
Fig. 5-a. The polar graph represents 180
◦
(-90
◦
,90
◦
)
covered by images taken over in-plane geometry. For
each image the values of pigments count, coverage,
and intensity are computed across seven tested ma-
terials. The polar plots visualize in-plane geometry
laterally and the camera observes material from ele-
vation angle 45
◦
(angle 135
◦
in polar plots). From
the plots we can immediately observe noisy behav-
ior of the pigment count (left), which is due to union
of isolated pigment flakes, when their intensity in-
creases towards specular highlight. In contrast, the
coverage feature (middle) produces more smooth re-
sults across entire in-plane geometry, thus allowing
clear distinguishing between the tested coatings. By
analysis of coverage one can observe that near 20
◦
as-
pecular (light elevation angle 25
◦
) is a promising can-
didate for coatings discrimination (shown as angular
range denoted as A); however, it should be sampled
together with around 55
◦
aspecular (light elevation
angle -10
◦
) to detect presence of the first order diffrac-
tion highlight present for polychromatic coatings (an-
gular range B). Further, although the intensity feature
ICPRAM 2019 - 8th International Conference on Pattern Recognition Applications and Methods
686
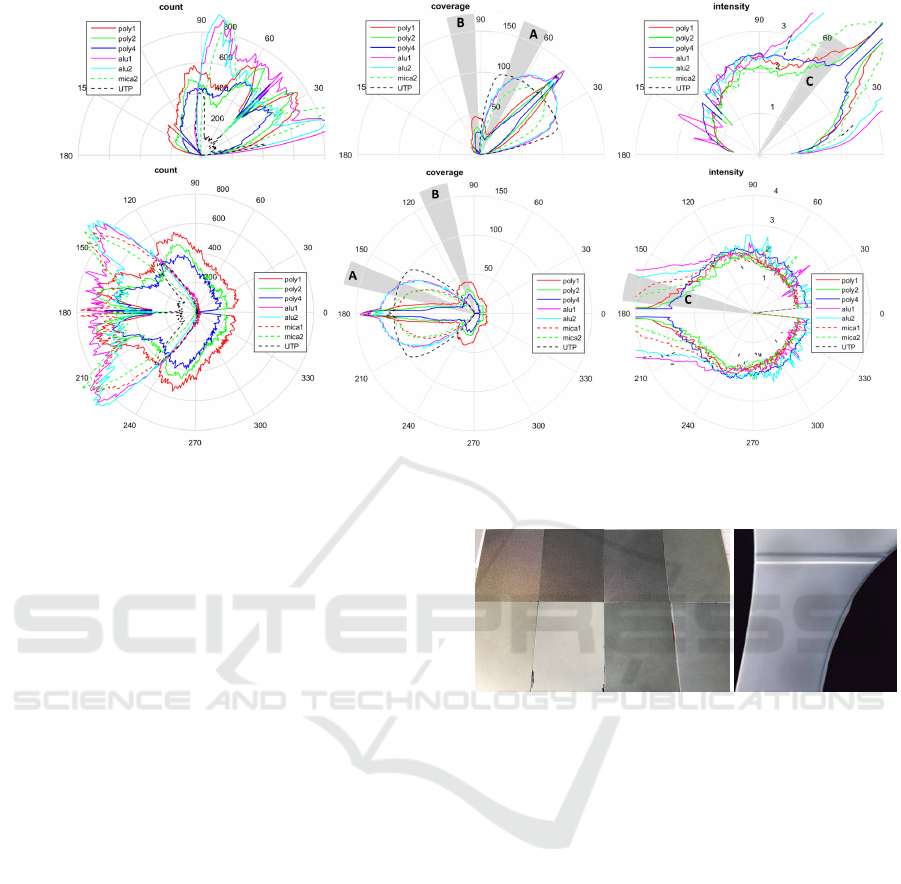
(a)
(b)
Figure 5: Results of (a) in-plane analysis of seven samples and (b) out-of-plane analysis of eight samples. Segmented pigments
count (left), their percentage of sample area coverage (middle), and average intensity (right).
(right) shows relatively noisy behavior too, the angles
close to specular reflection allow discrimination be-
tween the water/solvent-based coatings technologies
(angular range C).
The results of out-of-plane analysis are shown in
Fig. 5-b. The polar graph represents 360
◦
covered by
images taken over out-of-plane geometry. Again, for
each image the values of pigments count, coverage,
and intensity are computed across eight tested mate-
rials. In this case, we observe the geometry from the
overhead, where the camera is at azimuth 0
◦
. Differ-
ent azimuthal illumination directions produce the be-
havior very similar to the one for the in-plane geome-
try. Again, the percentage of area coverage produces
the smoothest results and optimal discrimination az-
imuthal angles are near 160
◦
and 200
◦
(denoted by
areas A) in combination with 100
◦
and 260
◦
(denoted
by areas B) from a camera azimuth. The intensity
image shows a again promising range of angles for
coating technologies discrimination denoted as C.
In both cases, it is clear that the coverage and in-
tensity features are able clearly separate not only dif-
ferent coating materials, but also their different vari-
ants due to coating technology.
6 SPATIAL UNIFORMITY OF
EFFECT PIGMENTS
Finally, we applied the proposed pigment segmenta-
tion results to analysis of a spatial uniformity of effect
Figure 6: An example of cloudiness / mottling visible as
spatial nonuniformity on: (left) a set of coated panels,
(right) a part of car body.
coatings. These visually disturbing non-uniform arti-
facts (see Fig. 6) are in coating industry denotes as
cloudiness or mottling. Therefore, their reliable de-
tection is crucial for quality control of coating pro-
duction process, where non-uniform coating applica-
tion produces cloudy artifact visible at specific, typ-
ically diffuse, illumination conditions. The cloudi-
ness is caused by a coating composition, movement of
spray-gun over the coated object, shape of the nozzle,
air pressure and other parameters in painting applica-
tion and solidification process. As such artifacts are
often barely visible, one can either rely on a dedicated
hardware for cloudiness evaluation or on knowledge
of a trained expert. Based on this, the parameters of
the coating process are iteratively adjusted till an ac-
ceptable coating uniformity is reached.
We tackle this problem by proposing a technique
relying on behavior of isolated pigments contours in
each captured image described in Section 4. Let
I be a single RGB image from out-of-plane geom-
Image-based Discrimination and Spatial Non-uniformity Analysis of Effect Coatings
687
etry, f
B
(I
s
(i), d, m, σ) is a function generating bi-
nary image containing only pixels indicating pres-
ence of segmented flakes in a selected RGB chan-
nel s, where d, m, σ are segmentation parameters, and
i ∈ {0
◦
, 360
◦
} is azimuthal angle across out-of-plane
geometry. First, we sum up the detected flakes con-
tribution across all RGB channels to obtain a single
binary image
A
i
=
∑
s={R,G,B}
f
B
(I
s
(i);d, m, σ) . (3)
Then, a density map of pigment flakes is obtained as
D =
360
◦
∑
i=1
◦
A
i
. (4)
As we want also evaluate differences due to non-
uniform orientation of pigment flakes we compute
also pixel-wise standard variance of pigments pres-
ence across different azimuthal angles, we compute a
variation map as
V =
1
360
360
◦
∑
i=1
◦
(A
i
− D)
2
. (5)
We apply these two features (density D and vari-
ance V) on two effect coatings mica1, mica2. As we
want to capture also non-uniformity due to pigment
disorientation, we decided to use out-of-plane geom-
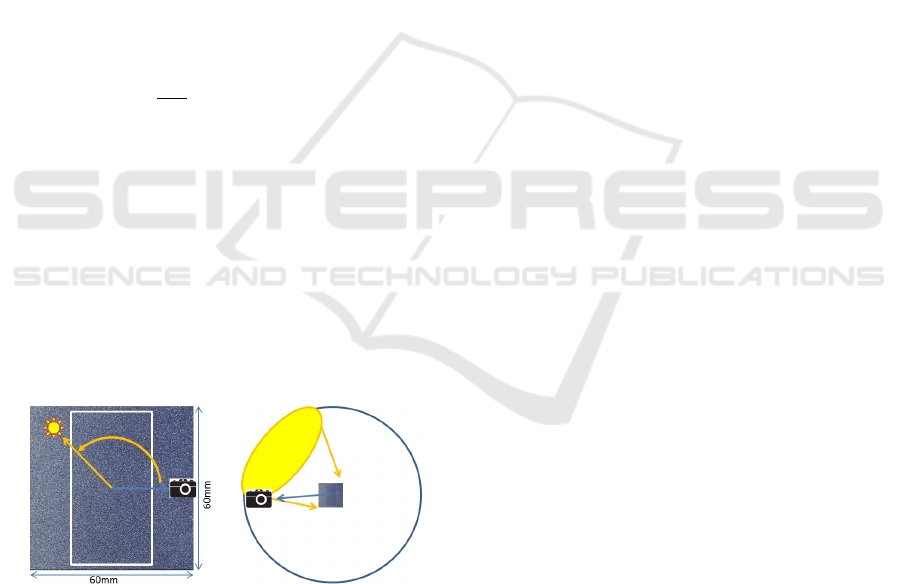
etry described in Fig. 4-b. Due to optical diffraction
effect resulting in limited depth of field for viewing el-
evation angle 45
◦
, we restricted the region-of-interest
in camera direction to guarantee sharp texture across
entire analyzed area as shown in Fig. 7-a. The size of
analyzed image is 1300×717 pixels corresponding to
area 60×30 mm.
(a) (b)
Figure 7: (a) A region of interest selection on the sample
plane and its relation to measured out-of-plane geometry,
(b) an overhead scheme of illumination and viewing condi-
tions for obtaining cloudiness reference images.
The obtained uniformity maps using both pro-
posed features side-by-side with enhanced photo-
graph of the coated panels are shown in Fig. 8.
These reference images (left) were obtained by using
quarter-hemisphere diffuse illumination and nearly
retro-reflective viewing angle as shown schematically
in Fig. 7-b (light and camera elevation angles are 45
◦
and their distances from the sample are 0.7 m). The
original feature images are rather noisy, so we fil-
tered these images using a median filter with a ker-
nel size 100×100 pixels. The filtered images on the
right can be regarded as uniformity maps, highlight-
ing differences between spatial locations due to a dif-
ferent density of detected pigment flakes. The black
banding is due to the filter kernel size. When compar-
ing the results to the reference image on the left, we
can observe, that although both features correlate with
the reference, a slightly better performance in non-
uniformity prediction was obtained using the density
feature. Fig. 8 also shows a dynamic range of values
in non-uniformity maps for both tested materials and
features. Higher values for mica1 are due to a higher
contrast in flakes structure.
7 CONCLUSION
We proposed a gonioapparent effect coatings charac-
terization method based on using a total area occupied
by pigment flakes at a given image threshold level.
Our analysis has shown that the proposed method is
able to clearly distinguish pigment materials and coat-
ing applications in both in-plane and out-of-plane ge-
ometries. Results also revealed that one can identify
a sparse set of geometries that perform the best in
differentiation of the coatings materials and different
coating technology. These geometries can be used to
obtain complementary information to that obtained by
commercial instruments and can be regarded as pos-
sible measurement geometry candidates for future in-
struments. Finally, we have shown application of our
image segmentation results over out-of-plane geome-
try, to assessment of coating spatial non-uniformity,
i.e. cloudiness or mottling, of effect coatings. To
sum up, our results show that using gonioapparent
image-based data is a promising way of effective and
reliable characterization of effect coatings as well as
for pigment spatial uniformity analysis. In future, we
plan to derive a computational measure of spatial non-
uniformity of effect coatings based on combination of
uniformity map histogram and frequency analysis.
ACKNOWLEDGMENT
This research has been supported by the Czech Sci-
ence Foundation grant GA17-18407S.
ICPRAM 2019 - 8th International Conference on Pattern Recognition Applications and Methods
688
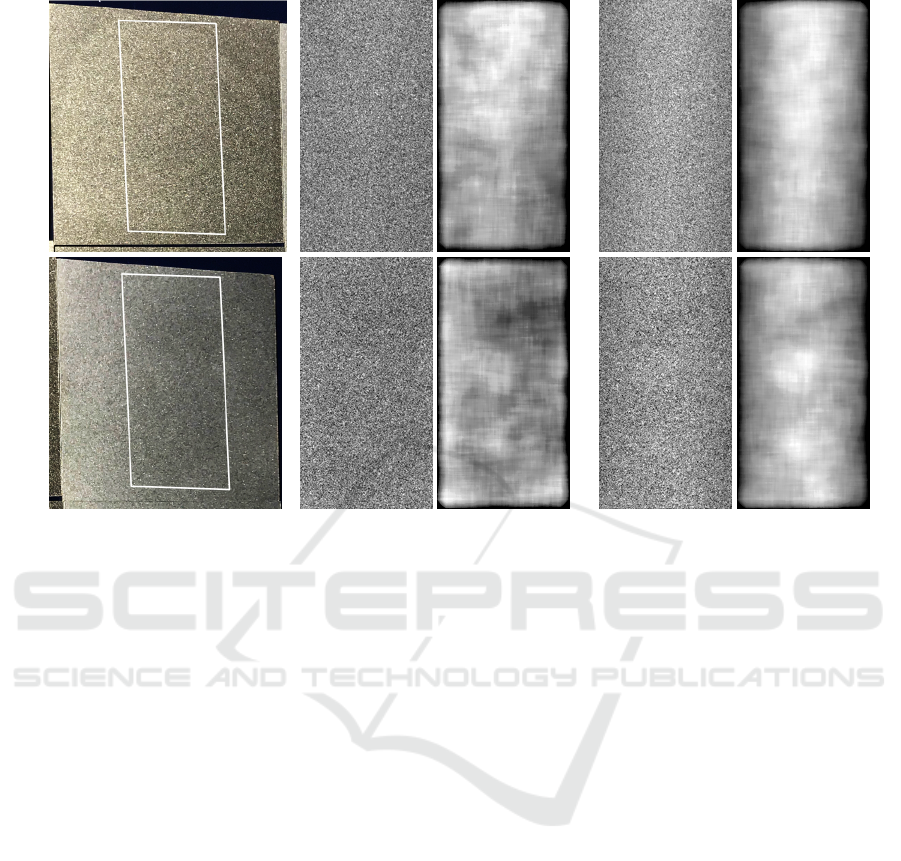
(a) reference photo (b) density filtered (c)variance filtered
mica1
dynamic range 8.65
dynamic range 0.038
mica2
dynamic range 6.03
dynamic range 0.027
Figure 8: Results of out-of-plane spatial uniformity analysis of samples mica1 and mica2: (a) reference cloudiness obtained
by SW enhancement of the coated panel photograph, (b,c) results of the density D and variance V features, respectively, and
their filtering using median filter. Dynamic ranges of individual features are included.
REFERENCES
(1999). Deutsches Institut f
¨
ur Normung e.V., DIN 55945.
Dana, K., van Ginneken, B., Nayar, S., and Koenderink, J.
(1999). Reflectance and texture of real-world surfaces.
ACM Transactions on Graphics, 18(1):1–34.
E2194-12, A. (2012). Standard practice for multiangle
color measurement of metal flake pigmented materi-
als. West Consh. PA: ASTM Inter., 2012.
E2539-12, A. (2012). Standard practice for multiangle color
measurement of interference pigments. West Con-
shohocken PA: ASTM Inter., 2012.
Ferrero, A., Bernad, B., Campos, J., Perales, E., Vel
´
azquez,
J. L., and Mart
´
ınez-Verd
´
u, F. M. (2016). Color charac-
terization of coatings with diffraction pigments. JOSA
A, 33(10):1978–1988.
Ferrero, A., Campos, J., Perales, E., Mart
´
ınez-Verd
´
u, F. M.,
Van der Lans, I., and Kirchner, E. (2015). Global color
estimation of special-effect coatings from measure-
ments by commercially available portable multiangle
spectrophotometers. Journal of the Optical Society of
America A, 32(1):1–11.
Ferrero, A., Rabal, A., Campos, J., Mart
´
ınez-Verd
´
u, F.,
Chorro, E., Perales, E., Pons, A., and Hernanz, M. L.
(2013). Spectral brdf-based determination of proper
measurement geometries to characterize color shift of
special effect coatings. Journal of the Optical Society
of America A, 30(2):206–214.
Filip, J., V
´
avra, R., Haindl, M., Zid, P., Krupicka, M.,
and Havran, V. (2013). BRDF slices: Accurate adap-
tive anisotropic appearance acquisition. In Conference
on Computer Vision and Pattern Recognition, pages
4321–4326.
G
´
omez, O., Perales, E., Chorro, E., Burgos, F. J., Viqueira,
V., Vilaseca, M., Mart
´
ınez-Verd
´
u, F. M., and Pujol, J.
(2016). Visual and instrumental assessments of color
differences in automotive coatings. Color Research &
Application, 41(4):384–391.
H
¨
ope, A., Koo, A., Verdu, F. M., Leloup, F., Obein, G.,
W
¨
ubbeler, G., Campos, J., Iacomussi, P., Priit, J., and
K
¨
allberg, S. (2014). Multidimensional reflectometry
for industry (xd-reflect) a european research project.
In Electronic Imaging, number 9018-04, pages 1–11.
Hunter, R. S. (1937). Methods of determining gloss. NBS
Research paper RP, 958.
Kim, D. B., Seo, M. K., Kim, K. Y., and Lee, K. H. (2010).
Acquisition and representation of pearlescent paints
using an image-based goniospectrophotometer. Opti-
cal engineering, 49(4):043604.
Kirchner, E. and Cramer, W. (2012). Making sense of mea-
surement geometries for multi-angle spectrophotome-
ters. Color Research & Application, 37(3):186–198.
Lans, I. v. d., Kirchner, E., and Half, A. (2012). Accurate
appearance-based visualization of car paints. In Pro-
ceedings of International Conference on Computer
Graphics, volume 2012, pages 17–23.
Maile, F. J., Pfaff, G., and Reynders, P. (2005). Effect pig-
Image-based Discrimination and Spatial Non-uniformity Analysis of Effect Coatings
689

ment – past, present and future. Progress in Organic
Coatings, 54(3):150 – 163.
Maile, F. J. and Reynders, P. (2010). A colorful menagerie
of platelets for transparent effect pigments. Asia Pa-
cific Coatings Journal, 23(1):14–17.
McCamy, C. (1996). Observation and measurement of the
appearance of metallic materials. part i. macro appear-
ance. Color Research & Application, 21(4):292–304.
Mih
´
alik, A. and
ˇ
Durikovi
ˇ
c, R. (2013). Metallic paint
appearance measurement and rendering. Journal
of Applied Mathematics, Statistics and Informatics,
9(2):25–39.
Nicodemus, F., Richmond, J., Hsia, J., Ginsburg, I., and
Limperis, T. (1977). Geometrical considerations and
nomenclature for reflectance. NBS Monograph 160,
pages 1–52.
Perales, E., Chorro, E., Viqueira, V., and Mart
´
ınez-Verd
´
u,
F. M. (2013). Reproducibility comparison among
multiangle spectrophotometers. Color Research &
Applications, 38(3):160–167.
Pfaff, G. (2008). Special effect pigments: technical basics
and applications. Vincentz Network GmbH & Co KG,
Hannover.
Pfaff, G. and Reynders, P. (1999). Angle-dependent opti-
cal effects deriving from submicron structures of films
and pigments. Chemical reviews, 99(7):1963–1982.
Rump, M., Sarlette, R., and Klein, R. (2009). Efficient re-
sampling, compression and rendering of metallic and
pearlescent paint. In Magnor, M., Rosenhahn, B., and
Theisel, H., editors, Vision, Modeling, and Visualiza-
tion, pages 11–18.
Strothk
¨
amper, C., Hauer, K.-O., and H
¨
ope, A. (2016).
How to efficiently characterize special effect coatings.
Journal of the Optical Society of America A, 33(1):1–
8.
ICPRAM 2019 - 8th International Conference on Pattern Recognition Applications and Methods
690
