
An Image Forgery Detection Solution based on DCT Coefficient Analysis
Hoai Phuong Nguyen
1
, Florent Retraint
2
, Fr
´
ed
´
eric Morain-Nicolier
1
and Agn
`
es Delahaies
1
1
CREsTIC, University of Reims Champagne-Ardenne, Reims, France
2
LM2S, Institute Charles-Delaunay, Troyes University of Technology, Troyes, France
agnes.delahaies@univ-reims.fr
Keywords:
Image Forgery Detection, JPEG Compression, Double Compression, DCT Coefficient.
Abstract:
JPEG compression and double JPEG compression introduces systematically some particular characteristics in
the Discrete Cosine Transform (DCT) domain. In this paper, we propose a description of these characteristics.
We also describe how to exploit these characteristics to introduce a new and efficient solution for estimating the
quantization steps used in the first compression of a double-compressed image. We also introduce a method
for detecting forgery in compressed images. Rapid, having a simple implementation and there is no need for
training to be functional, the proposed solution gives, however, a performance auspicious. Its performance is
demonstrated on simulated images and images retrieved from several public databases.
1 INTRODUCTION
With the advent of digital imaging, digital images be-
come an accessible and indispensable source of infor-
mation. However, due to the availability of several
powerful image processing and editing software pro-
grams, these images are quite easy to manipulate. In
fact, it is possible to add or remove essential contents
from an image without exposing any visible traces of
tampering. In some case, when the integrity and gen-
uineness of information transmitted are crucial, espe-
cially when we use images as critical evidence, it is
vital to look for ways to detect and localize forged re-
gions in digital images. There are many techniques
to create forged images such as removing objects or
regions of images, splicing objects from one image
to another, duplicating objects in the same image,
etc. These techniques modify locally the information
transmitted by the image. They also create some dis-
crepancies between the forged and original region the
image. By identifying and highlighting these discrep-
ancies, many forgeries detection solutions have been
proposed in the literature.
Forged regions are often scaled, rotated or modi-
fied to be coherent to the neighboring unforged area,
which causes the resampling of the local region. The
local presence of a resampling operation may be used
as evidence of image manipulation. Many resampling
detection solutions have been proposed (Popescu and
Farid, 2005; Gallagher and Chen, 2008; Mahdian and
Saic, 2008; Bunk et al., 2017; Mohammed et al.,
2018). Noise inconsistencies (Mahdian and Saic,
2009; Liu et al., 2014; Yang et al., 2016), lighting
artifacts (D and C, 2015) have been also exploited for
forgery detection.
Several other solutions exploited different artifacts
caused by the JPEG compression process to detect
image forgeries. Farid (Farid, 2009) proposed to re-
save image under different JPEG qualities then de-
tecting spatially localized local minima in the differ-
ence between the image and its JPEG-recompressed
counterparts. In many cases, these minima are highly
salient and can be detected. Yang et al. (Yang
et al., 2014) proposed a method for detecting double
JPEG compression with the same quantization ma-
trix, which can be useful for image forgery detection.
Bianchi and Piva (Bianchi and Piva, 2012) proposed a
image forgery localization method via block-grained
Analysis of JPEG Artifacts. The authors in (Ting and
Rangding, 2009; Ye et al., 2007; Lin et al., 2009;
Wang et al., 2014) proposed to exploit the consistency
in the distribution of quantized DCT coefficients to
detect and localize tampered regions.
JPEG is a widely used image format which is
appropriate for storage and transmission purposes.
Distortions caused by JPEG compression can help
forgers to better hide their manipulations by disrupt-
ing several useful image regularities, such as noise,
aberrations, etc. Therefore, the workflow of a dig-
ital image forgery often finishes by intentionally or
unintentionally resaving the forged image under the
JPEG format. If the original image is already in
Nguyen, H., Retraint, F., Morain-Nicolier, F. and Delahaies, A.
An Image Forgery Detection Solution based on DCT Coefficient Analysis.
DOI: 10.5220/0007412804870494
In Proceedings of the 5th International Conference on Information Systems Security and Privacy (ICISSP 2019), pages 487-494
ISBN: 978-989-758-359-9
Copyright
c
2019 by SCITEPRESS – Science and Technology Publications, Lda. All rights reserved
487
JPEG format, the final forged image would contain re-
gions where a double compression has been occurred.
JPEG compression introduces some particular prop-
erties systematically in the DCT domain.
The rest of the paper is organized as follows. Sec-
tion 2 gives a description of these properties under
different situations where a single or a double JPEG
compression has been occurred. We introduce after
that, in Section 3 a histogram-based solution for the
estimation of the first quantization step employed in a
double-compressed image. In Section 4, we introduce
a new and simple solution for image forgery detec-
tion based on the estimation of the first quantization
step. The proposed solution has been tested on sim-
ulated data and images from some public databases.
Experimental results show a good performance of the
proposed solution for detecting forged images com-
pressed under high quality factor.
2 SIGNATURE OF JPEG
COMPRESSION IN THE DCT
DOMAIN
2.1 JPEG Compression
After optionally applying the color space conver-
sion and down sampling, JPEG compression process
continues by dividing each color channels into non-
overlapped 8×8 blocks. Each block is first trans-
formed in DCT domain. The DCT coefficients of each
block will be converted into entire numbers and then
quantized.
For a given 8×8 blocks of non-compressed im-
age, let m
i
,i ∈ {1,2,..64} denote the i-th coefficient
obtained after applying DCT on the block. Each co-
efficient is related to the contribution of an associ-
ated frequency in the block. The quantization oper-
ation is performed to reduce information in high fre-
quency components, which are often less sensitive to
the human visual system. Let q
i
,i ∈ {1,2, ..64} de-
note the quantization steps employed for quantizing
the 64 corresponding DCT coefficients. The value of
q
i
is constant over all the blocks. It is defined a pri-
ori in function of the expected Quality Factor. The
Quantization Table, constituted by q
i
,i ∈ {1,2,..64},
is stocked as metadata of the JPEG file, which can be
easily retrieved during the decompression process.
For a given DCT coefficient, by omitting its index
for the sake of simplicity, denote m,c, Q respectively
the DCT coefficient, its quantized value and the cor-
responding quantization step. We have that:
c =
m
Q
. (1)
The JPEG decompression is processed by apply-
ing dequantization operation and then the DCT in-
verse transforms to come back in spatial domain. The
dequantized DCT coefficient, denoted d, is obtained
by multiplying its corresponding quantized value with
the same quantization step used during compression
process. We have that:
d = cQ =
m
Q
Q. (2)
Therefore, the dequantized DCT coefficients are mul-
tiples of the corresponding quantization steps.
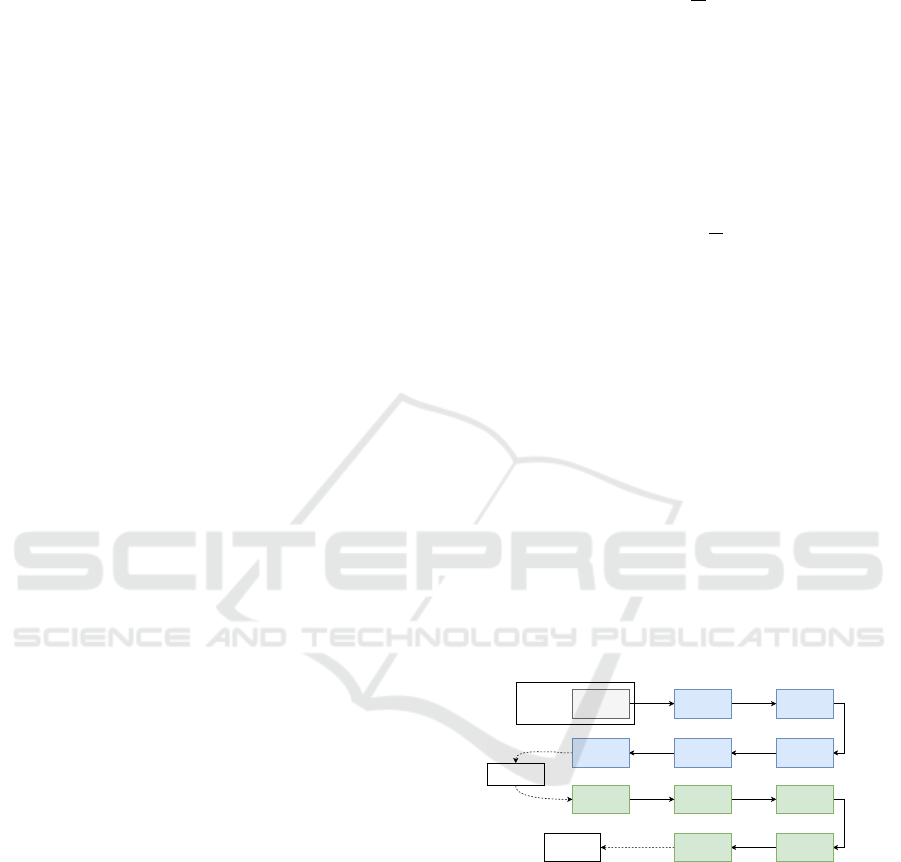
2.2 JPEG Double Compression
The JPEG double compression involves two succes-
sive JPEG compression processes. Figure 1 illus-
trates different operations occurring in a JPEG dou-
ble compression. White rectangles represent the dif-
ferent input/output images. Knowing that JPEG com-
pression is processed independently between differ-
ent 8×8 non-overlapped blocks, we use color rect-
angles to represent different stages of a block: blue
for the first compression and green for the second
one. Dashed lines designate the passage between
blocks and images. The color space conversion re-
quires blocks from all color channels to process.
8×8 spatial
block
m
c
1
c
1
d
1
=c
1
Q
1
d'
1
c2
c2
d2=c
2
Q
2
JPEG
J
1
J'
1
DCT
Quantization
\Q
1
Entropy
Coding/
Decoding
Dequantization
×Q
1
IDCT
DCT
Entropy
Coding/
Decoding
IDCT
Color Conversion
Dequantization
×Q
2
Quantization
\Q
2
Uncompressed
Image
RGB
Color Conversion
Color Conversion
Figure 1: Different operations occurring in a JPEG double
compression process. The index of DCT channels is omit-
ted for the sake of simplicity.
For a given DCT frequency, denote Q
i
, c
i
, d
i
,
i ∈ {1,2} respectively the quantization step, the quan-
tized and dequantized DCT coefficient of the i-th
compression. Denote d
0
1
the DCT coefficient ob-
tained after the second DCT transform. Denote re-
spectively J
1
,J
0
1
the 8×8 spatial blocks obtained right
after the first IDCT transform and before the second
DCT transform. Due to rounding error of the color
space conversion operations, J
0
1
may differ from J
1
.
We have that:
J
0
= J + R
CSC
, (3)
ICISSP 2019 - 5th International Conference on Information Systems Security and Privacy
488

where R
CSC
is the cumulative errors of the two color
space conversion processes. Noting that DCT and
IDCT are linear operations, we obtain the following
development:
d
0
1
= DCT(J
0
1
) = DCT(J
1
+ R
CSC
)
= DCT([IDCT(d
1
)] + R
CSC
)
= DCT(IDCT(d
1
) + R + R
CSC
)
= d
1
+ E = c
1
Q
1
+ E,
(4)
where E = DCT(R + R
CSC
), R is the rounding error
of the IDCT transform, and [.] is the round-off func-
tion. E can be considered as random variable centered
at 0, with a high probability of dropping in the ]−1, 1[
interval (> 90%), (Thai et al., 2017). Finally, we ob-
tain the following equation of c
2
:
c
2
=
c
1
Q
1
+ E
Q
2
. (5)
3 QUANTIZATION STEP
ESTIMATION
Given a JPEG image, we can retrieve the quantized
DCT coefficients easily and the Quantization Table
from JPEG file. However, in double-compressed im-
ages, the quantization step and the exact values of
quantized DCT coefficients involved in the first com-
pression would be lost after the second one. For
forensics purposes, it is proposed to estimate the lost
Q
1
knowing Q
2
and having a sample of c
2
. Lou
et al. (Luo et al., 2010), Thai et al. (Thai et al.,
2017) have proposed different solutions for estimat-
ing quantization step from an image that has been pre-
viously JPEG-compressed and then stored in lossless
format. These solutions solve only a particular case
of the proposed problem, when Q
2
= 1. Pevny and
Fridirich (Pevny and Fridrich, 2008) have proposed
a method for the detection of double JPEG compres-
sion using a soft-margin support vector machine. The
144-dimensional features vector employed contains
the number of occurrences of the first 16 multiples of
the second quantization step retrieved from the first
9 AC frequencies. They have also proposed a mul-
ticlassifier which permits detecting Q
1
for the first 9
AC frequencies when Q
2
∈ {4,5,6, 7,8}.
In this section, we propose a new histogram-based
approach for the estimation of Q
1
knowing Q
2
and
having a sample of c
2
. Let consider Equation 14,
knowing that E is a random variable which drops into
the ] − 1, 1[ interval with a very high probability, we
have that:
c
1
Q
1
Q
2
− 1 ≤ c
2
≤
c
1
Q
1
Q
2
+ 1 (6)
and it is more likely that c
2
=
h
c
1
Q
1
Q
2
i
. It means that
the histogram of a sample of c
2
will highly likely con-
tains peaks located at
h
kQ
1
Q
2
i
,k ∈ Z. Furthermore, bas-
ing on the statistical model of DCT coefficients pro-
posed by Thai et al (Thai et al., 2013), it is likely that:
h
k
1
Q
1
Q
2
> h
k
2
Q
1
Q
2
(7)
for 0 ≤ k
1
< k
2
or 0 ≥ k
1
> k
2
where h(x) denotes the
number of occurrences of x in the histogram.
Given Q
1
, by varying k, we can predict all the
possible values of
h
kQ
1
Q
2
i
, and then all the possible
peaks of the histogram. Denote P
Q
1
= {p
i
,i ∈ I
P
Q
1
},
and H = {x
i
,i ∈ I
H
} respectively the sets of predicted
peaks’ location and actual peaks’ location of c2 sam-
ple’s histogram, where I
P
Q
1
,I
H
are respectively the
sets of index of P
Q
1
and H, we propose a measure of
the difference between the set P
Q
1
and the histogram
of c
2
sample, denoted by S(P
Q
1
,H), as follows:
S(P
Q
1
,H) =
∑
p∈P
Q
1
( f
H
(p)−h(p))+
∑
p∈H
(1−e
P
Q
1
(p)) f
H
(p),
(8)
where
e
X
(p) =
(
1 : if p ∈ X
0 : if p /∈ X
(9)
and f
H
(x) is the score function, which is empirically
defined from the histogram of the c2 sample as fol-
lows:
f
H
(εx
i
+ (1 − ε)x
i+1
) = εh(x
i
)+(1−ε)h(x
i+1
) (10)
for all ε ∈ [0,1] and x
i
,x
i+1
are any two successive
elements of H. In the equation 8, the first term ac-
counts for the difference contributed by DCT values
belonging to P
Q
1
, the second term accounts for the
difference contributed by DCT values belonging to
H but not belonging to P
Q
1
. DCT values which do
not belong to H ∪ P
Q
1
are not taken into account in
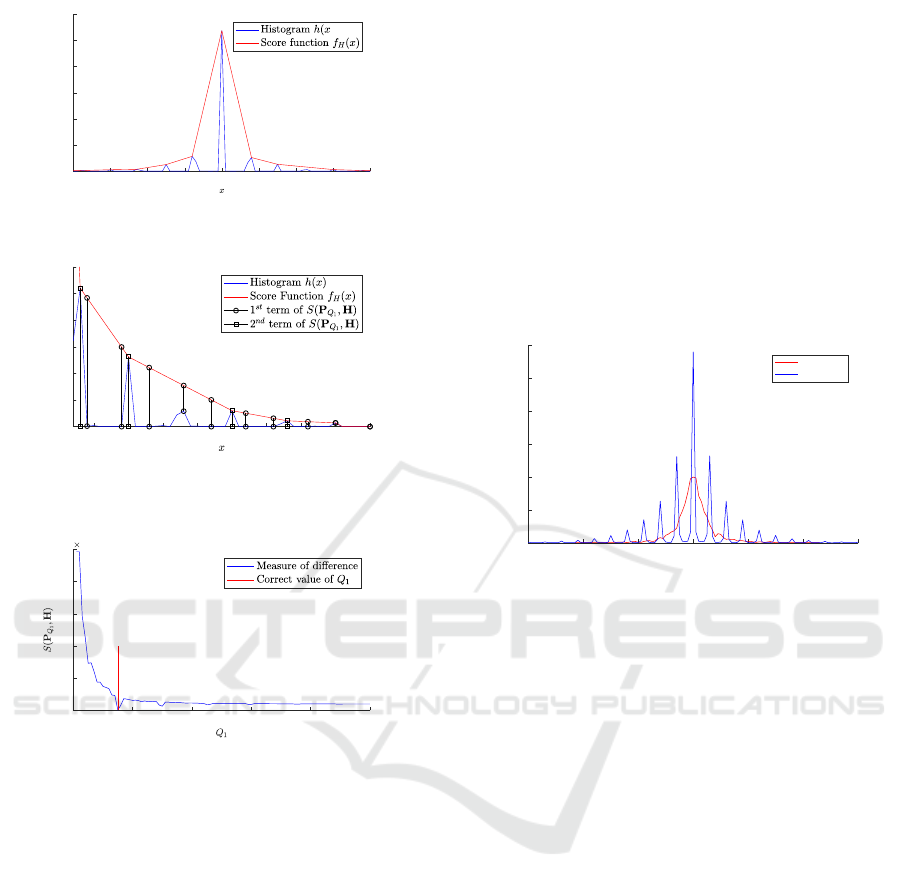
the proposed measure of difference. Figure 2 shows
a typical histogram of DCT coefficients (for a given
frequency) knowing that Q
1
= 15 and Q
2
= 2. The
score function f
H
(x) is given in red. Figure 3 illus-
trates different terms contributing in the measure of
difference S(P
Q
1
,H) where Q
1
= 15, Q
2
= 2 and the
predicted value of Q
1
is set at 9.
The value of Q
1
which minimizes the measure of
difference S(P
Q
1
,H) is the best estimation for the un-
known Q
1
. Figure 4 illustrates the evolution of the
measure of difference S(P
Q
1
,H) when Q
1
varies from
1 to 100.
The proposed method for estimation of the first
quantization step performs correctly when Q
1
> Q
2
,
An Image Forgery Detection Solution based on DCT Coefficient Analysis
489
-40 -30 -20 -10 0 10 20 30 40
0
500
1000
1500
2000
2500
3000
Figure 2: Histogram of DCT coefficients and the proposed
scoring function (Q
1
= 15, Q
2
= 2).
10 15 20 25 30 35 40 45 50
0
50
100
150
200
250
300
Figure 3: Illustration of different terms contributing in
S(P
Q
1
,H) where Q
1
= 15, Q
2
= 2 and the predicted value
of Q
1
is set at 9.
0 20 40 60 80 100
0
0.5
1
1.5
2
2.5
10
4
Figure 4: Typical evolution of the measure of difference
S(P
Q
1
,H) (Q
1
= 15, Q
2
= 2).
which means that the Quality Factor (QF) of the sec-
ond compression must be greater than the QF of the
first one. Furthermore, the estimation of Q
1
in high
DCT frequencies is not reliable due to insufficient
statistics.
4 PROPOSED FORGERY
DETECTION SOLUTION
In this study, we only consider the cases where forged
images are created by modifying locally an authentic
JPEG image, titled here as the carrier image. When a
region of the carrier image is forged, because of many
reasons, the DCT coefficients within the forged region
do not have the same behavior of the ones in the rest
of the image. The reasons could be:
• The forged region comes from an uncompressed
image or an image compressed using Quantifica-
tion Table different from the one utilized in the
carrier image.
• Manipulations such as filtering, interpolating,
scaling, etc. during the forgery process break the
characteristics of quantized DCT coefficients of
the forged region.
• There may be some mismatch of the DCT grid of
the forged region with that of the rest of the image.
When the forged image is recompressed to save,
the forged region is forced to use the same DCT
grid as the whole image. Traces of the first com-
pression will disappear for blocks within forged
region.
-60 -40 -20 0 20 40 60
DCT values
0
0.05
0.1
0.15
0.2
0.25
0.3
density
tampered
all
Figure 5: Normalized histograms of DCT coefficients at a
given frequency of a forged image (blue curve) and of the
forged region within the same image (red curve).
Figure 5 shows the normalized histograms of DCT
coefficients at a given frequency of a forged im-
age and of the forged region within the same image.
When the area of the forged region is small enough in
comparison to the whole image’s area, the DCT co-
efficients of blocks within the forged region do not
contribute much into the shape of the whole image’s
DCT histograms. Then, we can employ these DCT
histograms, extracted from the whole image, to esti-
mate the quantization steps of the JPEG compression
realized previously on the carrier image.
For a given DCT channel, having the correspond-
ing estimated quantization step, we can predict all the
values possible of its DCT coefficients, P = {p
i
,i ∈
I
P
}. If the estimation is precise, blocks of which
the corresponding DCT coefficient do not belong to
the set of predicted DCT values can be considered
as forged ones. Denote Z =
{
z
i
|i ∈ I
B
}
the set of all
DCT values belonging to the channel, where I
B
is the
set of 8×8 block indexes. We propose a score map
S =
{
s
i
|i ∈ I
B
}
for forgery detection, which is defined
as follows:
s
i
= f
P
(z
i
), (11)
ICISSP 2019 - 5th International Conference on Information Systems Security and Privacy
490
where the score function f
S
(z) is defined as fol-
lows:
f
P
(z) =
(
d
P
(z) if d
P
(z) > 1
0 if d
P
(z) ∈ {0,1}
(12)
and the function d
P
(z) returns the distance from z to
the nearest element of P. For any z, there always ex-
ists p and q (p < q) two successive elements of P and
α ∈ [0,1) such as z = αp + (1 − α)q, d
P
(z) is defined
as follows:
d
P
(z) = min(α,1 − α)(q − p). (13)
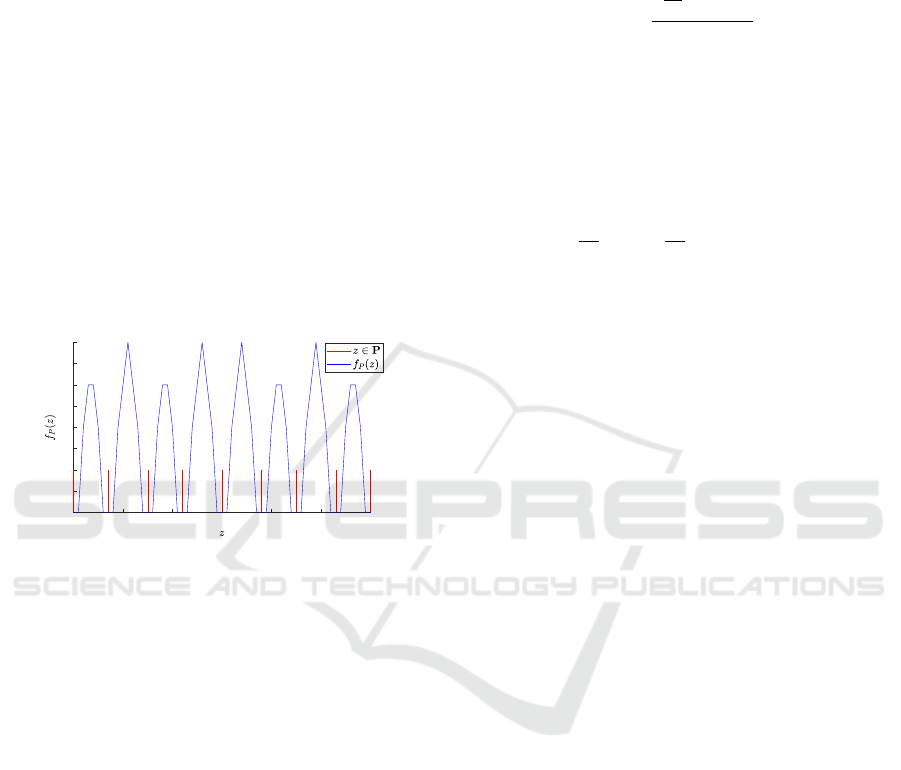
The score function f
P
(z) is set to the distance d
P
(z),
because we simply consider that the more a DCT
value is far from its nearest p ∈ P, the more likely that
it belongs to the forged region. When d
P
(z) ≤ 1, it is
highly likely that the related block belongs to forged
regions. To minimize the false detection rate, f
P
(z) is
set to zero in these cases.
-30 -20 -10 0 10 20 30
0
0.5
1
1.5
2
2.5
3
3.5
4
Figure 6: Illustration of the function f
P
(z) where the set P
is defined with Q
1
= 15 and Q
2
= 2.
Hence, for every DCT channels where we can es-
timate the first quantization step, we can produce a
score map. By summing up all these individual score
maps, we obtain a global score map, which permits
detecting and localizing forgeries. The presence in
cluster of non-zero scores in the global score map per-
mits highlighting and localizing forged regions. How-
ever, a zero score map cannot provide us sufficient
means to confirm the authenticity of an image.
5 NUMERICAL RESULTS
5.1 Estimation of the First Quantization
Step
To evaluate the performance of the proposed solu-
tion for the estimation of the first quantization step,
for each couple of (Q
1
,Q
2
) Q
1
∈ {1,2, ...,100} and
Q
2
∈ {1,2,...,50}, we generate a sample of c
2
. The
generated sample of c
2
would be used to obtain an
estimated value of Q
1
, denoted
ˆ
Q
1
. We finally com-
pare
ˆ
Q
1
and its correct counterpart Q
1
. The sample
of c
2
contains 4096 elements, which corresponds to
the number of 8×8 blocks of a 512×512 image. Each
element of the sample is obtained by the following
equation:
c
2
=
h
m
Q
1
i
Q
1
+ E
Q
2
, (14)
where m represents a value of a non-quantized DCT
coefficient, which is modeled as a sample of a zero-
mean Laplacian random variable with the scale pa-
rameter b = 128, knowing that the probability density
function of a zero-mean Laplacian random variable
with the scale parameter b is given as follows:
f (x) =
1
2b
exp
−
|x|
b
, where x ∈ R, (15)
and E is a zero-mean random variable where
P(E ∈] − 1, 1[) = 0.9.
Figure 7 shows the values of |
ˆ
Q
1
− Q
1
| for different
values of Q
1
and Q
2
. The proposed algorithm can de-
fine precisely in most of the cases when Q
1
> 2Q
2
.
When Q
2
< 15, the proposed algorithm can also de-
fine precisely some value of Q
1
which is smaller than
2Q
2
and greater than Q
2
. When Q
1
= 2Q
2
or Q
1
<
Q
2
, the proposed algorithm fails to estimate Q
1
. The
bigger the value of Q
2
is, the more the performance
of the proposed estimation algorithm decreases.
The proposed estimation method relies on the dy-
namic in value of the c
2
sample. If the distribution of
m has a small scale parameter and when Q
1
and Q
2
are big enough, all or most of the value of c
2
sam-
ple will be zero. The other values of c
2
, if exist will
create one or two small peaks far from the principal
peak, which is located at 0. The poor dynamic of the
related histogram does not permit to obtain a good es-
timation using the proposed method. The size of the
c
2
sample is also a factor which impacts directly on
the performance of the proposed method.
5.2 Forgery Detection Performance on
Simulated Images
The proposed forgery detection solution has been
first tested on simulated images. We have employed
two 512×512 TIFF images (boats512x512.tif and
bridges512x512.tif ) for the simulation, Figures 8a
and 8b. The boats and bridges images are respectively
used as carrier and donner for a splicing operation.
The two images are respectively compressed with a
quality factor equal to QF
1
and 95. Assuming that the
forger possesses only the compressed version of the
two images. The forged image, Figure 8c, is simply
An Image Forgery Detection Solution based on DCT Coefficient Analysis
491
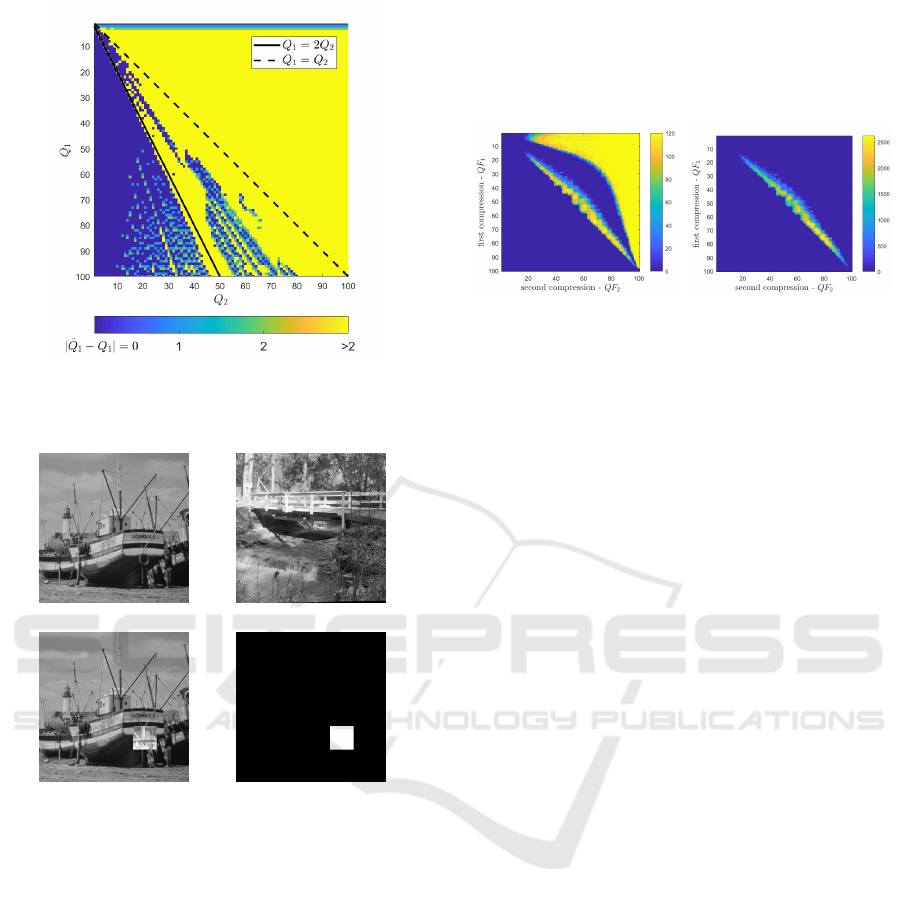
Figure 7: Performance of the proposed method for the es-
timation of Q
1
for different values of Q
2
visualized via the
value of |
ˆ
Q
1
− Q
1
|.
(a) (b)
(c) (d)
Figure 8: Simulation of splicing forgery: (a) Carrier image
boats512x512.tif, (b) Donner image bridges512x512.tif, (c)
forged image created by splicing (d) ground truth.
created by copying a small square of the bridge’s im-
age and then pasting it on an arbitrary position within
the boat’s image. Figure 8d gives the ground-truth
of the given forged image. After the splicing opera-
tion, the forger would resave the forged image under
the JPEG format, and the QF selected for the JPEG
compression is QF
2
.
Quality Factor of a JPEG compression varies from
1 to 100. When QF = 1, all the 64 quantization steps
will be set to 255, the compressed image lost almost
its information. When QF = 100, all the 64 quanti-
zation steps will be set to 1, there is no compression
and the image is in its best quality. For different val-
ues of QF
1
and QF
2
varying from 1 to 100, we cre-
ated a forged image. The proposed method for im-
age forgery detection is then applied on the image to
detect the forged region. We evaluated the detection
performance by studying the number of forged block
correctly detected and the number of unforged blocks
incorrectly classified for different values of QF
1
and
QF
2
.
(a) (b)
Figure 9: Number forged blocks correctly detected (a) and
number of unforged blocks incorrectly classified (b) for dif-
ferent values of Quality Factor of the first and second JPEG
compressions. Simulated images contain 4096 8×8-blocks
in total and the number of forged blocks is 120.
Figure 9a and Figure 9b describe respectively the
number of forged block correctly detected and the
number of unforged blocks incorrectly classified for
different values of QF
1
and QF
2
. By comparing the
two figures, we can see that the proposed solution per-
forms well over a big set of a couple of (QF
1
,QF
2
).
For every couple of (QF
1
,QF
2
) which locates in the
yellow region in the top-right corner of Figure 9a,
the detection of forged region is precise. For couples
which locate on the hot color regions which present
on both Figure 9a and Figure 9b, the proposed solu-
tion performs badly with a very high number of un-
forged blocks misclassified. The blue region repre-
sents all the couples (QF
1
,QF
2
) where the forged im-
age can bypass the proposed detection solution.
5.3 Forgery Detection Performance on
Images from Public Database
As demonstrated in the previous section, we admit
that our method cannot detect all forgeries. It can only
detect forgery for JPEG images which were created
from JPEG images and resaved with a QF greater than
the QF of the original ones. When forged images is
resaved under an uncompressed format such as TIFF,
we can consider that Q
2
= 1 for all the 64 DCT co-
efficients. We can then obtain an estimated sample
of c
2
by applying the DCT manually transform. The
proposed solution performs well in these cases. We
have tested our image forgery detection solution on
the two public databases CASIA v1 and CASA v2
(Dong et al., ). For QF
2
> 95, our method performs
well for most of the case, we restricted therefore to
study images which have QF greater than 95. From
the CASIA databases, we have extracted a set of 177
forged images. The proposed solution achieved to lo-
ICISSP 2019 - 5th International Conference on Information Systems Security and Privacy
492
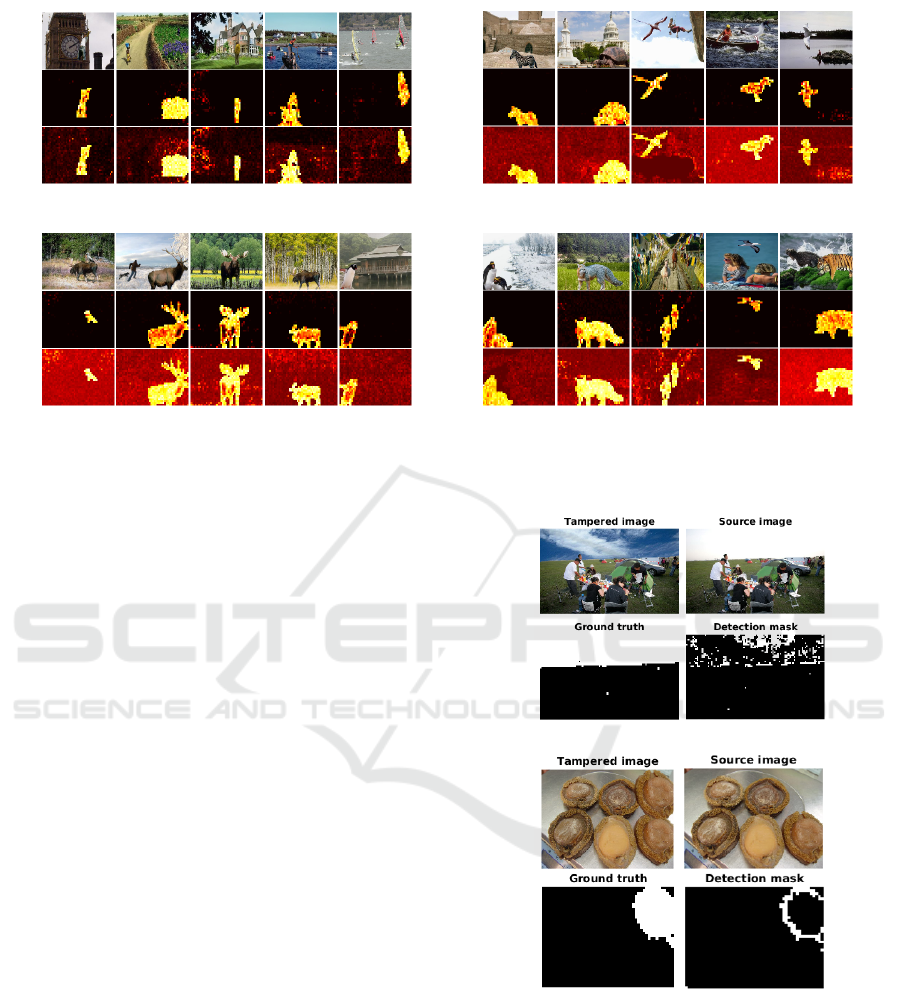
(set 1) (set 2)
(set 3) (set 4)
Figure 11: Forged images from CASIA (first row), result maps of the proposed method (middle row), and results given by
(Lin et al., 2009) (last row).
calize partially or entirely the forged region in 169
over 177 extracted images.
Figure 11 shows examples where we can detect
entirely the forged region of the image. The proposed
solution is compared with Lin et al.’s solution (Lin
et al., 2009). The proposed solution gives a detection
map much less noisy than the one given by (Lin et al.,
2009).
Figure 10 shows examples where we can de-
tect only a portion of forged region from the im-
age. Most of undetected forged blocks are situated
in homogeneous or saturated regions, where there is
not too much information, and they cannot be ex-
posed by the proposed solution, Figure 10a. For some
images, forged and unforged regions are previously
compressed under the same conditions, and the forged
region’s DCT grid matches correctly the one of the
rest of the image. Blocks within the forged region of
these images are undetected. However, forged the re-
gion in general is not created as a set of 8×8-blocks
but as a cluster of pixels. Therefore, blocks situated in
the boundaries of forged region can contain some pix-
els from the unforged one. This spatial combination
changes obviously the characteristics of DCT coeffi-
cients of these blocks, which makes them exposed un-
der the proposed detection method. When blocks on
the boundaries region are detected, the forged region
can also be detected and localized, see Figure 10b for
example.
(a)
(b)
Figure 10: Example of partial detection of forged region.
6 CONCLUSION
In this paper, by analyzing the characteristics of JPEG
compression in the DCT domain, we propose a new
and efficient histogram-based solution for estimating
the quantization steps utilized in the first compres-
sion of a double-compressed JPEG image. The pro-
An Image Forgery Detection Solution based on DCT Coefficient Analysis
493

posed solution performs precisely when the quantiza-
tion step used in the first compression is greater than
the double of the one used in the second compression.
We also propose a simple and fast solution for ex-
posing forgeries in compressed images. Given an im-
age, assuming that it is double-compressed, we try
to detect the quantization step used in the first com-
pression for all the DCT coefficients. Having the first
quantization step, we can create a model for the value
of the doubly quantized DCT coefficient. Blocks of
which the DCT coefficients do not follow the given
model are considered as forged. The proposed solu-
tion was tested on both simulated and real images.
Forged images created from JPEG images and re-
saved under high quality JPEG can be detected cor-
rectly, and forged region can be localized precisely
with the proposed method.
ACKNOWLEGDEMENT
This work was supported by ANR project DEFACTO
ANR-16-DEFA-0002.
REFERENCES
Bianchi, T. and Piva, A. (2012). Image forgery localization
via block-grained analysis of JPEG artifacts. IEEE
Transactions on Information Forensics and Security,
7(3):1003–1017.
Bunk, J., Bappy, J. H., Mohammed, T. M., Nataraj, L., Flen-
ner, A., Manjunath, B. S., Chandrasekaran, S., Roy-
Chowdhury, A. K., and Peterson, L. (2017). Detection
and localization of image forgeries using resampling
features and deep learning. arXiv:1707.00433 [cs].
D, R. P. and C, A. (2015). Image forgery detection using
SVM classifier. In 2015 International Conference on
Innovations in Information, Embedded and Commu-
nication Systems (ICIIECS), pages 1–5.
Dong, J., Wang, W., and Tan, T. CASIA image tampering
detection evaluation database. In 2013 IEEE China
Summit and International Conference on Signal and
Information Processing, pages 422–426.
Farid, H. (2009). Exposing digital forgeries from JPEG
ghosts. IEEE Transactions on Information Forensics
and Security, 4(1):154–160.
Gallagher, A. C. and Chen, T. (2008). Image authenti-
cation by detecting traces of demosaicing. In 2008
IEEE Computer Society Conference on Computer Vi-
sion and Pattern Recognition Workshops, pages 1–8.
Lin, Z., He, J., Tang, X., and Tang, C.-K. (2009). Fast,
automatic and fine-grained tampered JPEG image de-
tection via DCT coefficient analysis. Pattern Recog-
nition, 42(11):2492–2501.
Liu, B., Pun, C.-M., and Yuan, X.-C. (2014). Digital image
forgery detection using JPEG features and local noise
discrepancies. The Scientific World Journal, 2014.
Luo, W., Huang, J., and Qiu, G. (2010). JPEG error analysis
and its applications to digital image forensics. IEEE
Transactions on Information Forensics and Security,
5(3):480–491.
Mahdian, B. and Saic, S. (2008). Blind authentication
using periodic properties of interpolation. IEEE
Transactions on Information Forensics and Security,
3(3):529–538.
Mahdian, B. and Saic, S. (2009). Using noise inconsisten-
cies for blind image forensics. Image and Vision Com-
puting, 27(10):1497–1503.
Mohammed, T. M., Bunk, J., Nataraj, L., Bappy, J. H., Flen-
ner, A., Manjunath, B. S., Chandrasekaran, S., Roy-
Chowdhury, A. K., and Peterson, L. (2018). Boost-
ing image forgery detection using resampling detec-
tion and copy-move analysis. arXiv:1802.03154 [cs].
Pevny, T. and Fridrich, J. (2008). Detection of double-
compression in JPEG images for applications in
steganography. IEEE Transactions on Information
Forensics and Security, 3(2):247–258.
Popescu, A. C. and Farid, H. (2005). Exposing digital forg-
eries by detecting traces of resampling. IEEE Trans-
actions on Signal Processing, 53(2):758–767.
Thai, T. H., Cogranne, R., and Retraint, F. (2013). Ste-
ganalysis of jsteg algorithm based on a novel statis-
tical model of quantized DCT coefficients. In 2013
IEEE International Conference on Image Processing,
pages 4427–4431.
Thai, T. H., Cogranne, R., Retraint, F., and Doan, T.
N. C. (2017). JPEG quantization step estimation
and its applications to digital image forensics. IEEE
Transactions on Information Forensics and Security,
12(1):123–133.
Ting, Z. and Rangding, W. (2009). Doctored JPEG im-
age detection based on double compression features
analysis. In 2009 ISECS International Colloquium on
Computing, Communication, Control, and Manage-
ment, volume 2, pages 76–80.
Wang, W., Dong, J., and Tan, T. (2014). Exploring DCT
coefficient quantization effects for local tampering de-
tection. IEEE Transactions on Information Forensics
and Security, 9(10):1653–1666.
Yang, J., Xie, J., Zhu, G., Kwong, S., and Shi, Y. (2014).
An effective method for detecting double JPEG com-
pression with the same quantization matrix. IEEE
Transactions on Information Forensics and Security,
9(11):1933–1942.
Yang, Q., Peng, F., Li, J.-T., and Long, M. (2016). Im-
age tamper detection based on noise estimation and la-
cunarity texture. Multimedia Tools and Applications,
75(17):10201–10211.
Ye, S., Sun, Q., and Chang, E. (2007). Detecting digital im-
age forgeries by measuring inconsistencies of block-
ing artifact. In 2007 IEEE International Conference
on Multimedia and Expo, pages 12–15.
ICISSP 2019 - 5th International Conference on Information Systems Security and Privacy
494
