
Forecasting Hotel Room Sales within Online Travel Agencies by
Combining Multiple Feature Sets
Gizem Aras
1
, G
¨
uls¸ah Ayhan
1
, Mehmet Ali Sarikaya
1
, A. Aylin Tokuc¸
1
and C. Okan Sakar
2
1
Data Science Department, Cerebro Software Services Inc., Istanbul, Turkey
2
Computer Engineering Department, Bahc¸es¸ ehir University, Istanbul, Turkey
Keywords:
Sales Forecasting, Data Enrichment, XGboost, Online Travel Agency (OTA), Advanced Bookings Model.
Abstract:
Hotel Room Sales prediction using previous booking data is a prominent research topic for the online travel
agency (OTA) sector. Various approaches have been proposed to predict hotel room sales for different pre-
diction horizons, such as yearly demand or daily number of reservations. An OTA website includes offers of
many companies for the same hotel, and the position of the company’s offer in OTA website depends on the bid
amount given for each click by the company. Therefore, the accurate prediction of the sales amount for a given
bid is a crucial need in revenue and cost management for the companies in the sector. In this paper, we forecast
the next day’s sales amount in order to provide an estimate of daily revenue generated per hotel. An important
contribution of our study is to use an enriched dataset constructed by combining the most informative features
proposed in various related studies for hotel sales prediction. Moreover, we enrich this dataset with a set of
OTA specific features that possess information about the relative position of the company’s offers to that of its
competitors in a travel metasearch engine website. We provide a real application on the hotel room sales data
of a large OTA in Turkey. The comparative results show that enrichment of the input representation with the
OTA-specific additional features increases the generalization ability of the prediction models, and tree-based
boosting algorithms perform the best results on this task.
1 INTRODUCTION
A few decades ago, the idea of booking a hotel
just with a few clicks would have been unthinkable.
Nowadays, it is becoming the norm to make hotel
reservations online. According to an online travel
industry report from 2016, about 180 million peo-
ple visited online travel sites in a month that is a 27
percent increase from the year-earlier period (Nasr,
2015). This increase in online search for hotel reser-
vations reflects the growth of hotel bookings made
through online travel agencies (OTA). OTAs simplify
the process of searching and selecting hotel rooms
for consumers. Instead of going on a few individ-
ual hotel pages, people can go to OTA websites and
browse many hotels in a specific place for a specific
date at once. Due to the popularity of online re-
search, nowadays hotel marketers are very dependent
on OTAs. With the help of intermediary companies
such as booking.com, expedia.com, hostelworld.com,
and kayak.com, online hotel booking becomes widely
popular in the hospitality industry. This area is in re-
cent years for live practitioners and hotel marketing
of utmost importance due to the increasing share ob-
tained from these platforms.
The stochastic nature of hotel bookings (in terms
of metrics such as number of nights, number of
rooms, type of room, fare class.) needs to stochastic
programming and simulations. Despite the fact that
daily hotel booking predictions are more practical for
short-term cost calculations for players in the OTA in-
dustry, a realistic model for the market demand needs
to be more complex and should offer innovative and
differentiated solutions. Forecasting hotel room sales
has proven to be a challenging task because of the dy-
namics and complexity of the booking process. Book-
ings are influenced by many factors such as season-
ality, group bookings, events, hotel types, and hotel
properties. Capturing such factors properly is essen-
tial for the accuracy of the forecast.
In this paper, we propose a novel forecasting
framework on hotel room reservation that uses book-
ing data, hotel properties, and OTA information. Our
model is based on the comparison of various machine
learning models. As an application, we used 4-month-
long dataset collected by one of the largest OTAs in
Aras, G., Ayhan, G., Sarikaya, M., Tokuç, A. and Sakar, C.
Forecasting Hotel Room Sales within Online Travel Agencies by Combining Multiple Feature Sets.
DOI: 10.5220/0007383205650573
In Proceedings of the 8th International Conference on Pattern Recognition Applications and Methods (ICPRAM 2019), pages 565-573
ISBN: 978-989-758-351-3
Copyright
c
2019 by SCITEPRESS – Science and Technology Publications, Lda. All rights reserved
565

Turkey. The forecast is updated with daily incom-
ing booking information, and the model predicts the
bookings for the next day. Most existing work on
forecasting for OTAs use only a single point forecast
(past reservation information). Our work differs from
previous studies as we combine booking data, hotel
facility properties, hotel prices, and OTA report data
which includes information about the click, bid and
impression values for hotels. Our hypothesis was that
this enrichment would improve sales forecasting. The
model is used as a real application for daily booking
forecasting by a company that offers daily bids for
many hotels in a large OTA.
The rest of the paper is organized as follows: In
section II, a comprehensive literature review about
hotel sales prediction is given. In section III, the
methodology of the experiments is presented, and im-
plementation details of these methods are given in
section IV. Finally, in section V, conclusions and po-
tential future works are given.
2 LITERATURE REVIEW
Reviewing the literature, we observed that there are
different approaches for forecasting hotel room sales.
We present some of this work briefly in this section.
In a recent related study, Tse and Poon (Tse and Poon,
2015) used one year long reservation data provided
by Hotel ICON in Hong Kong. They observed certain
trends in data and developed a regression model us-
ing a second order equation. Their proposed system
predicts hotel reservations using reservation curves
from the past data. To predict a specific day’s reser-
vation, they use a 90-day window. Authors do daily
and weekly predictions, and observe that their model
performs better on weekly predictions. This result
makes sense, as daily changes in reservations smooth
out when looking at weekly cumulative data.
A study by Cezar and
¨
Og
¨
ut (Cezar and
¨
Og
¨
ut,
2016) examines the impact of consumer feedback,
suggestion systems and ranking on search listings for
hotels. For 1037 hotels in Paris and 540 hotels in
Barcelona; they collect data about the number of on-
line reservations, average hotel price per night, num-
ber of stars, number of customer comments, average
customer rating and supply, number of employees,
service, facility, cleanliness, comfort, money and lo-
cation. Their data range between April 2012 and June
2012 and is obtained from Booking.com. Authors use
two fractional models: a quasi-maximum likelihood
estimation model and a regression model with beta
distribution. They find that high ratings, high num-
ber of recommendations and high ranks in search list-
ings have a significant positive effect on conversion
rates. Furthermore, they observe that high number
of recommendations increases reservations even with
low ranks in search listings. Their findings show that
enriching data with recommendation or user-based-
ranking features can also be used to improve our
model’s performance as a future direction.
Ellero and Pelegrini (Ellero and Pellegrini, 2014)
assess the performance of different widely-adopted
models from literature to forecast Italian hotel oc-
cupancy. They find that exponential smoothing, ad-
vanced pick-up, and moving average models show
the best success in the compared models. They cre-
ate their models using historical data on occupancy
rates for five Italian hotels between 2007 and 2010.
Their studies conclude that even with the best models,
the predictions were unsatisfactory (average MAPE
of 20%). Their findings imply that hotel occupancy
prediction is a hard problem and that it may be diffi-
cult to get satisfactory results in this domain.
The demand for hotel rooms in the hotel industry
in Turkey between the years 2002-2013 is estimated
using ARIMA by Efendioglu and Bulkan in a recent
study (Efendio
˘
glu and Bulkan, 2017). In their studies,
they determine the hotel room capacity according to
the costs of the unsold rooms and the ARIMA distri-
bution. They also report that the hotel room demands
in the country could be affected by political crises and
warnings about terrorism. This result is another ex-
ample of the non-deterministic nature of hotel room
sales, as it shows how unpredictable factors can affect
the demand for hotels.
In another study, Shenoy et al.(Shenoy et al.,
2017) demonstrate their estimation of reservation in-
formation based on user activity and search results us-
ing the data provided by Expedia. Their studies show
that acquisition of significant results becomes possi-
ble through clustering and ensemble operations.
Lee(Lee, 2018) aims to predict the hotel room de-
mand using the basic characteristics of the reserva-
tion. This study examines the time varying demand
rates, the high variability in the recent demands and
the positive correlations between the demands at dif-
ferent time intervals. Three Poisson mixture mod-
els (Poisson, Negative Binomial, Negative Multino-
mial) are investigated to obtain the characteristics of
reservations. The study reports that the dynamic up-
dating method that utilizes inter-temporal correlations
significantly improves the short-term predictability of
hotel room demands.
Xie and Lee investigate the relationship between
search, click and reservation(Xie and Lee, 2015).
They use data obtained from 39,574 search queries
that include 81,648 distinct hotels. Their data comes
ICPRAM 2019 - 8th International Conference on Pattern Recognition Applications and Methods
566

from Expedia, which is a major online travel agency
(OTA) website. The study shows that ranking high in
hotel features (search results - position, quality indi-
cators, incentives, and brand link) improves bookings
significantly.
3 DATA PREPARATION
3.1 Dataset Descriptions
In this section, we describe the dataset used to con-
struct our model. We worked with Company X, an
OTA that sells hotels online. Company X sells ho-
tels through a travel metasearch engine as well as
other channels. We built our sales model to predict
sales that company X would do through this travel
metasearch engine. Our datasets were provided by
Company X and daily predictions of our model were
shared with Company X. From hereafter, we refer to
company X as the OTA and the intermediary OTA
website that Company X was using as a channel to sell
its hotels as the travel metasearch engine. Features
were chosen from the datasets based on their correla-
tions with the target variable, and according to their
importance in a simple regression. Then, additional
features were extracted from these columns following
a time-delay approach.
The first dataset contains sales-related information
about the hotels. This dataset can be distinguished
from the other datasets as it has the target variable of
the model, so called the ‘net total cost’. The features
extracted from the provided raw dataset can be seen
in Table 1.
Table 1: The descriptions of features obtained from reser-
vation data of company X.
Feature Description Range
Total
night
The staying total night of a
hotel
(1,542)
Total
rooms
The purchasing total rooms of
a hotel
(1,60)
Person
The number of person who stays
in a hotel
(1,98)
Net
total cost
The net sale amount of a hotel
in terms of Turkish Liras
(0,3608.08)
Count pre
The number of
pre-reservations made for a hotel
(0,16)
Count exacts
The number of
definite reservations made for a hotel
(1,44)
Count cancels
The number of
cancelled reservations made for a hotel.
(0,9)
The first dataset is enriched with the report dataset
which is provided by the travel metasearch engine
to each company that gives daily bids in order to be
demonstrated online in the travel metasearch engine
website. The daily report gives information about
how the OTA is performing in terms of appearing in
search results and getting bookings, based on the bid
OTA gives per hotel. The features of the report dataset
consist of clicks, bid, average booking value, gross
revenue, top position share, hotel impression, oppor-
tunity cost per click, region, stars, rating and hotel
types. These features are listed in Table 2 along with
their descriptions. Some of these features, such as
the number of clicks received per hotel or how much
bid is needed to guarantee the first position are on-
line evaluation metrics that are commonly used in e-
commerce.
Table 2: The descriptions of features obtained from daily
report provided by the travel metasearch engine.
Feature Description Range
Clicks
The daily amount of clicks
received for a hotel
in the metasearch engine.
(0,1618)
Bid
Given bid from OTA
to travel metasearch engine
(0.009, 0.56)
Average booking value
The given value of each hotel
regarding their bookings
by travel metasearch engine
(0, 131534)
Gross Revenue
The obtained gross revenue of hotels
in terms of Turkish Liras
(0, 131534)
Top position share
The ratio of being in the first position
of a hotel
(0,1)
Hotel impression
Number
of daily pageviews of a hotel
(0,28418)
Opportunity Cost
Per Click
The bid amount recommended
by the travel metasearch engine
to appear first on hotel listings.
(0,1)
Cost Total cost per click of a hotel. (0,244.63)
Region The region where the hotel is located.
7 Class
Categorical values
Stars The star number of a hotel. (0,5)
Rating
The rating of a hotel given
by the travel metasearch engine’s users
(0,96.17)
Hotel Types
The binary variable that indicates
if a hotel is a summer or winter hotel.
2 Class
Categorical Values
The third dataset provided by the OTA includes
price and position information of all the companies
offering in travel metasearch engine along with their
hotel Ids’, starting date of reservation and ending date
of reservation. The bulk features of the data given
by OTA can be seen in Table 3. As there are many
companies that give offers in the metasearch engine,
we organized this data and extracted the daily prices
and the daily positions of each hotel offered by our
OTA. Besides, the minimum price of a hotel in the
travel metasearch website and the minimum price of
a hotel which is in the top 4 online demonstrated or-
der was taken regardless of which company made the
offer. Here we took top 4, as the travel metasearch
website shows prices for four hotels initially. In this
Forecasting Hotel Room Sales within Online Travel Agencies by Combining Multiple Feature Sets
567

way, we had the knowledge of competitor companies’
prices for the hotels that OTA offers in that partic-
ular day. We summarized the information from this
dataset with the following columns; my price, my po-
sition, top4 min price and total min price. The created
features from price and position data are given in Ta-
ble 4.
Table 3: The descriptions of features obtained from the
price and position data.
Feature Description Range
Price Price of a hotel (26, 57399)
Position
The display ranking of a hotel
in the travel metasearch website
(1, 244)
Table 4: The descriptions of features enriched from price
and position data.
Feature Description Range
My price
The price of a hotel which OTA offers.
(30, 27037)
My position
The position of the OTA’s hotel on the
metasearch engine listings.
(1, 200)
Total min price
Minimum price of a hotel
offered by any company
in the metasearch engine listings.
(28, 27037)
Top 4 min price
Minimum price of a hotel
belonging to the top 4 position
demonstrated in travel metasearch website.
(28, 24094)
Finally, the fourth dataset used to construct the
model is called the facility dataset. It contains a set
of features that determine the success of the hotels re-
garding some evaluation criteria. The features with
their descriptions from this dataset can be seen in Ta-
ble 5.
Table 5: The descriptions of features obtained from facility
dataset.
Feature Descriptions Range
Score Online Reputation (-110, 5780)
Survey Score Customer Satisfaction (0,100)
Total Points Total of The Scores (0,316)
Total Votes Total Votes by The Public (0,4)
3.2 Preprocessing
After collecting data under the four subsets mentioned
above, a combining process was required. While the
reservation dataset includes only the hotels that were
selling, the other three datasets contain all hotels of
the OTA that are displayed in the travel metasearch
engine. Therefore, merging these four subsets re-
sulted in a final dataset containing 375000 rows with
91% of target variable being 0. This meant there were
not confirmed reservations for 91% of data that came
from daily metasearch engine report dataset.
Considering that we need to predict the next day’s
sales amount, the sliding window approach could
be applied to construct a time-delay based machine
learning model. For this purpose, additional features
that are able to capture the temporal aspects were cre-
ated. These features are obtained by computing the
moving averages and standard deviations of 3, 7, 15,
30 and 45 days of the original features. Furthermore,
daily sliding windows approach was implemented for
only the features which were correlated with the tar-
get variable. The most correlated feature to the target
variable was the target variable itself, as represented
in the past days’ sliding windows columns. Findings
support the fact that total nights and rooms are di-
rectly related to sales amount. These features were
adjusted as sliding windows parameters and the val-
ues were added as columns to the dataset from the day
before the current day to eleven days before the cur-
rent day. In order to acquire the optimal window size
in terms of days, we observed different sizes in the
data along with XGBoost Cross Validation algorithm
and deduced the optimal size as 10. The obtained re-
sults can be seen in Fig. 1. Hence, 10 days for each
daily prediction of each hotel is used to capture sea-
sonal trends. Additional features were added to the
dataset with their 10 days daily moving values. These
features are 10 days daily sliding values of opportu-
nity cost per click, clicks, average booking value, bid,
cost, gross revenue, and person, i.e., number of people
who stayed in the hotel, respectively. Besides, profit
value was calculated by subtracting the multiplication
of bid and clicks from the net total cost. The moving
sums of tracking 3, 7, 15, 30, 45 days are integrated
into the dataset. Sliding operation implemented based
on correlations is shown in Fig. 2.
0.60
0.58
0.56
0.54
RSQ
Window Size
2
5
7 10
12
Window Size
2
5
7 10
12
2000
1900
1800
1700
MSE
1600
Figure 1: Window size effect on XGboost Cross Validation.
Moreover, we were able to obtain the number of
definite reservations, pre-reservations and canceled
reservations from the reservation data. These counts
were added to data with their moving averages and
standard deviations in 3, 7, 15, 30 and 45 days peri-
ICPRAM 2019 - 8th International Conference on Pattern Recognition Applications and Methods
568

ods. Since the dependency of definite reservations in
sales amount was higher than the other types of reser-
vations, daily sliding values of definite reservations
were also added to the dataset.
In addition to these features, as the target variable
had a high amount of zeros, we inserted a new fea-
ture representing the number of days the hotel has
not been sold in a specific period. Thus, we aim to
improve the success of the model in distinguishing
the selling and non-selling hotels. Apart from these,
the cumulative sums of net total cost, total night, to-
tal rooms, my price, total min-price, clicks, hotel im-
pression, and the number of different types of reser-
vations, which are definite, pre, and canceled, were
added to the dataset.
Last but not least, some features related to date
considered to be important in online travel agencies
sector were integrated to the model. These were the
day information, the number of days left to the clos-
est public holiday and the length of the closest holiday
in terms of days. Hence, all the columns were deter-
mined and the enriched dataset was obtained. Yet,
the dataset required additional pre-processing steps to
handle with missing and categorical values. Missing
values of features other than standard deviation fea-
tures were filled with 0’s. The missing values in the
standard deviation columns were filled with average
values of the related column.
Another pre-processing operation applied on the
dataset is to encode the categorical features using one-
hot-encoding. Once we completed the pre-processing
steps, the features that belong to time t + 1 (next day),
for which sales prediction will be made have been ex-
tracted from the dataset to avoid bias about the sales
value at time t + 1 which is the target variable of the
regression problem. After all these steps, the enriched
dataset was obtained which contains 375000 rows and
315 columns belonging to the dates between 1 Febru-
ary 2018 and 1 July 2018.
4 MODELLING
Sales prediction is a regression problem in which the
sales amount of each hotel for the next day is aimed
to be predicted. As described in the previous section,
hotel reservation data has high variance. There ex-
ists seasonal trends, weekly trends, different patterns
for summer and city hotels, increases in bookings in-
dependent of seasonal trends due to marketing strate-
gies, etc. Furthermore, approximately a third of all
reservations get canceled. Due to this high variance
in data, we focused on non-linear prediction methods
and creating relevant features with a time-delay data
pre-processing approach.
During modelling, we used train/test split cross-
validation approach for model training and valida-
tion. We created training and test sets by includ-
ing 66% of data belonging to hotel in the training
set and 33% in the test set, in order to have sam-
ples from each hotel in the training set. We did 5-
fold cross-validated (again, hotel-based random split)
random search (Bergstra and Bengio, 2012) to tune
the hyper-parameters using a part of the training set
as validation set. Three different evaluation metrics
were used; R Squared (RSQ or coefficient of determi-
nation), Root Mean Square Error (RMSE) and Mean
Absolute Error (MAE). We considered all of these
three evaluation metrics to determine the best model.
RSQ is a well-known evaluation metric used in re-
gression problems, and it is defined as the propor-
tion of the variance in the target variable that is pre-
dictable from the explanatory variables. It measures
the goodness of fit of prediction values to the real val-
ues. RMSE is the standard deviation of the actual
target variable from the predicted target variable. It
measures the error between the set of observed and
predicted values. MAE is another error metric used
in regression problems which measures the average
magnitude of the error between the set of actual and
predicted target values.
We have used a different type of non-parametric
machine learning algorithms to validate the contribu-
tion of the data-enrichment process in sales predic-
tion. One of these approaches is the tree-based al-
gorithms which combine multiple weak learners to
obtain a single generalizable model. Extreme gradi-
ent boosting (XGBoost) (Chen and Guestrin, 2016)
is a technique that recently became popular among
data scientists, based on its popularity on many ma-
chine learning challenges (Mangal and Kumar, 2016;
Hengl et al., 2017; Zhou and Feng, 2017). Gradi-
ent boosting combines the gradient descent algorithm
with boosting to minimize overfitting when creating
ensembles of trees. In XGBoost (Chen and Guestrin,
2016), there are additional regularization parameters
that control the size and shape of trees, which makes
predictions more robust and the algorithm more gen-
erally applicable. Finally, random forest, gradient
boosting, and extreme gradient-boosting (XGBoost)
algorithms from tree-based algorithms were chosen
to be applied in our study, as they have been shown
to perform high accuracies on various regression tasks
(Breiman, 2001; Geurts et al., 2006; Friedman, 2001).
In addition to the above-mentioned tree-based al-
gorithms, we have also used a deep neural network
which has more than one hidden layer to cope with the
highly complex nature of the underlying model. Each
Forecasting Hotel Room Sales within Online Travel Agencies by Combining Multiple Feature Sets
569
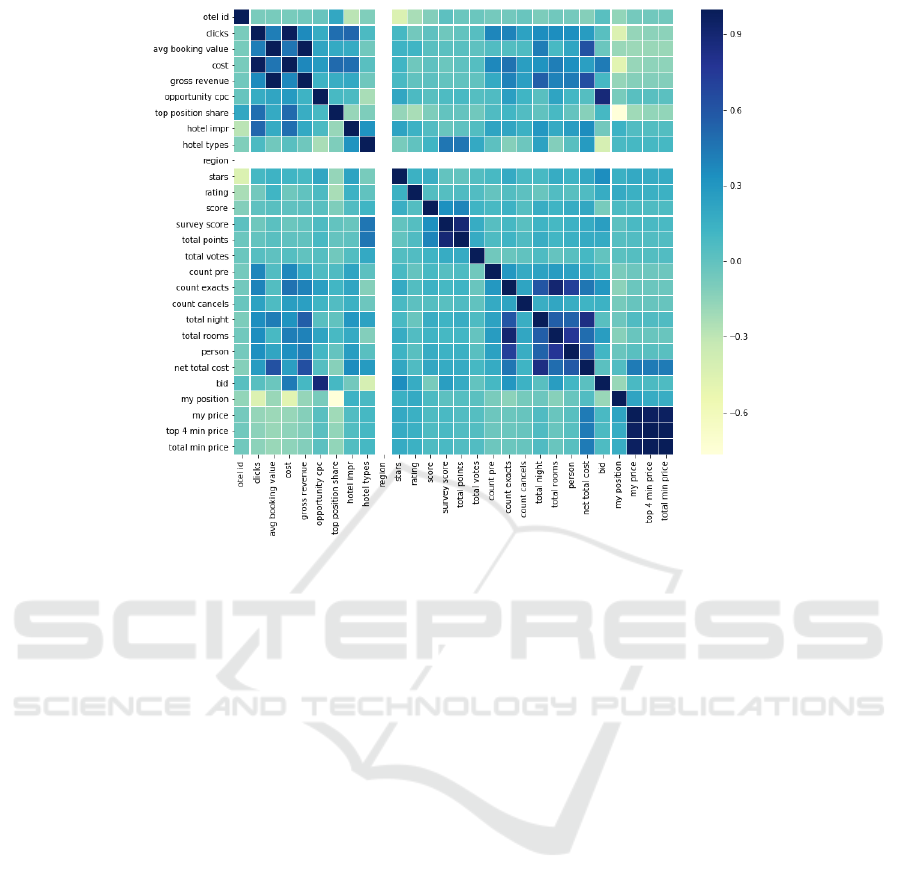
Figure 2: Correlation Matrix.
hidden layer in the deep neural network increases
both the selectivity and the invariance of the repre-
sentation. A deep neural network system can imple-
ment extremely intricate functions of its inputs that
are simultaneously sensitive for correlations and in-
sensitive to large irrelevant variations(Candel et al.,
2016). We have also applied a generalized linear
model (GLM) as a simpler baseline model. GLM is
a generalization of standard linear regression used to
predict responses both for dependent variables with
discrete distributions and for those which are nonlin-
early related to the predictors(Nykodym et al., 2016).
The results obtained with XGBoost, random forest,
gradient boosting, deep neural network and general-
ized linear model algorithms are presented in the next
section.
4.1 Environment Settings
All experiments were ran on a remote Linux (Ubuntu
17.10) server with 32-seed CPU. Algorithms were im-
plemented using open source libraries. The XGBoost
algorithm was used in Python with its Scikit-Learn
wrapping (Chen and Guestrin, 2016). H2O (H2O.ai,
2018) implementations of gradient boosting, random
forest, deep neural network, and generalized linear
model algorithms were used in R. The H2O web in-
terface was used from 54321 port of localhost once it
was initialized.
5 RESULTS & DISCUSSION
The most successful model obtained from reservation
dataset was gradient boosting as seen in Tables 6 and
8. On the other hand, XGBoost gave the highest RSQ
in the enriched dataset both on validation and test sets
(see Tables 7 and 9). In the reservation dataset, the
difference between the top two performing models is
not significant, as ranking of the models differ when
different evaluation metrics are used. Similarly, in
the enriched dataset, r-squared errors of the top three
models cover each others’ ranges. Therefore, it is
difficult to conclude that one model performs signifi-
cantly better than the other ones. We should also note
that as seen in 8 the tree-based models performed bet-
ter than generalized linear and deep neural network
models on the enriched dataset. We should note that
different platforms were used to train different mod-
els. For instance, gradient boosting model was taken
from the H2O Library, and implemented in R. H2O
also had its own implementation of XGBoost, but we
preferred to use the native library in Python. Having
tried these models in other platforms might have lead
to slightly different results but not significant changes.
The obtained results show that the machine learn-
ing algorithm performs better on the enriched dataset.
It is seen in Table 9 that the RSQ obtained with XG-
Boost increased from 0.269 to 0.574 on the test set,
a difference of 0.305. In cross validation results, the
ICPRAM 2019 - 8th International Conference on Pattern Recognition Applications and Methods
570
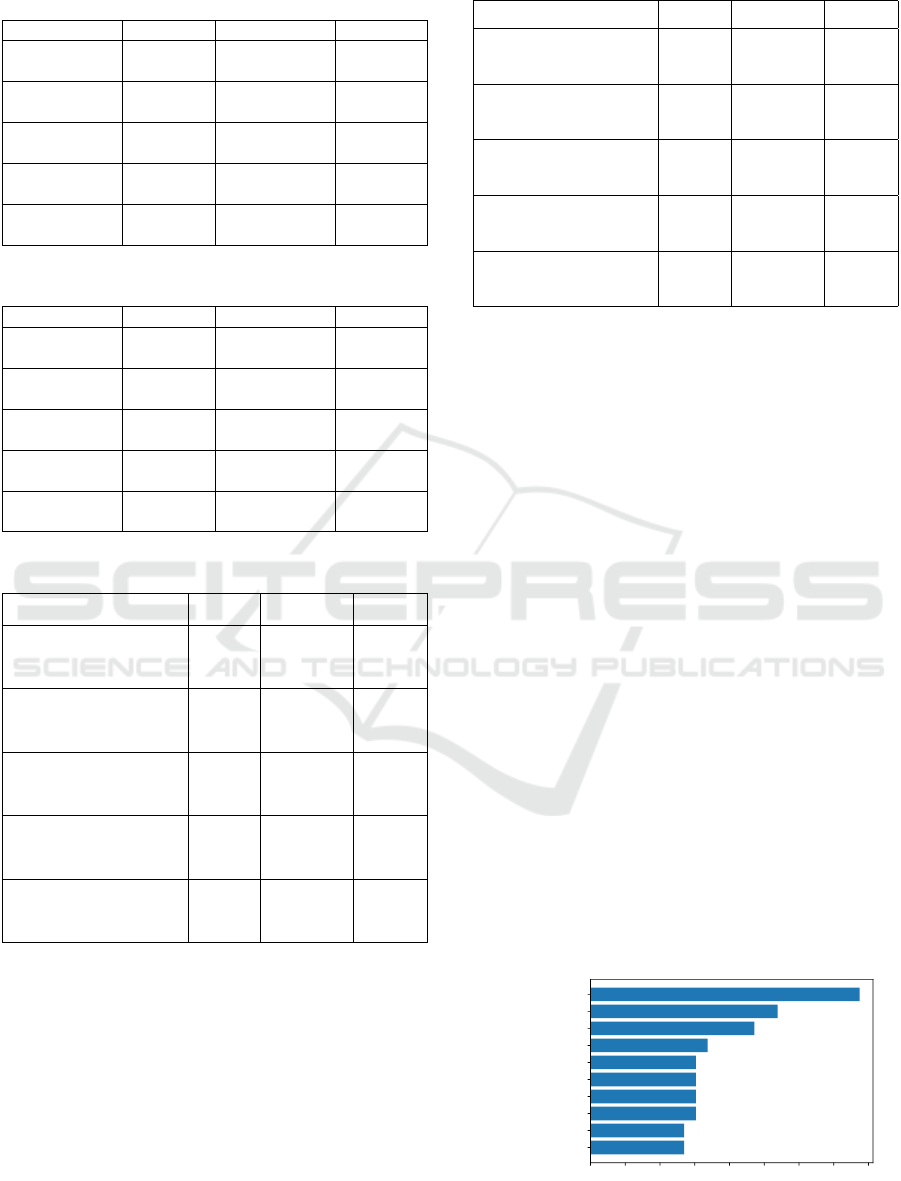
Table 6: Cross Validation Results for the Reservation
Dataset.
Model RSQ MSE MAE
eXtreme Gradient
Boosting
0.254 +/- 0.03 3612.53 +/- 158.11 20.15 +/- 0.48
Gradient Boosting
Machines
0.279 +/- 0.04 3492.20 +/- 173.91 20.06 +/- 0.47
Random
Forest
0.288 +/- 0.02 3737.91 +/- 400.93 20.44 +/- 0.44
Generalized Linear
Models
0.310 +/- 0.05 3618.99 +/- 240.44 19.82 +/- 0.25
Deep Neural
Network
0.286 +/- 0.06 3754.95 +/- 450.36 19.90 +/- 1.37
Table 7: Cross Validation Results for the Enriched Dataset.
Model RSQ MSE MAE
eXtreme Gradient
Boosting
0.611 +/- 0.02 1600.18 +/- 251.76 8.70 +/- 0.29
Gradient Boosting
Machines
0.585 +/- 0.03 2088.96 +/- 413.94 9.42 +/- 0.39
Random
Forest
0.582 +/- 0.02 2105.95 +/- 245.94 9.42 +/- 0.15
Generalized Linear
Models
0.450 +/- 0.04 2754.66 +/- 133.55 16.16 +/- 0.38
Deep Neural
Network
0.517 +/- 0.04 2426.38 +/- 248.03 14.86 +/- 1.20
Table 8: Test Results for the Reservation Dataset.
Model RSQ MSE MAE
eXtreme Gradient
Boosting
0.269 3884.67 19.83
Gradient Boosting
Machines
0.280 3827.25 19.91
Random
Forest
0.203 3571.57 20.17
Generalized Linear
Models
0.238 3415.74 19.60
Deep Neural
Network
0.216 3516.00 20.38
difference was even slightly larger: 0.357. These re-
sults show that the additional features integrated dur-
ing data preparation step detailed in Section 3.1 carry
important information in capturing the trend observed
in the net total cost. Fig. 3 shows the top ten features
ranked according to their feature importance level in
XGBoost model. Feature importance in this graph are
calculated using the average coverage of splits, which
is defined as the number of samples affected by the
split (xgboost developers, 2018). As seen in Fig. 3,
three of the top ten features are not from the initial
Table 9: Test Results for the Enriched Dataset.
Model RSQ MSE MAE
eXtreme Gradient
Boosting
0.574 2267.02 9.45
Gradient Boosting
Machines
0.564 2159.98 9.54
Random
Forest
0.572 2121.13 9.40
Generalized Linear
Models
0.443 2760.80 16.18
Deep Neural
Network
0.507 2442.98 15.15
reservation dataset. The gross revenue and profit re-
lated features were obtained from the OTA’s report
dataset. Net total cost is actually the daily revenue
generated per hotel by company X. So, the actual rev-
enue is naturally related to profit and gross revenue
values calculated in the OTA’s report. The important
features that are from the reservation dataset represent
information about past net total costs and bookings.
From this observation, we can suggest that with ap-
propriate representation of past information, it is pos-
sible to capture relevant trends, even in hotel bookings
data, which has notably high variability and noise.
The actual and predicted plots of the target vari-
able (net total cost) can be seen in Figure 4. It is
observed that the actual net total costs with compara-
bly lower values are predicted better as they accumu-
lated a relatively narrow range around the line. Since
there are slightly more points under the line than the
above, it is seen that the predictions generated by the
model are lower than the actual values. The sales
amounts higher than 1000 can be considered as the
minority group in data, and the predictions are be-
coming less accurate after this point. Furthermore,
the sales amount after 1500-2000 range can be inter-
preted as outliers for our dataset, and it can be seen
that the model does not produce accurate predictions
for values around this range.
0.000 0.005 0.010 0.015 0.020 0.025 0.030 0.035 0.040
net_total_cost_5
total_night_3
avg_45_net_total_cost
cnt_2_30
profit_all
profit_30days
net_total_cost_3
cnt_2_3
stdev_30_gross_rev
net_total_cost_1
Figure 3: Top 10 Features from Extreme Gradient Boosting
Model with the Enriched Dataset.
Forecasting Hotel Room Sales within Online Travel Agencies by Combining Multiple Feature Sets
571
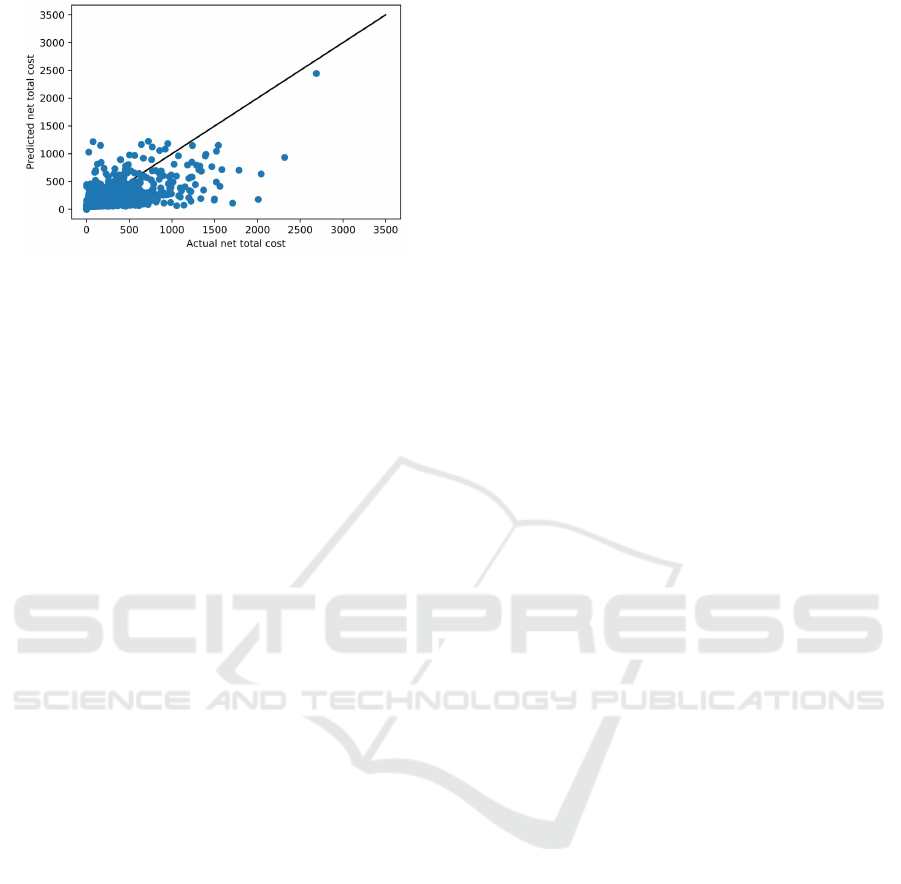
Figure 4: XGboost Model’s Predictions Plotted Against
Real Sales.
6 CONCLUSION & FUTURE
WORK
In this study, we investigated the performance of some
machine learning techniques on a baseline and en-
riched dataset hotel sales prediction. For this pur-
pose, different prediction algorithms including Gra-
dient boosting, XGboost, random forest, generalized
linear model and deep neural network were applied to
predict next day’s sales using the historical data. The
obtained results demonstrated that feature enrichment
was crucial for solving the complex problem of hotel
sales prediction. Compared to the studies in litera-
ture, the nature of our problem was different. To the
best of our knowledge, our study is the first one that
aims to predict net total cost in the future, which is
a real value related to price for hotel sales. We im-
proved our models by using features that can sum-
marize the trends in the target variable well. The re-
sults also showed that algorithms that used ensembles
of trees, especially boosting algorithms, overwhelmed
other methods. We should also note that boosting al-
gorithms i.e., XGboost and gradient boosting, gave
comparable results.
In future work, data can be enriched further
by adding consumer-generated recommendation and
comments data. Some studies in the literature showed
that consumer-generated ratings and the number of
recommendations are important features for hotel
reservations (e.g., (Cezar and
¨
Og
¨
ut, 2016)). We can
integrate this information into our prediction frame-
work to obtain more generalizable models. For this
purpose, natural language processing techniques such
as sentiment analysis can be used to extract features
from consumer-generated text data and the summa-
rized information obtained from this module can be
combined with the features used in this study.
REFERENCES
Bergstra, J. and Bengio, Y. (2012). Random search for
hyper-parameter optimization. Journal of Machine
Learning Research, 13(Feb):281–305.
Breiman, L. (2001). Random forests. Machine learning,
45(1):5–32.
Candel, A., Parmar, V., LeDell, E., and Arora, A. (2016).
Deep learning with h2o. H2O. ai Inc.
Cezar, A. and
¨
Og
¨
ut, H. (2016). Analyzing conversion
rates in online hotel booking: the role of customer
reviews, recommendations and rank order in search
listings. International Journal of Contemporary Hos-
pitality Management, 28(2):286–304.
Chen, T. and Guestrin, C. (2016). Xgboost: A scalable
tree boosting system. In Proceedings of the 22nd acm
sigkdd international conference on knowledge discov-
ery and data mining, pages 785–794. ACM.
Efendio
˘
glu, D. and Bulkan, S. (2017). Capacity manage-
ment in hotel industry for turkey. In Handbook of
Research on Holistic Optimization Techniques in the
Hospitality, Tourism, and Travel Industry, pages 286–
304. IGI Global.
Ellero, A. and Pellegrini, P. (2014). Are traditional forecast-
ing models suitable for hotels in italian cities? Inter-
national Journal of Contemporary Hospitality Man-
agement, 26(3):383–400.
Friedman, J. H. (2001). Greedy function approximation: a
gradient boosting machine. Annals of statistics, pages
1189–1232.
Geurts, P., Ernst, D., and Wehenkel, L. (2006). Extremely
randomized trees. Machine learning, 63(1):3–42.
H2O.ai (2018). R Interface for H2O. version 3.20.0.3.
Hengl, T., de Jesus, J. M., Heuvelink, G. B., Gonzalez,
M. R., Kilibarda, M., Blagoti
´
c, A., Shangguan, W.,
Wright, M. N., Geng, X., Bauer-Marschallinger, B.,
et al. (2017). Soilgrids250m: Global gridded soil
information based on machine learning. PLoS one,
12(2):e0169748.
Lee, M. (2018). Modeling and forecasting hotel room de-
mand based on advance booking information. Tourism
Management, 66:62–71.
Mangal, A. and Kumar, N. (2016). Using big data to en-
hance the bosch production line performance: A kag-
gle challenge. In Big Data (Big Data), 2016 IEEE In-
ternational Conference on, pages 2029–2035. IEEE.
Nasr, R. (2015). Online travel industry is booming: Report.
Retrieved July, 6:2016.
Nykodym, T., Kraljevic, T., Hussami, N., Rao, A., and
Wang, A. (2016). Generalized linear modeling with
h2o. Published by H2O. ai, Inc.
Shenoy, G. G., Wagle, M. A., and Shaikh, A. (2017).
Kaggle competition: Expedia hotel recommendations.
arXiv preprint arXiv:1703.02915.
Tse, T. S. M. and Poon, Y. T. (2015). Analyzing the use of
an advance booking curve in forecasting hotel reser-
vations. Journal of Travel & Tourism Marketing,
32(7):852–869.
xgboost developers (2018). Python API Reference for XG-
Boost.
ICPRAM 2019 - 8th International Conference on Pattern Recognition Applications and Methods
572

Xie, K. and Lee, Y.-J. (2015). Hotels at our fingertips: Un-
derstanding consumer conversion from search, click-
through, to book.
Zhou, Z.-H. and Feng, J. (2017). Deep forest: Towards an
alternative to deep neural networks. arXiv preprint
arXiv:1702.08835.
Forecasting Hotel Room Sales within Online Travel Agencies by Combining Multiple Feature Sets
573
