
Pedestrian Similarity Extraction to Improve People Counting
Accuracy
Xu Yang
1
, Jose Gaspar
1
, Wei Ke
1
, Chan Tong Lam
1
, Yanwei Zheng
2
, Weng Hong Lou
1
and
Yapeng Wang
3
1
School of Public Administration, Macao Polytechnic Institute, Macao S.A.R, China
2
Beihang University, China
3
Information Systems Research Centre, Macao Polytechnic Institute, Macao S.A.R, China
Keywords: Pedestrian Detection and Counting, Pedestrian Similarity Extraction, Non-Maxima Suppression (NMS),
Yolo, Convolutional Neural Networks (CNN).
Abstract: Current state-of-the-art single shot object detection pipelines, composed by an object detector such as Yolo,
generate multiple detections for each object, requiring a post-processing Non-Maxima Suppression (NMS)
algorithm to remove redundant detections. However, this pipeline struggles to achieve high accuracy,
particularly in object counting applications, due to a trade-off between precision and recall rates. A higher
NMS threshold results in fewer detections suppressed and, consequently, in a higher recall rate, as well as
lower precision and accuracy. In this paper, we have explored a new pedestrian detection pipeline which is
more flexible, able to adapt to different scenarios and with improved precision and accuracy. A higher NMS
threshold is used to retain all true detections and achieve a high recall rate for different scenarios, and a
Pedestrian Similarity Extraction (PSE) algorithm is used to remove redundant detentions, consequently
improving counting accuracy. The PSE algorithm significantly reduces the detection accuracy volatility and
its dependency on NMS thresholds, improving the mean detection accuracy for different input datasets.
1 INTRODUCTION
Real-time pedestrian detection and counting, which
detects and instantly counts the number of people in
a designated area, is highly valuable and helpful in
managing emergency situations, providing efficient
resource allocation in smart buildings, and enabling
automatic door control (Raghavachari et al., 2015).
The solution for this problem largely relies on
detection accuracy and processing speed, both
equally important factors for real-time applications.
Vision-based pedestrian detection, as one
canonical instance of object detection, has been
widely studied using multiple techniques. The most
widely mentioned approaches include Histogram of
Oriented Gradients (HOG) (Dalal and Triggs, 2005),
Aggregated Channel Features (ACF) (Dollar et al.,
2014), and other approaches, based on Convolutional
Neural Networks (CNN), such as Faster Region-
based Convolutional Network (Faster R-CNN) (He et
al., 2016) (Dollar et al., 2014), Single Shot MultiBox
Detector (SSD) (Liu et al., 2016), and You Only Look
Once (Yolo, Yolo2, Yolo3) (Redmon et al., 2016).
The comparative study in (Raghavachari et al.,
2015) shows that ACF achieves a better detection
accuracy than HOG based approach. Moreover, the
research in (Byeon and Kwak, 2017) shows that
Faster R-CNN has much better accuracy than ACF in
vehicle driving environments. Again, comparisons in
(Redmon et al., 2016) show that Yolo family of
detectors outperform Fast R-CNN and SSD detectors
in both speed and accuracy, making it a state-of-the-
art detector on PASCAL VOC and Microsoft COCO
public datasets. Yolo uses a single deep neural
network to predict bounding boxes and class
probability scores of detected objects directly from
full images, in a single evaluation. However, it often
generates redundant object detections, resulting in
inaccurate counting, seriously compromising the
accuracy of pedestrian counting systems where
exactly one detection per pedestrian is required.
The vast majority of modern object detectors,
such as Yolo and Fast R-CNN, require a post-
processing Non-Maxima Suppression (NMS)
(Devernay, 1995) algorithm to merge all detections
belonging to the same object (Hosang et al., 2017)
548
Yang, X., Gaspar, J., Ke, W., Lam, C., Zheng, Y., Lou, W. and Wang, Y.
Pedestrian Similarity Extraction to Improve People Counting Accuracy.
DOI: 10.5220/0007381605480555
In Proceedings of the 8th International Conference on Pattern Recognition Applications and Methods (ICPRAM 2019), pages 548-555
ISBN: 978-989-758-351-3
Copyright
c
2019 by SCITEPRESS – Science and Technology Publications, Lda. All rights reserved

(Hosang et al., 2016). This algorithm is very popular
due to its simplicity and performance. However, the
output of this detection pipeline is still not accurate
due to NMS’s conceptual shortcomings.
In standard NMS, if the NMS threshold is too low,
multiple true positive detections are merged together,
penalizing the recall rate. On the other hand, if the
NMS threshold is too high, false positive redundant
detections may not be suppressed, hurting the
precision. Additionally, a pre-fixed NMS threshold is
not suitable for all different scenarios such as densely
crowded or sparse environments.
In this paper we developed a Pedestrian Similarity
Extraction (PSE) algorithm which can be added to the
final stage of the current pedestrian detection pipeline
to achieve higher precision and accuracy. The PSE
algorithm uses a CNN, inspired in Google’s Inception
v3 (Szegedy et al., 2016), to learn 128 distinguishable
features which may differentiate pedestrians, making
it appropriate to remove redundant detections and
output exactly one bounding box per pedestrian.
Resulting feature vectors of each pair of detections
are compared using a cosine similarity distance
metric to determine the similarity score. If the
similarity score is over a pre-fixed PSE threshold, the
detections likely correspond to the same pedestrian
and the lowest score detection is removed from the
final output, increasing precision and accuracy rates.
In the newly proposed pedestrian detection three-
stage (detector + NMS + PSE) pipeline, the NMS
algorithm, pre-fixed with a high threshold, is still
required, as it is able to quickly remove most close-
by redundant detections. Then, PSE performs an
additional comparison to remove detections with high
similarity scores corresponding to the same object.
This new pipeline delivers additional flexibility when
compared with the current standard Yolo2 pipeline.
The experiments demonstrated in this paper
showed that, when compared with the current Yolo2
detection pipeline, our approach can promisingly
improve the precision and accuracy in pedestrian
detection and counting systems. In addition, it
reduces the volatility across a full range of pre-fixed
NMS thresholds, resulting in accurate and stable
performance in different scenarios.
2 LIMITATION OF STANDARD
DETECTION PIPELINE ON
PEDESTRIAN COUNTING
Yolo family of detectors have evolved from Yolo
(Redmon et al., 2016), to Yolo2/9000 (Redmon and
Farhadi, 2016), and, most recently, to Yolo3
(Redmon and Farhadi, 2018). In Yolo3 paper,
Redmon and Farhadi pointed out that Yolo3 struggles
to get bounding boxes perfectly aligned with objects
and has comparatively worse accuracy on medium
and larger size objects compared with previous
versions, which negatively impacts the detection and
counting. Therefore, in this work we use Yolo2
detector to demonstrate the detection accuracy of the
new pipeline for detection and counting.
Yolo2 is a fast and accurate, state-of-the-art,
single shot object detector with real-time
performance. Yolo2 algorithm is able to detect 20
classes of objects when trained with a PASCAL VOC
dataset (Everingham et al., 2010). The network
classifies and locates objects in a single image scan,
making it extremely fast and suitable for real-time
pedestrian detection without compromising accuracy.
As a consequence of Yolo2 object detection
process, multiple bounding boxes may be generated
for each detected object, as shown in Figure 1(b).
Thus, a post-processing Non-Maxima Suppression
(NMS) (Devernay, 1995) algorithm is added as an
integral part of the object detection pipeline to
remove redundant spatial overlapping bounding
boxes, as illustrated in Figure 1(c).
The NMS algorithm selects all pairwise
combinations of detected bounding boxes with a
spatial overlapping ratio Intersection over Union
(IoU) (Equation (1)), equal or higher than a pre-fixed
threshold. Finally, the NMS removes the lowest score
bounding box among each pair of selected boxes.
(1)
where b
p
is the predicted bounding box and b
t
is the
ground truth bounding box.
The NMS algorithm removes most redundant
detections but trades off precision versus recall rates
(Hosang et al., 2016). Low NMS thresholds may
merge true positive detections and penalize the recall
rate, whereas high NMS thresholds may not suppress
false positive redundant detections and hurt the
precision, as shown in Figure 1(c).
We conducted preliminary evaluation
experiments on EPFL Terrace (sequence 1, camera
view 3) video dataset (Fleuret et al., 2008). For the
sake of simplicity, we used a 100-frame subset of the
original dataset.
We evaluated Yolo2 detection pipeline to
demonstrate the effect of NMS threshold values on
the detection ratio, expressed by DR=dt/gt, where dt
is the number of detected bounding boxes, and gt is
the number of ground truth bounding boxes.
Pedestrian Similarity Extraction to Improve People Counting Accuracy
549
(a)
(b)
(c)
(d)
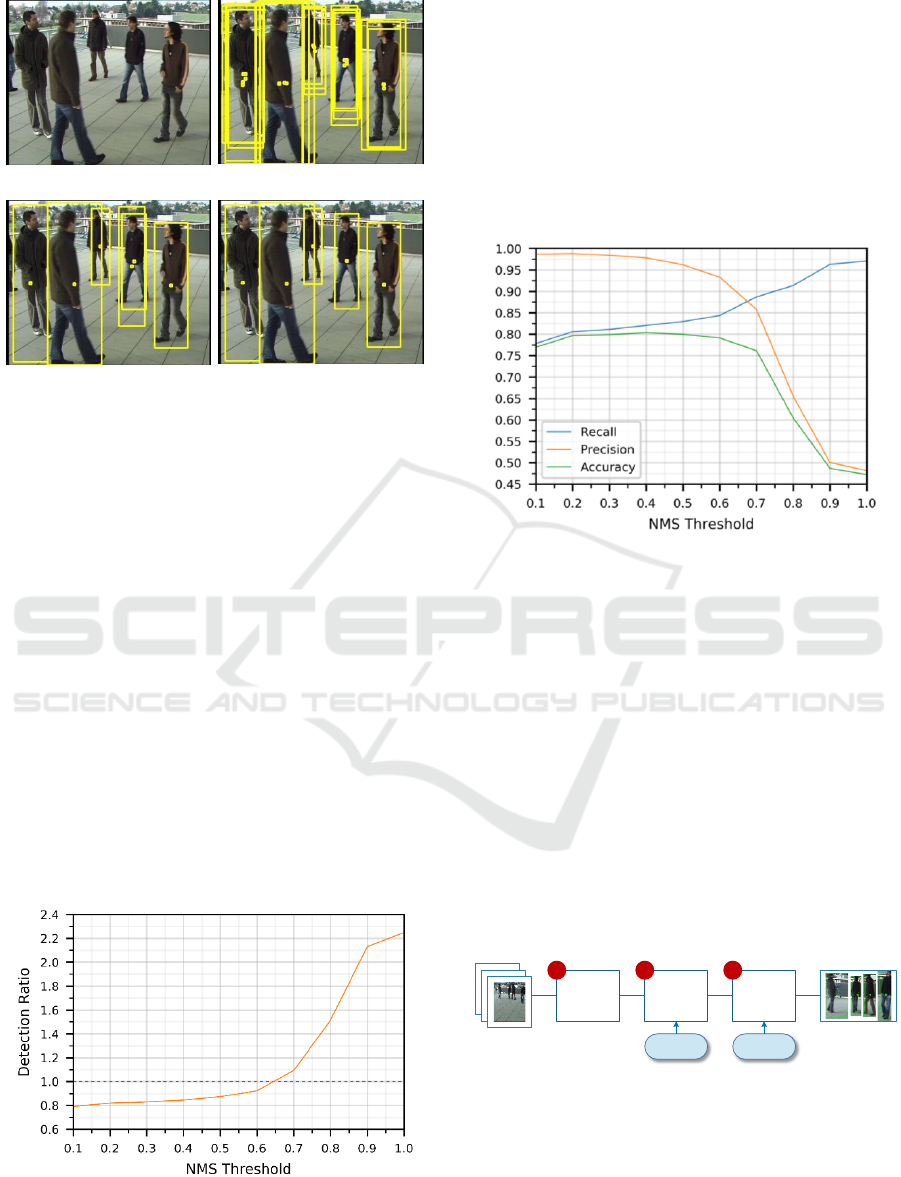
Figure 1: Pedestrian detections. (a) Original image
containing five pedestrians. (b) Yolo2 detector output with
multiple redundant bounding boxes. (c) NMS algorithm
output with few redundant bounding boxes. (d) PSE
algorithm output with no redundant bounding boxes.
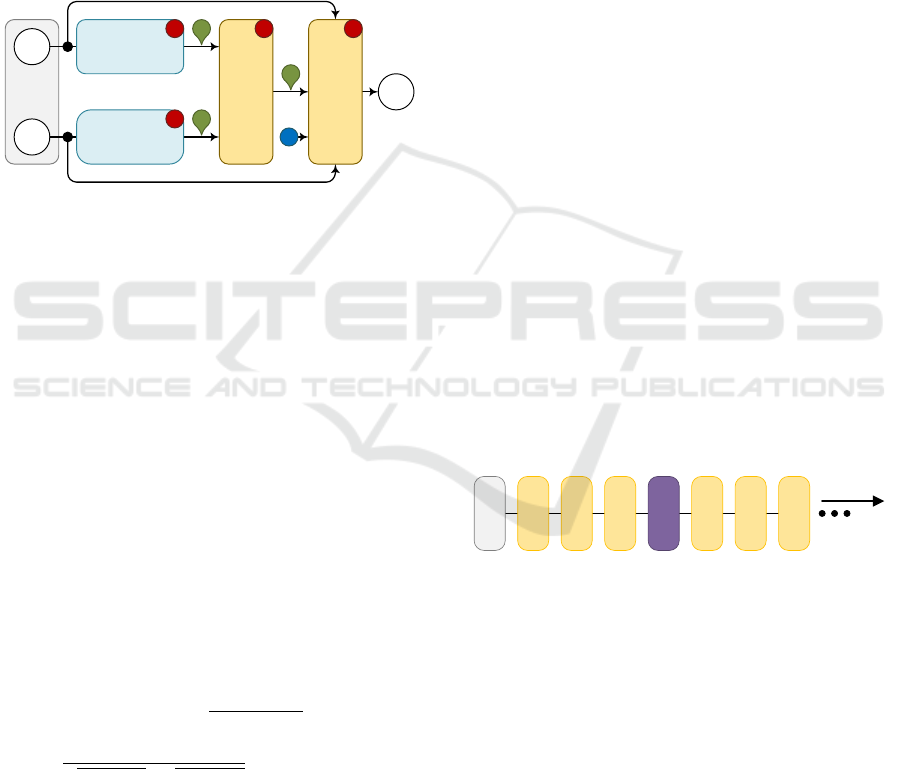
Figure 2 illustrates an example of NMS filter’s
main problem. For lower NMS thresholds, multiple
true positive detections are filtered, resulting in a
limited number of detections and in a lower recall
rate. On the other hand, as the NMS threshold
increases, the number of detected pedestrians
increases significantly up to 2.247 times more than
the number of ground truth pedestrians, indicating
that too many redundant extra boxes are generated,
which significantly hurts the precision and recall.
Figure 3 shows that the descending precision and
accuracy rates, reveal an increasing presence of
redundant detections which become more evident as
NMS threshold approaches 1.0 and recall rate reaches
the maximum value of 0.97, sacrificing precision and
accuracy rates.
Figure 2: NMS threshold impact on detection ratio. Blue
dashed reference line corresponds to a number of detections
matching the number of existing ground truth pedestrians.
The NMS threshold is pre-fixed and can’t fit all
different scenarios. Thus, determining the optimal
NMS threshold value capable of filtering all
redundant detections in all different scenarios,
becomes an impossible task.
Our proposed solution adds a PSE algorithm to the
final stage of current detection pipeline to remove
remaining redundant detections, generated by a
higher NMS threshold, to obtain an exact number of
pedestrians.
Figure 3: NMS threshold impact on recall, precision,
accuracy (EPFL Terrace).
3 THREE-STAGE PEDESTRIAN
DETECTION PIPELINE
The three-stage object detection pipeline (Yolo2 +
NMS + PSE) displayed in Figure 4, ensures that a low
algorithmic complexity NMS filter is applied in an
early stage to reduce the number of bounding boxes
processed by a subsequent high algorithmic
complexity PSE filter. Despite the added complexity,
the new pipeline is still fast and effective enough to
process real-time videos. This approach adds
flexibility and adaptability to suit different scenarios,
also improving the precision and accuracy rates.
Pedestrian
Detector
(Yolo2)
Non-
Maxima
Suppression
Pedestrian
Similarity
Extraction
VIDEO
FRAMES
NMS
Threshold
PSE
Threshold
PEDESTRIAN
BOUNDING
BOXES
321
Figure 4: Three-step detection pipeline.
The proposed detection pipeline requires two pre-
fixed filter thresholds: NMS IoU threshold described
in section 2, and PSE similarity threshold. PSE
threshold defines the maximum pedestrian similarity
score allowed among each pair of bounding boxes.
ICPRAM 2019 - 8th International Conference on Pattern Recognition Applications and Methods
550
4 PEDESTRAIN SIMILARITY
EXTRACTION
4.1 PSE Workflow
The PSE workflow, displayed in Figure 5, takes
pairwise combinations of 224×112-pixel bounding
box images (I
a
and I
b
) output by an NMS stage, and
applies multiple processing steps, described below, to
filter redundant bounding boxes based on similarity
and detection confidence scores, outputting unique
pedestrian detections to Io.
I
a
I
b
I
o
Inputs
Pedestrian
Feature
Extraction
Feature Similarity
Measurement
Output
Pedestrian
Feature
Extraction
1 2
1
S
F
b
F
a
Bounding Box
Selector
t
3
Figure 5: Pedestrian similarity extraction block diagram. I
a
,
I
b
: input bounding boxes. F
a
and F
b
: 128-dimensional
pedestrian similarity vectors. S: similarity score. t: pre-fixed
similarity threshold. I
o
: set of selected bounding boxes.
1. The Pedestrian Feature Extraction (PFE)
convolutional neural network, inspired in
Google’s Inception v3 model, extracts 128-
dimensional vectors, F
a
and F
b
, containing the
most relevant and discriminative pedestrian
features from each pair of bounding box images.
A detailed description is provided in section 4.2.
2. The similarity measurement block computes a
cosine similarity metric, shown in Equation (2),
between two different feature vectors F
a
and F
b
extracted from two distinct bounding boxes, and
outputs a single similarity score within a [0, 1]
range. A similarity score 1 corresponds to exactly
the same pedestrians whereas 0 corresponds to
totally different pedestrians.
(2)
where Fa
i
and Fb
i
are components of feature
vector F
a
and F
b
respectively.
3. The bounding box selector relies on detection
confidence scores C
a
and C
b
, a PSE threshold t
with a [0,1) range, and a pedestrian similarity
score S(a,b) to determine the set of output
bounding boxes I
o
. If the pedestrian similarity
score S(a,b) is lower than a PSE threshold t, both
bounding boxes I
a
and I
b
will be output to Io.
However, if the pedestrian similarity score is
equal or higher than the threshold t, only the
highest confidence bounding box is output to Io.
As a result, duplicate detections are removed.
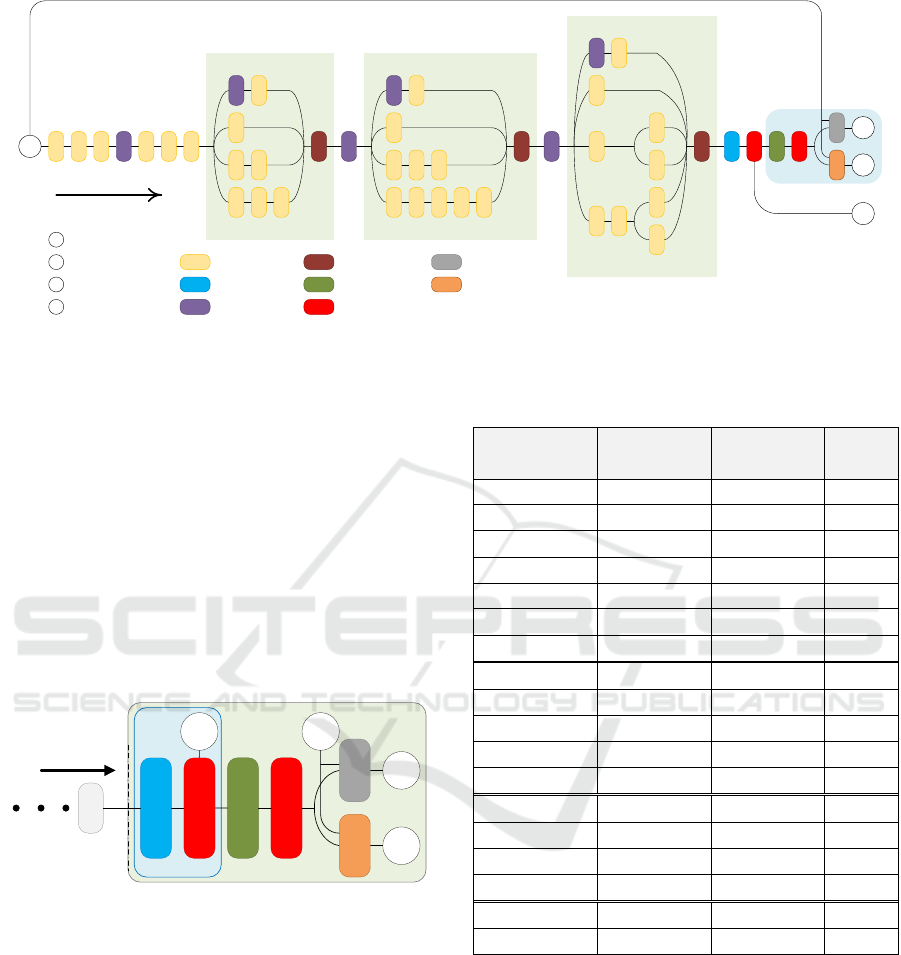
4.2 PFE Network Architecture
The PFE network relies on a 51-layer deep neural
network, inspired in Google’s Inception v3 model
(Szegedy et al., 2016), slightly changed to extract
pedestrian features. This network is composed by a
set of inception modules which perform convolutions
on pedestrian images based on multiple patch sizes,
including 1×1, 1×3, 3×1, 3×3, 1×5, 5×1, 5×5, 1×7,
7×1, and 7×7, extracting the 128 most relevant and
discriminative pedestrian features, from pedestrians
observed from different directions at different angles.
4.2.1 Stem
The PFE network has an input receptive field of
224×112×3 pixels, with a 2:1 aspect ratio RGB image
adequate for most standing pedestrians. The image of
each pedestrian detected is cropped from the input
dataset frame and fed to the network stem section
shown in Figure 6, similarly to Google’s Inception v3
model (Szegedy et al., 2016).
CONV
3×3/S1/P1
CONV
3×3/S1/P1
CONV
3×3/S1/P1
MAX POOL
3×3/S2/P1
CONV
3×3/S1/P1
CONV
3×3/S2/P1
IMAGE
FRAME
CONV
3×3/S2/P1
To Inception
modules
Figure 6: Stem section block diagram contains the set of
operations performed before inception modules.
The network input volume is processed by
multiple convolutions and a maxpool to extract initial
feature maps and reduce the input volume of the first
inception module down to 29×15×32.
4.2.2 Inception Modules
In the core of a pedestrian feature extraction network
resides a group of inception modules, introduced in
GoogLeNet Inception v1 model (Szegedy et al.,
2015).
The PFE network includes three types of
inception modules (A, B, and C) (Szegedy et al.,
Pedestrian Similarity Extraction to Improve People Counting Accuracy
551
3x
5x
F
L
A
3x
INCEPTION A INCEPTION B
INCEPTION C
OUTPUTSTEM
I
MaxPool
ConcatConvolution
AvgPool Dropout
Fully connected
Softmax
L
I
F
A
Input
Accuracy
Features
Loss Accuracy
* Training phase
Flow direction
Figure 7: PFE deep neural network compressed architecture. For simplicity, batch normalization and ReLU activation
functions, used after convolutions, are not shown in the diagram.
2016), as well as maxpool layers between groups of
different inception modules to reduce volume
dimensionality.
4.2.3 Output
The output network section, illustrated in Figure 8, is
composed by an average pooling layer to reduce the
dimensionality of the last inception module C output
volume, and a fully connected layer to output a 128-
dimensional pedestrian feature vector. Dropout and
softmax layers are excluded during the inference
phase as no pedestrian classification is required.
AVERAGE POOL
7×7/S1/P1
F
From last
Inception C module
DROPOUT
FULLY CONNECTED
L
A
ACCURACY
SOFTMAX
FULLY CONNECTED
(128)
I
Inference Phase
Training Phase
Figure 8: Output layers – Inference & Training phases.
A compress architectural view of PFE network is
shown in Figure 7, with a summary shown in Table 1.
4.3 PFE Network Training
4.3.1 Training Dataset
The PFE neural network is pre-trained with a
combined dataset, extracted from six public
pedestrian datasets, including CUHK01, CUHK03,
Market-1501, PRID2011 and VIPeR.
Table 1: PFE Neural network architecture.
Layer type
Input size
(h × w × ch)
Patch Size /
Stride / Pad
Depth
Convolutional
224×112×3
3×3/1/1
1
Convolutional
224×112×32
3×3/1/1
1
Convolutional
224×112×32
3×3/1/1
1
MaxPool
224×112×32
3×3/2/1
0
Convolutional
113×57×32
3×3/1/1
1
Convolutional
113×57×32
3×3/2/1
1
Convolutional
57×29×32
3×3/2/1
1
3×Inception A
29×15×32
-
3×3
MaxPool
29×15×256
3×3/2/1
0
5×Inception B
15×8×256
-
5×5
Max Pool
15×8×256
3×3/2/1
0
3×Inception C
8×5×256
-
3×3
AvgPool
8×5×416
7×7/1/1
0
Fully connected
4×1×416
-
1
Dropout
1×1×128
-
0
Fully connected
1×1×128
-
1
Softmax
1×1×3812
-
0
Accuracy
1×1×3812
-
0
4.3.2 Training and Inference Networks
A few layers are added to the output classification
network section during the training phase, as shown
in Figure 8. A dropout layer is added to prevent
overfitting, followed by fully connected and softmax
layers. The network was trained with a batch size of
20, a learning rate of 0.1, a momentum of 0.9, and a
weight decay of 0.0002.
ICPRAM 2019 - 8th International Conference on Pattern Recognition Applications and Methods
552

5 EXPERIMENTS
Experiments were conducted on three publicly
available video datasets to represent a diversity of
scenarios, enabling an unbiased evaluation capable of
expressing the performance in real scenarios. The
performance is evaluated based on recall, precision,
and accuracy rates.
5.1 Datasets
Table 2 summarizes the three public datasets used in
this work. For each video, 100-frame subsets were
selected to evaluate our pipeline.
Table 2: Input test datasets.
Dataset
Background
complexity
Pedestrians
Range
Mean
Mean
height
EPFL
Terrace
Simple
0 ~ 8
4
217 px
PETS
2009
Moderate
2 ~ 8
6
61 px
Town
Centre
Complex
6 ~ 26
16
78 px
EPFL Terrace dataset (Fleuret et al., 2008)
(sequence 1, camera 3) is a multi-camera pedestrian
video dataset with a resolution of 360×288-pixel,
25fps, recorded by cameras standing approximately
two meters from the ground, made publicly available
by the computer vision lab of École Polytechnique
Fédérale de Lausanne.
PETS2009 dataset (Ferryman and Shahrokni, 2009)
is one of the most commonly used for pedestrian
detection evaluation, made publicly available by the
Computational Vision Group of the University of
Reading. The video PETS2009 S2L1, view 1, used in
this research, has a resolution of 768×576 pixels and
795 frames.
Town Centre dataset (Benfold and Reid, 2011) is a
high-definition, 1920×1080-pixel, 25fps, video
dataset, showing an average of sixteen visible people
at any given time.
5.2 Results and Discussion
This section demonstrates the results and discussion
of conducted experiments. We used composite
metrics: Precision, Recall and Accuracy rates to
evaluate and compare the performance of multiple
pedestrian detection pipelines.
5.2.1 Improving Precision and Accuracy
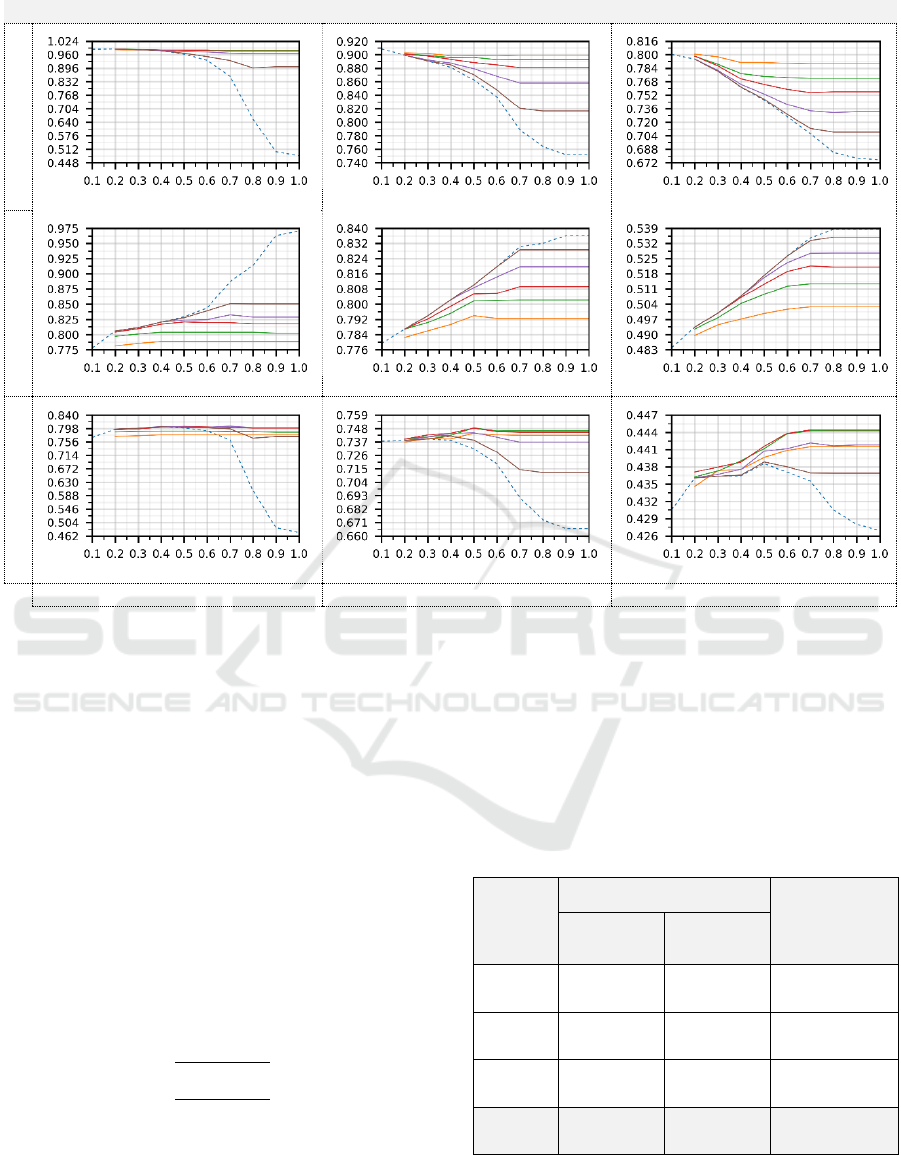
Figure 9 plots the resulting metrics for each dataset,
based on different settings of PSE and NMS
thresholds. Our approach always achieves higher
precision, as shown in Figure 9 (a), (b), (c) and recall
rate (Figure 9 (g), (h) and (i)) when compared with a
standard Yolo2 pipeline, regardless of the pre-fixed
NMS threshold value.
5.2.2 Maintaining Recall
It is often desirable to improve the detection accuracy
and precision without removing true detections. Our
approach can greatly enhance precision and accuracy
rates with a small recall rate penalty (Figure 9 (d), (e),
(f) and Table 3).
Table 3: Precision, Recall and Accuracy rate improvement
over a standard Yolo2 pipeline based on a high PSE
threshold (PSE=0.9).
: mean precision improvement.
:
mean recall improvement.
: mean accuracy improvement.
PSE=0.90
NMS Threshold
0.50
0.60
0.70
0.80
EPFL
Terrace
0.42%
1.87%
8.65%
37.02%
-0.19%
-0.53%
-4.08%
-6.91%
0.20%
1.17%
4.70%
27.03%
PETS
2009
0.92%
1.24%
3.98%
6.7%
0.00%
0.00%
-0.20%
-0.40%
0.94%
1.33%
3.32%
5.72%
Town
Centre
0.13%
0.38%
0.90%
3.54%
0.00%
0.00%
-0.24%
-0.67%
0.06%
0.22%
0.32%
1.48%
Occasionally, some pedestrians become almost
completely occluded by other pedestrians and,
consequently, the similarity score of bounding boxes
generated for the two different pedestrians can be
high, making it difficult for our PSE algorithm to
differentiate the two bounding boxes, resulting in a
true detection removal and, consequently, in a recall
rate reduction.
As a solution, a few subsequent video frames can
be analysed to detect pedestrians and track their
movements even when they become occluded,
avoiding occlusion problems and achieving a
maximum counting accuracy.
Table 3 clearly shows that a higher PSE, such as
PSE=0.9, and an NMS threshold within a limited
range, such as NMS=0.6, may strictly remove high
similarity bounding boxes, resulting in precision and
accuracy improvements. When the NMS threshold is
higher (NMS=0.8), our approach significantly
Pedestrian Similarity Extraction to Improve People Counting Accuracy
553
EPFL Terrace
PETS2009
Town Centre
Precision
(a)
(b)
(c)
Recall
(d)
(e)
(f)
Accuracy
(g)
(h)
(i)
NMS Threshold
NMS Threshold
NMS Threshold
Figure 9: Main performance metrics of three input datasets. Chart colours: Dashed blue line: Standard Yolo2 pipeline with
fixed NMS threshold only. Orange line: Our approach (PSE:0.5). Green line: Our approach (PSE:0.6). Red line: Our
approach (PSE:0.7). Violet line: Our approach (PSE:0.8). Brown line: Our approach (PSE:0.9).
increases precision and accuracy rates with a small
recall penalty.
Although a higher PSE can maintain the recall
rate, it will lose precision since only highly similar
redundant bounding boxes may be removed, as
shown in Figure 9 (a), (b) and (c).
5.2.3 Accuracy Volatility
Pre-fixed thresholds are unlikely to perform
accurately across all input datasets. Standard Yolo2
pipeline shows a high detection accuracy volatility
across the complete range of NMS thresholds.
We determined the mean accuracy standard
deviation using Equation (3).
(3)
where
is the mean accuracy standard deviation of
100 selected frames,
is the accuracy of each video
frame, and
is the mean accuracy of the selected 100
frames on each dataset.
The results, displayed in Table 4, clearly
demonstrate the ability of our three-stage pipeline to
significantly reduce the accuracy variance across a
wide range of NMS thresholds, while maintaining a
high detection accuracy.
Table 4: Accuracy volatility evaluation.
Dataset
Improvement
Standard
Yolo2
Our
Approach
EPFL
Terrace
0.14059
0.01108
12.81%
PETS
2009
0.03260
0.00930
4.56%
Town
Centre
0.00429
0.00304
1.40%
Average
(All)
0.05916
0.00781
6.96%
a. Evaluation threshold ranges:
Standard Yolo2 pipeline: NMS: { 0.2, 0.3, ..., 1.0 }
Our Approach: NMS: { 0.2, 0.3, ..., 1.0 }
PSE: { 0.5, 0.6, ..., 0.9 }
ICPRAM 2019 - 8th International Conference on Pattern Recognition Applications and Methods
554

6 CONCLUSIONS
The counting accuracy of a standard Yolo2 detection
pipeline depends on a pre-fixed NMS threshold and
results from a precision and recall trade-off. Higher
NMS thresholds increase the number of true positive
detections, resulting in high recall rates. However, the
number of unfiltered redundant detections will
increase, resulting in lower precision and accuracy.
In this paper, we have explored a new detection
pipeline to mitigate this limitation. A PSE algorithm
can be added to the final stage of a current detection
pipeline to filter further redundant detections. The
three-step detection pipeline is flexible and adaptable
to different scenarios. A higher NMS filtering
threshold may be set to keep all true detections,
resulting in a higher recall rate. In addition, the PSE
algorithm removes redundant detentions, eventually
resulting in higher precision and accuracy rates.
The three-stage detection pipeline reduces
substantially the accuracy variance, allowing it to
perform better in multiple different scenarios. In
addition, the low accuracy variance achieved makes
it easier to pre-define the NMS threshold as it has a
limited impact on the pipeline’s performance.
Finally, the PSE algorithm can be properly trained
and added to any detection pipeline to remove
redundant detections other than the pedestrian
detection application described in this work.
ACKNOWLEDGMENT
This work was supported by the Macao Science and
Technology Development Fund (Fundo para o
Desenvolvimento das Ciências e da Tecnologia) of
Macao SAR under grant number 138/2016/A3.
REFERENCES
Benfold, B. and Reid, I. (2011) ‘Stable Multi-Target
Tracking in Real-Time Surveillance Video’, IEEE
Conference on Computer Vision and Pattern Recognition.
Byeon, Y.-H. and Kwak, K.-C. (2017) ‘A Performance
Comparison of Pedestrian Detection Using Faster
RCNN and ACF’, in 2017 6th IIAI International
Congress on Advanced Applied Informatics (IIAI-AAI).
IEEE, pp. 858–863.
Dalal, N. and Triggs, B. (2005) ‘Histograms of Oriented
Gradients for Human Detection’, in Computer Vision
and Pattern Recognition, 2005. CVPR 2005. IEEE
Computer Society Conference on, pp. 886–893. doi:
10.1109/CVPR.2005.177.
Devernay, F. (1995) ‘A non-maxima suppression method
for edge detection with sub-pixel accuracy’. INRIA.
Dollar, P. et al. (2014) ‘Fast feature pyramids for object
detection’, IEEE Transactions on Pattern Analysis and
Machine Intelligence, 36(8), pp. 1532–1545. doi:
10.1109/TPAMI.2014.2300479.
Everingham, M. et al. (2010) ‘The pascal visual object
classes (VOC) challenge’, International Journal of
Computer Vision, 88(2), pp. 303–338. doi:
10.1007/s11263-009-0275-4.
Ferryman, J. and Shahrokni, A. (2009) ‘PETS2009: Dataset
and challenge’, Pets, pp. 1–6. doi: 10.1109/PETS-
WINTER.2009.5399556.
Fleuret, F. et al. (2008) ‘Multicamera people tracking with
a probabilistic occupancy map’, IEEE Transactions on
Pattern Analysis and Machine Intelligence, 30(2), pp.
267–282. doi: 10.1109/TPAMI.2007.1174.
He, K. et al. (2016) ‘Deep Residual Learning for Image
Recognition’, in 2016 IEEE Conference on Computer
Vision and Pattern Recognition (CVPR), pp. 770–778.
doi: 10.1109/CVPR.2016.90.
Hosang, J., Benenson, R. and Schiele, B. (2016) ‘A convnet
for non-maximum suppression’, Lecture Notes in
Computer Science (including subseries Lecture Notes
in Artificial Intelligence and Lecture Notes in
Bioinformatics), 9796 LNCS, pp. 192–204. doi:
10.1007/978-3-319-45886-1_16.
Hosang, J., Benenson, R. and Schiele, B. (2017) ‘Learning
non-maximum suppression’, Proceedings - 30th IEEE
Conference on Computer Vision and Pattern
Recognition, CVPR 2017, 2017–Janua, pp. 6469–6477.
doi: 10.1109/CVPR.2017.685.
Liu, W. et al. (2016) ‘SSD: Single shot multibox detector’,
Lecture Notes in Computer Science (including
subseries Lecture Notes in Artificial Intelligence and
Lecture Notes in Bioinformatics), 9905 LNCS(1), pp.
21–37. doi: 10.1007/978-3-319-46448-0_2.
Raghavachari, C. et al. (2015) ‘A Comparative Study of
Vision Based Human Detection Techniques in People
Counting Applications’, Procedia Computer Science.
Elsevier Masson SAS, 58, pp. 461–469. doi:
10.1016/j.procs.2015.08.064.
Redmon, J. et al. (2016) ‘You Only Look Once: Unified,
Real-Time Object Detection’, Proceedings of the IEEE
conference on computer vision and pattern recognition,
pp. 779–788. doi: 10.1016/j.nima.2015.05.028.
Redmon, J. and Farhadi, A. (2016) ‘YOLO9000: Better,
Faster, Stronger’. doi: 10.1109/CVPR.2017.690.
Redmon, J. and Farhadi, A. (2018) ‘YOLOv3: An
Incremental Improvement’. doi:
10.1109/CVPR.2017.690.
Szegedy, C. et al. (2015) ‘Going deeper with convolutions’,
Proceedings of the IEEE Computer Society Conference
on Computer Vision and Pattern Recognition, 07–12–
June, pp. 1–9. doi: 10.1109/CVPR.2015.7298594.
Szegedy, C. et al. (2016) ‘Rethinking the inception
architecture for computer vision’, in Proceedings of the
IEEE Conference on Computer Vision and Pattern
Recognition, pp. 2818–2826.
Pedestrian Similarity Extraction to Improve People Counting Accuracy
555
