
Using Phase-type Models to Monitor and Predict Process Target
Compliance
Sally I. McClean
1
, David A. Stanford
2
, Lalit Garg
3
and Naveed Khan
4
1
School of Computing, Ulster University, Coleraine, BT52 1SA, U.K.
2
Department of Statistical & Actuarial Sciences, Western University, London, ON N6A 5B7, Canada
3
Faculty of Information & Communication Technology, University of Malta, Msida, Malta
4
School of Computing, Ulster University, Jordanstown, BT37 0QB, U.K.
Keywords:
Process Mining, Process Modelling, Phase-Type Models, Targets.
Abstract:
Processes are ubiquitous, spanning diverse areas such as business, production, telecommunications and health-
care. They have been studied and modelled for many years in an attempt to increase understanding, improve
efficiency and predict future pathways, events and outcomes. More recently, process mining has emerged with
the intention of discovering, monitoring, and improving processes, typically using data extracted from event
logs. This may include discovering the tasks within the overall processes, predicting future trajectories, or
identifying anomalous tasks. We focus on using phase-type process modelling to measure compliance with
known targets and, inversely, determine suitable targets given a threshold percentage required for satisfactory
performance. We illustrate the ideas with an application to a stroke patient care process, where there are mul-
tiple outcomes for patients, namely discharge to normal residence, nursing home, or death. Various scenarios
are explored, with a focus on determining compliance with given targets; such KPIs are commonly used in
Healthcare as well as for Business and Industrial processes. We believe that this approach has considerable
potential to be extended to include more detailed and explicit models that allow us to assess complex scenarios.
Phase-type models have an important role in this work.
1 INTRODUCTION
Processes are ubiquitous, spanning diverse areas
such as business, production, telecommunications and
healthcare, and have been studied and modelled for
many years in an attempt to increase understand-
ing, improve efficiency and predict future pathways,
events and outcomes. With the ever-increasing capa-
bility of computer systems to collect, process, store
and exchange data and the advent of the Big Data era,
the concept of Process Mining has emerged to form
a bridge between data mining and process modelling
(Van Der Aalst, 2012). Process Mining provides a
framework for service design, an under-pinning for
process improvement and a scientific basis for deci-
sion making. For example, a process can be con-
cerned with how an execution of process instances
should occur, where each execution instance of a busi-
ness process is identified as one process instance. A
process instance contains information on the tasks ex-
ecuted and the attributes observed during execution.
A process instance execution of the tasks is performed
according to the structure and definitions in the real-
world process. The process attributes typically con-
sist of information such as start time, end time, cus-
tomer name etc. and are stored in log files. Hence, a
log file typically provides an automatically produced
and time-stamped documentation of events relevant to
a particular system.
In general, process mining aims to discover, mon-
itor, and improve processes by extracting data from
event logs. This may include discovering the tasks
within the overall processes, predicting future pro-
cess trajectories, or identifying anomalous tasks and
task sequences. Such process mining activities can
build on standard approaches to data mining prob-
lems such as classification, clustering, regression, as-
sociation rule learning, and sequence mining or more
recent approaches for Big Data, such as deep learn-
ing. However, if the structure of the process is known,
model-based approaches can also be useful for incor-
porating structural process knowledge into the analy-
sis and simplifying the problem. Thus process mining
can be use in various applications such as manufac-
82
McClean, S., Stanford, D., Garg, L. and Khan, N.
Using Phase-type Models to Monitor and Predict Process Target Compliance.
DOI: 10.5220/0007362200820090
In Proceedings of the 8th International Conference on Operations Research and Enterprise Systems (ICORES 2019), pages 82-90
ISBN: 978-989-758-352-0
Copyright
c
2019 by SCITEPRESS – Science and Technology Publications, Lda. All rights reserved

turing (van der Aalst et al., 2007), telecommunica-
tions (Taylor, 2015), financial processes and health-
care (Agrawal et al., 1993).
Typically, a mathematical, symbolic or simulation
model is used to provide a simplified representation
of a process, where simulation involves using a math-
ematical model to imitate important aspects of the be-
haviour of the process and allow prediction and exper-
imentation to take place without having to disturb the
real-life set-up (McClean et al., 2011). Correctness,
conformance and performance are among the most
important issues in the study of complex processes
and systems, where process models are often used to
assess such issues. Correctness can describe quali-
tative aspects of a system, such as liveness, safety,
boundedness and fairness while compliance deter-
mines whether the observed process complies with
the theoretical one. Performance describes the quanti-
tative, dynamic, and time-dependent behaviour of the
process, such as its response time, system uptime and
throughput. In particular, our focus here is on deter-
mining whether a process is complying with targets.
For example, a business process may have targets to
fulfil orders in a timely manner, a hospital emergency
department often has targets to treat a set percentage
of patients within a given time limit, and service level
agreements specify agreed performance targets in the
Cloud.
Process algebras offer a means of formalising
systematic, hierarchical modelling of complex sys-
tems, but they are generally only used for qualita-
tive analysis (correctness) because they lack tempo-
ral and probabilistic semantics. Such Process Alge-
bras and Stochastic Process Algebras are high-level
modelling languages that can be used to model a sys-
tem. Stochastic extensions of process algebra fa-
cilitate both qualitative and quantitative performance
evaluation within a single, integrated modelling en-
vironment. Petri nets (Peterson, 1981) are high-
level formalisms that can also be used to model sys-
tems and are one of several mathematical modelling
languages for the description of distributed systems.
They are abstract formal methods, introduced in 1962
by Carl Adam Petri, for the description and analysis
of flow of information and control in concurrent sys-
tems. Like industry standards such as UML, Petri nets
offer a graphical notation for stepwise processes that
include choice, iteration, and concurrent execution.
Unlike some industry standards, they have an exact
mathematical definition of their execution semantics,
with a well-developed mathematical theory for pro-
cess analysis and are graphically represented as col-
lections of places drawn as circles, transitions drawn
as rectangles, and arcs, which are drawn as arrows
between places. For example, Petri Nets have been
used for process support for continuous, distributed,
multi-party healthcare processes - by applying work-
flow modelling to an anticoagulation monitoring pro-
tocol (McChesney, 2016). Such workflow modelling
has found relevance in the analysis and support of a
range of healthcare processes, e.g. Stochastic Petri
nets (Haas, 2006), including Queueing Petri nets, can
be used for quantitative performance analysis.
A Markov model is a special type of probabilis-
tic process model used to model systems where it is
assumed that future states depend only on the cur-
rent state, and not on previous events (the Markov
property). This assumption facilitates predictive mod-
elling on an individual basis (Garg et al., 2012) and
probabilistic forecasting for groups of individuals
traversing a process in parallel or during a given time
period (Gillespie et al., 2016). For example, we might
predict the most likely trajectory through the process
for a specific customer or the anticipated overall load
on a section of the total process. Higher order Markov
models may also be used if the Markov assumption
is found to be unrealistic. Continuous-time Markov
Chains (CTMCs) are also commonly used in stochas-
tic modelling where state durations are described by
exponential distributions (the Markov property). A
multi-phase (Markov) approach to process manage-
ment facilitates the study of both the specific phases
(tasks) of a process and the overall journey. In this
way, mathematical models can be developed for the
whole process with the objective of optimising perfor-
mance criteria such as waiting times, costs, or Quality
of Service goals. Such models have also been used to
find interesting pathways (Garg et al., 2009), where
”interesting” can be interpreted, inter alia, as either
frequent, or infrequent instances.
In this paper we show how phase-type models can
be used to predict compliance of a process with com-
pletion targets. The prediction may be ab initio or
conditioned on the process already having completed
a given amount of time or reached a known termina-
tion state. A number of formulae are derived and the
ideas are illustrated for a healthcare process concern-
ing targets for patient pathways through health and
community phases.
2 BACKGROUND
Markov models have proved to be a useful repre-
sentation of process behaviour in many contexts, in-
cluding call centres (Dudin et al., 2016), sensor net-
works (Dudin and Lee, 2016), telecommunications
(Vishnevskii and Dudin, 2017), production modelling
Using Phase-type Models to Monitor and Predict Process Target Compliance
83

(Barron et al., 2016) and healthcare (Gillespie et al.,
2016). Phase-type models are a type of Markov model
with a number of transient states (or phases) and a sin-
gle absorbing state. Such models can be used to pre-
dict individual behaviour or to assess future resource
needs and costs. They are intuitively appealing as
they conceptualise process progression, for instance,
through acute care, into treatment, and on to rehabil-
itation. A phase type distribution (PHD) describes a
non-negative random variable (generally a duration)
generated by a Markov model where the PHD rep-
resents the duration from adnission to the transient
states of the Markov process until absorption in one of
the recurrent states. In particular, Coxian phase type
distributions (C-PHDs) are a special case of PHDs
in which a process always starts in the first transient
state, and only sequential transitions are allowed be-
tween transient states; transition from any state to the
absorbing state is also possible (Figure 1). PHDs pro-
vide a simple description of a variable such as length
of stay (LOS) in hospital, duration of a particular ac-
tivity of daily living, or duration from order placement
to completion in a business process. PHDs also typi-
cally have the advantage of ease of parameter estima-
tion (Garg et al., 2012). In particular, Coxian phase-
type models (C-PHDs) work well for a range of set-
tings and scales, including hospitals (Fackrell, 2009),
(Tang et al., 2012), (Marshall and Zenga, 2012), and
(Griffiths et al., 2013), community care (Xie et al.,
2006), emergency services (Knight and Harper, 2012)
and patient activity recognition (Duong et al., 2009).
They are also intuitively appealing as, for example,
we can think of a patient as progressing through vari-
ous phases of hospital, social or community care such
as acute care, treatment, rehabilitation and long stay
(Figure 1).
Figure 1: Coxian Phase-type transition distribution.
From the technical point of view, the advantages
of using the PHDs are (i) their mathematical tractabil-
ity; (ii) parsimonious parameterization, in the case
of C-PHDs, - a general phase-type representation re-
quires a large number of parameters, with associated
difficulties in estimation; (iii) flexibility - any distri-
bution can be approximated by a phase-type distribu-
tion with an appropriate number of parameters; and
(iv) the ease with which such representations can be
migrated to a more complex setting.
Our previous work (Garg et al., 2012) developed
a framework that classifies the patient stays based on
identifying homogeneous groups, or classes, in terms
of their LOS distributions; where different admission
probabilities pertain to different classes. Classes are
characterized using appropriate covariates, which in
our case were gender, age, diagnosis and outcome.
Patients in the various classes follow separate path-
ways, with correspondingly different admission prob-
abilities for each class. Another feature of our frame-
work is that, unlike earlier work, we allow for a num-
ber of absorbing states - for example, these might
be the patient’s normal residence, a private nursing
home (PNH), or death. Such an approach allows us
to extend phase-type models to describe community
as well as hospital states thus modelling an integrated
system of stroke patient care, rather than sub-systems
of the overall care process. Generally speaking, we
can think of this model as a mixture of parallel C-
PHDs, with multiple absorbing states.
Hidden Markov models (HMMs) are similar to
phase-type models in that the system being modelled
is also assumed to be Markovian, with unobserved
(hidden) states. However, HMMs are generally more
focussed on the pathway through the Markov system
while phase-type models have a particular relevance
to duration in the transient states and have their ori-
gins in queueing theory where performance, in terms
of timeliness, is central. HMMs are especially known
for their application to temporal pattern recognition
such as speech processing (Rabiner, 1989). They
have also been extended to include parallel and hier-
archical structures, for example the hierarchical hid-
den Markov model (HHMM) (Fine et al., 1998). Such
approaches have already been used in healthcare set-
tings, in particular for patient temporal pattern discov-
ery from Australian medical claims data (Tsoi et al.,
2005). The HHMM here profiles the patients into sub-
behavioural groups based on similar temporal profiles
and medical behaviours. Another important health-
care use of HHMMs has been for activity recognition,
specifically aimed at developing automated reminder
systems for patients with dementia (Youngblood and
Cook, 2007). Here, repeated behaviours in sensorised
smart homes are observed and categorized into pat-
terns that represent the inhabitant behaviour. As for
patients moving through a health system, home-based
activities also move through a process, comprising a
sequence of smaller steps, or phases, such as treat-
ment or rehabilitation in the former case or instrumen-
tal activities of daily living (IADLs), such as taking
pills or making a cup of tea, in the latter case.
In this paper, based on our previous work (Faddy
and McClean, 2005),(Jones et al., 2018), we incorpo-
rate the covariates into the model by allowing the tran-
ICORES 2019 - 8th International Conference on Operations Research and Enterprise Systems
84

sition rates between states of the underlying Markov
model to depend explicitly on appropriate covariates.
Based on process data, the model can then be pruned
by eliminating those covariates which are not statisti-
cally significant, on the basis of likelihood-based sta-
tistical tests. The specific functional form of this co-
variate model will be described in the next section.
We note that the approach proposed here is to use
a PHD, which may, or may not be, Coxian (C-PHD).
However in what follows we illustrate the ideas with
a specific healthcare case study where the patients
progress through successive states of health, so we as-
sume that they follow a C-PHD. Also, in general we
propose to incorporate covariates by modelling them
through an explicit functional dependency for the in-
put, exit and transition probabilities. This is also il-
lustrated in the healthcare case study.
3 PHASE-TYPE MODELS
3.1 The Basic Phase-type Model
As in (McClean et al., 2011) we employ a phase-
type model for process planning, based on Markov
phase-type models. Thus the phase-type model can
allow us to easily implement and quickly evaluate
changes in process circumstances. Frequently a C-
PHD is used and is intuitively appealing as we can
think of the process as progressing through sequen-
tial phases, without loops, before completion (Figure
1). As discussed, C-PHDs provide a simple descrip-
tion of a variable such as length of stay in hospital or
duration of an activity of daily living and also have
advantages over other types of PHDs, such as ease of
parameter estimation.
We begin by considering a basic C-PHD and then
extend the model to a general PHD with entry to any
transient state, and k absorbing states. We thus ini-
tially consider a system of k+1 states (or phases) and
a Markov stochastic process defined according to the
transition probabilities defined for i = 1,2,...,k − 1
P{X(t + δt) = i + 1|X(t) = i} = λ
i
δt + o(δt);
P{X(t + δt) = k + 1|X(t) = i} = µ
i
δt + o(δt).
(1)
(The latter of these equations applies as well for
i = k.) Here the rates λ
1
,λ
2
,..., λ
k−1
describe se-
quential transitions between phase S
i
and the subse-
quent phase S
i+1
while µ
1
,µ
2
,..., µ
k
describe transi-
tions from phase S
i
to the absorbing state S
k+1
for
i = 1, 2,. .., k (see Figure 1). If µ
i
> 0 for i = 1, 2,..., k
then phases S
1
,S
2
,..., S
k
are transient while phase
S
k+1
is the unique absorbing state. Writing the ad-
mission vector as
α
0
= (α
1
,α
2
,..., α
k
) (2)
where α
i
denotes the probability of admission to
phase S
i
;i = 1,2,... ,k, we obtain the probability
density function (p.d.f.) for the distribution of time
until absorption as
f (x) = α
0
exp(Tx)t
0
. (3)
In the foregoing formula, t
0
= −T1 represents
the absorption rate vector from the various transient
states. For a C-PHD with k transient phases, the in-
finitesimal generator (rate) matrix T is null except for
the main diagonal and prime super-diagonal, which
are defined for i = 1,2,.. ., k − 1 by
T
ii
= −(λ
i
+ µ
i
); T
i,i+1
= λ
i
. (4)
Furthermore, T
kk
= −µ
k
. Integrating the p.d.f, one
obtains the cumulative distribution function
F
X
(y;α,T) = 1 − α
0
exp(Ty)1;y ≥ 0. (5)
which represents the probability of meeting a given
time target y. Conversely, the probability of missing a
time target y is given by
¯
F
X
(y;α,T) = α
0
exp(Ty)1;y ≥ 0. (6)
In this way, it is possible for us not only to quan-
tify the relative likelihoods of compliance and ex-
ceedance, but also to formulate sub-tending network
paths for the corresponding actions that would arise
in each of these cases. Using the same approach as
(Jones et al., 2018), we can find the conditional prob-
ability of meeting (or alternatively, missing) a given
target at time y give that a known amount of time (say,
d) has already elapsed. The chance of the former is
given by
F
X|X>d
(y;α,T) = 1 −
α
0
exp(Ty)1
α
0
exp(Td)1
;
y ≥ d, (7)
while the chance of the latter is given by
¯
F
X|X>d
(y;α,T) =
α
0
exp(Ty)1
α
0
exp(Td)1
;
y ≥ d. (8)
In like fashion, conditional means can be computed
by integrating the corresponding conditional densities
over the appropriate regions.
Using Phase-type Models to Monitor and Predict Process Target Compliance
85

4 CASE STUDY: STROKE CARE
In many cases there are several possible absorbing
states for termination of a process, corresponding
to different targets, In previous work we have ex-
tended the basic phase-type models to accommodate
such multiple absorbing states (McClean et al., 2011),
(Jones et al., 2018). This model pertains to care of
stroke patients using data collected over a period of 5
years. In this case we have identified 4 transient states
of the phase-type model which relate to different
types of stroke with differing severity and correspond-
ing admission probabilities for decreasing severity of
stroke. The model allows for three different types of
stroke: haemorrhagic (the most severe, caused by rup-
tured blood vessels that cause brain bleeding), cere-
bral infarction (less severe, caused by blood clots) and
transient ischemic attack or TIA (the least severe, a
mini-stroke caused by a temporary blood clot). In
this setting, there are three possible ways in which
the hospital stay can conclude: 1) upon the patient’s
demise, 2) with a transfer to a nursing home, and 3)
with a return to the patient’s usual residence. These
differing possibilities can be handled readily by re-
placing the absorption rate vector t
0
by a matrix of
distinct absorption rates t
A
defined as follows:
t
A
=
µ
1
ν
1
ρ
1
µ
2
ν
2
ρ
2
µ
3
ν
3
ρ
3
µ
4
ν
4
ρ
4
. (9)
In (9), each column of the matrix corresponds to a dis-
tinct concluding event for the hospital stay (demise,
nursing home, and usual residence, respectively)
while each row refers to the particular transient phase
from which the absorption occurred. Each such phase
corresponds to a particular recovery stage from which
absorption occurred, with the first corresponding to
the sickest individuals, and the last to the least sick.
The interested reader is directed to (Jones et al., 2018)
where the rational behind the four transient states and
other details are fully described.
The univariate density of time to absorption may
still be written as before, or alteratively as
f
X
(y|α,T) = α
0
exp(Ty)t
A
1
3
, y ≥ 0 . (10)
which is equivalent. If one wishes instead to deter-
mine the joint density of absorption together with
a particular concluding event (say, the jth possible
cause), the corresponding formula is given by
f
X
(y|α,T) = α
0
exp(Ty)t
A
e
j
, y ≥ 0 (11)
where e
j
denotes a column vector with unity in the
jth position, and zeroes elsewhere.
In this case study data were collected over a 5 year
period, on admission date, length of stay in hospi-
tal, diagnosis and discharge destination, and other co-
variates, such as age on admission and gender. The
transition rates of the model comprise both those that
depend upon the age and stroke type of the patient,
and those which do not depend on age; these depen-
dencies were previously established using statistical
analysis.
For i = 1,2, let λ
i
(x) be the transition intensity
from phase i to phase i + 1 for a patient who is age
x, where λ
i
(x) = exp(γ
i
+ β
i
x). Also, let p(x) repre-
sent the probability that a TIA stroke patient age x is
in recovery phase 4 upon admission to hospital (rep-
resenting the less severe TIAs). Consequently, a TIA
patient starts in phase 3 with probability 1 − p(x). We
assume that p(x) = exp{−exp(θ
0
+θ
1
x)}. The expo-
nential functions used in modelling λ
i
(x) and p(x) are
fairly standard, and ensure that their values are con-
strained to the required ranges. These functions arise
when using the log link and complementary log-log
link functions in generalized linear models (Dobson
and Barnett, 2008). As indicated in Figure 1, it is as-
sumed that µ
4
= ν
4
= 0.
We note that the routes missing from the dia-
gram in Figure 1, and corresponding zero parameters,
are determined by statistical testing based on Likeli-
hoods; for further details see (Jones et al., 2018).
4.1 Interventions to Increase
Compliance Likelihood
Another benefit of the phase-type approach is that
it allows the user to explore the probabilistic conse-
quences of interventions to enhance the chances of
compliance, provided that the sequence of tasks in-
volved in the intervention can likewise be described
by a C-PHD process. Using such an approach, in
Section 3.1 we have provided formulae to predict the
probability of compliance with a given completion
target, assuming that current patterns (i.e. parameter
estimates) continue. However, an important follow-
on question is clearly: can we intervene to modify or
“restart” the process at the current point in time and
can we then predict the new probability of meeting
the target.
Following the logic behind equations (7) and
(8), the vector for the conditional probability of be-
ing in the various transient states at the interven-
tion instant d is readily seen to be given by ω
0
=
α
0
exp(Td)/[α
0
exp(Td)1].
Now let S denote the part of the infinitesimal gen-
erator restricted to the transient states for the en-
hanced C-PHD process including the intervention
ICORES 2019 - 8th International Conference on Operations Research and Enterprise Systems
86
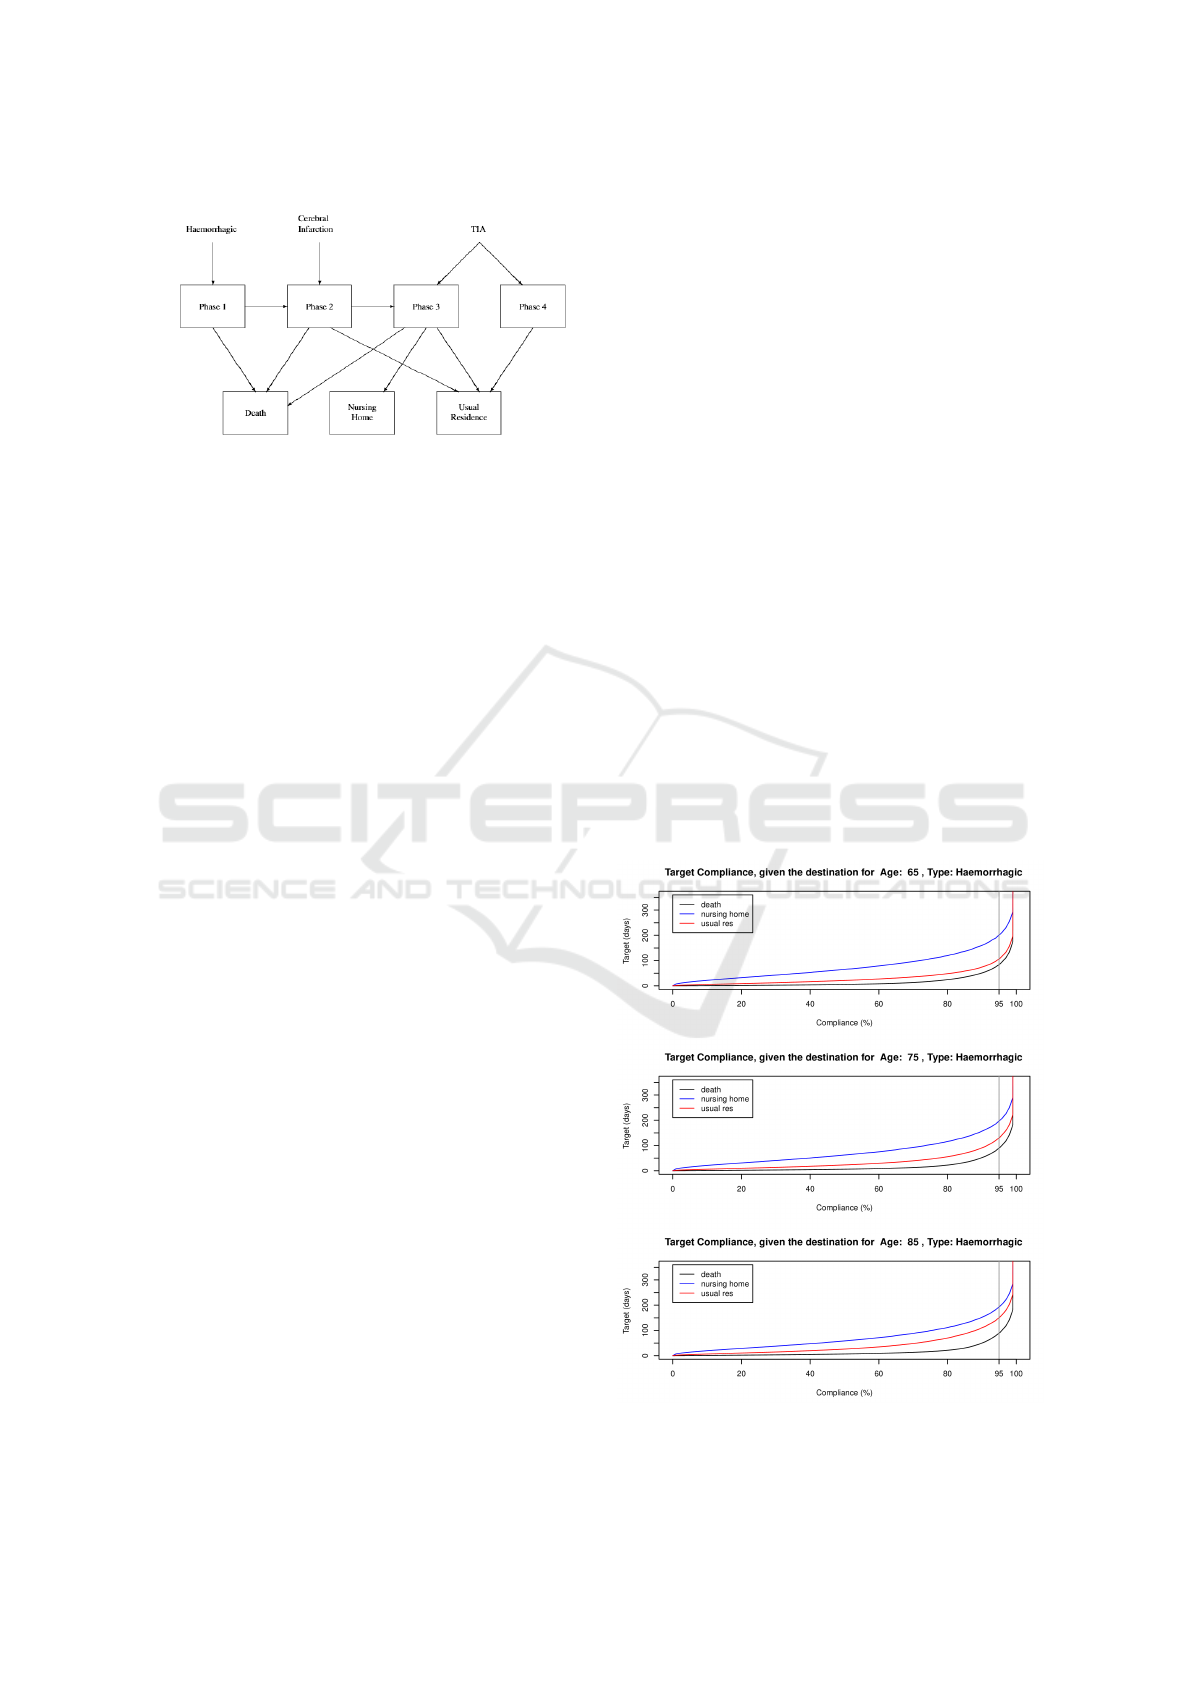
Figure 2: Stroke care transition diagram.
(which need not entail the same number of transient
states as the original process). The probability vec-
tor β for starting the enhanced process in the various
possible states β denote the vector of starting the en-
hanced process at time d in the various transient states
will be a direct function β = f (ω), such as perhaps
merely repositioning the components of ω in some
enlarged state space.
The corresponding probability of compliance by
time y given an intervention time d is then given by
F
X|X>d
(y;β,S) = 1 − β
0
exp(S(y − d))1;
y ≥ d, (12)
The other extensions can be found in like fashion. We
note here that the inverse problem of determining a
suitable target value, given a desired service level can
also be derived from this equation, by solving to find
the target y for a .given value of F. Here F can be
thought of corresponding to a service level agreement,
where, for example, we may require 95% of jobs to
be completed within a given time. Although we can-
not solve equation (5) explicitly for y, we can instead
use a numerical approach, such as Newton-Raphson
where the estimate of y is given at the n+1st iteration
y
n+1
is given by:
y
n+1
= y
n
− F(y
n
)/F
0
(y
n
) where
F
0
(y) = α
0
exp(Ty)T1;y ≥ 0, (13)
4.2 Estimating the Model Parameters
As discussed, a phase-type model typically contains
a number of parameters, representing the initial en-
trance probabilities to each state, the transition rates
between transient states and exit transition rates from
each state to the absorbing state. In addition there
are often covariates, both static (process covariates or
features) and associated dynamic covariates with in-
dividual log files. In process mining, these covariates
are extracted from the logs and can be used to im-
prove the model. Two common strategies are (1) to
use the covariates to cluster the process instances and
then use a cluster specific model to predict outcomes
and (2) to explicitly model the parameters as functions
of the covariates, thus facilitating more parsimineous
models and less data-consuming estimation (McClean
et al., 2011).
In our case study we employ the latter strategy;
this is partly due to inherently limited data in such
healthcare applications (Jones et al., 2018). The
model which we eventually decided upon represents
the smallest one to allow for sufficient distinction of
the various types of stroke. It also has the desir-
able statistical property of being more parsimonious
in terms of the number of parameters to be estimated
than a larger model. Its state transition diagram is
shown in Figure 2.
4.3 Results and Discussion
Fig. 3, 4 and 5 present the choice of target as a
function of the probability of compliance for different
types of stroke and each of the modes of discharge:
death, nursing home, and usual residence. In the case
of haemorrhagic strokes,we see that, for a given prob-
ability of compliance, the target should be lowest,
with TIAs highest, representing the fact that haemor-
rhagic strokes are most severe and TIAs least severe.
Figure 3: Number of days to achieve the target compliance
for patients with Haemorrhagic stroke.
Using Phase-type Models to Monitor and Predict Process Target Compliance
87
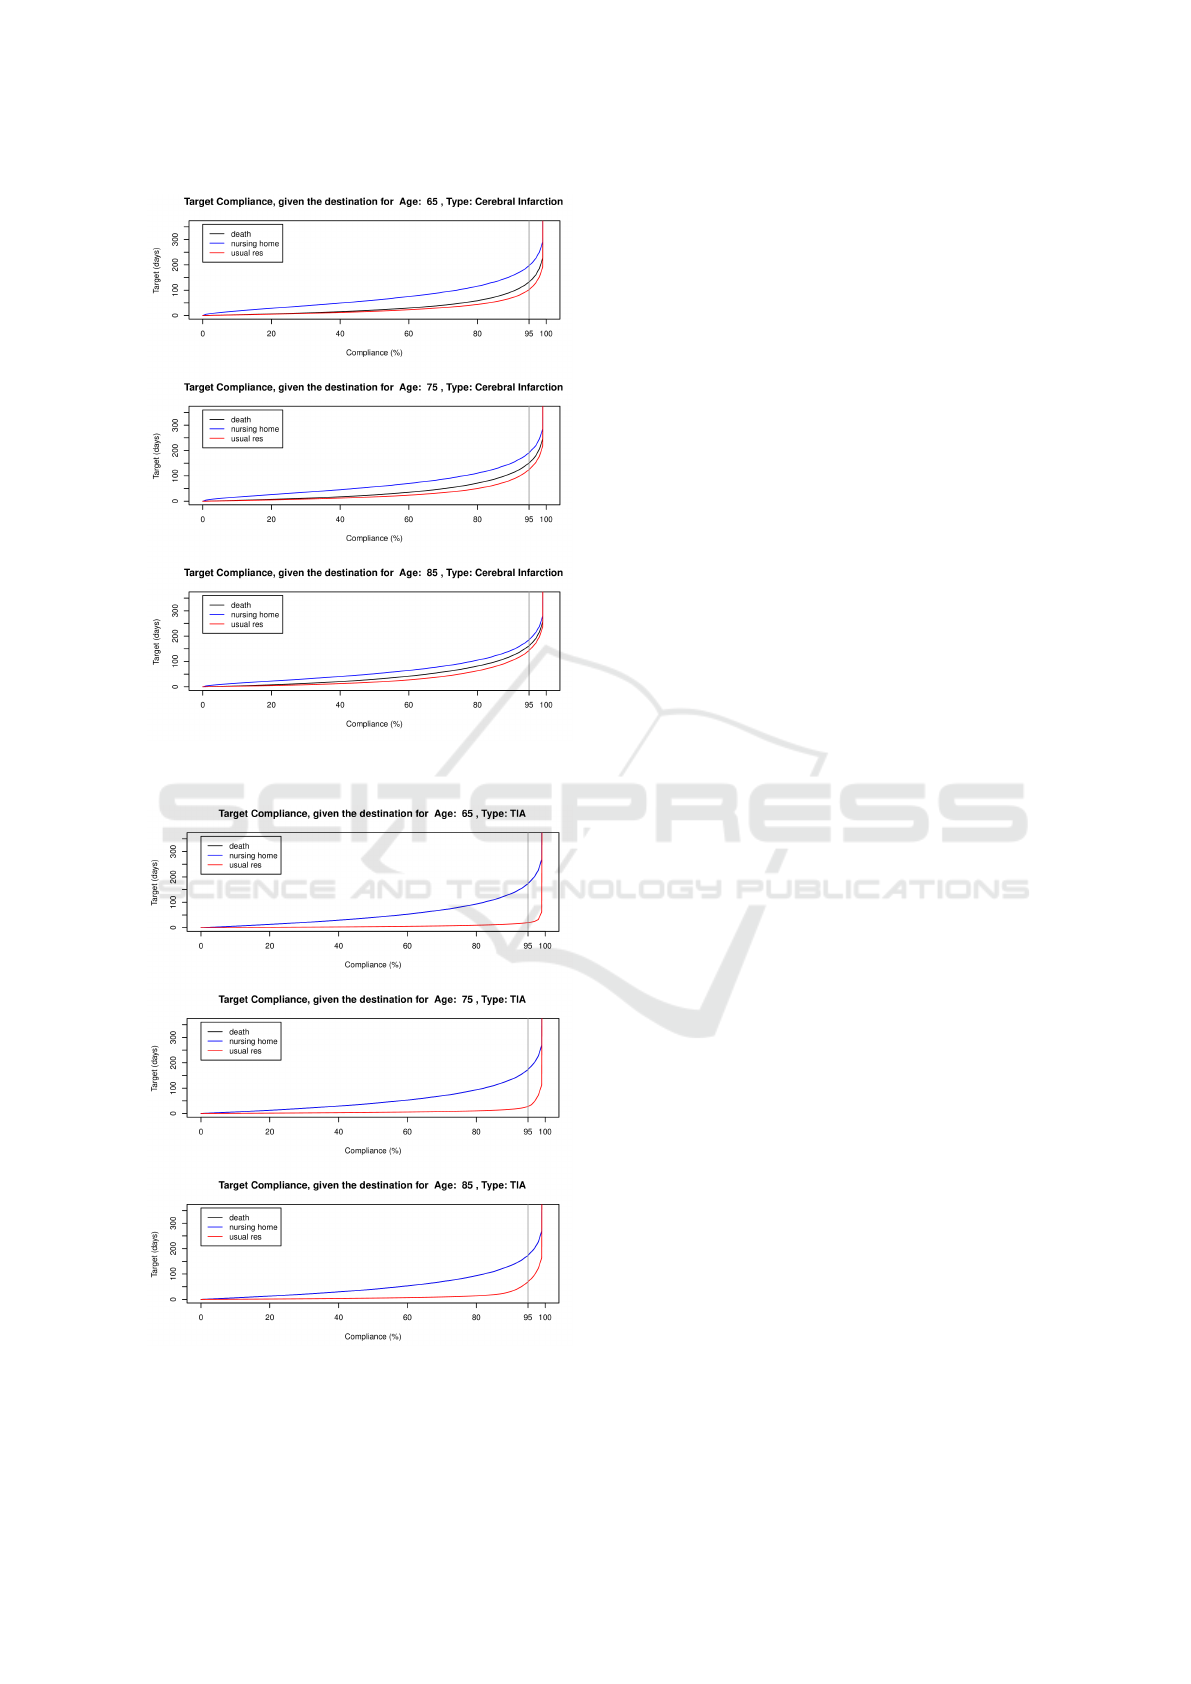
Figure 4: Number of days to achieve the target compliance
for patients with Cerebral Infarction stroke.
Figure 5: Number of days to achieve the target compliance
for patients with TIA stroke.
Similarly, for discharge destination, for a given tar-
get, the probability of compliance should be lowest
for discharge to the usual residence, as an extended
period is required for such patients to pass through
the corresponding recovery phases before discharge.
This is reflected in the observation that for a given
probability of compliance, the target of such patients
is lowest. In the figure we have highlighted the targets
for 95% compliance as this is a typical value.
Overall, modelling can be used to characterise the
whole system of stroke patient care and the associ-
ated clinical pathways, integrating hospital and com-
munity services to provide tools for describing current
services, assessing the impact of proposed changes,
and predicting resource requirements in future sce-
narios. Our previous paper (Jones et al., 2018) fo-
cussed on developing models that use routinely avail-
able hospital discharge data to describe patient ad-
missions, movements through hospital, and discharge
modes. Such models can be used to facilitate perfor-
mance modelling, bed occupancy analysis, capacity
planning, and prediction of patient numbers in differ-
ent components of the overall care system. By using
such a model to quantify resource consumption, and
costs of such proposed interventions, we can com-
pare different solutions and determine optimal strate-
gies. Stroke patient care thus provides an important
paradigm example for healthcare process modelling,
as there are many possible interventions which strad-
dle hospital and community services. However, for
such models to be effective, a robust estimation pro-
cess and thorough evaluation is essential. Overall
length of stay in hospital and compliance with re-
lated targets are key performance indicators for hos-
pital services, and it is therefore useful to assess the
impact of key interventions, in terms of their impact
on the achievement of length of stay targets.
5 SUMMARY AND FURTHER
WORK
This paper has focussed on using process mining
to extract data on processes and learn appropriate
parameters for phase-type models where we focus
on using such models to measure compliance with
known targets or determine suitable targets given a
threshold percentage required for satisfactory perfor-
mance. We have described an application of such
phase-type models to stroke patient care, where there
are multiple outcomes for patients, such as discharge
to normal residence, nursing home, or death. Based
on these data, various scenarios have been explored,
with a focus on determining compliance with given
ICORES 2019 - 8th International Conference on Operations Research and Enterprise Systems
88

targets; such KPIs are commonly used in Healthcare
as well as for Business and Industrial processes.
Our current framework represents initial work to-
wards developing integrated models for processes,
with the aim of supporting cohesive management and
planning. However, we believe that it also has con-
siderable potential to be extended to include more de-
tailed and explicit models that allow us to assess com-
plex scenarios involving interactions between pro-
cesses. Also, our current analytic model has the ad-
vantage that the results are based on routinely avail-
able data. Another important aspect of extending our
current framework is to consider the distributions and
moments of numbers of process instances complying
with targets for multiple absorbing states, including
processes using Poisson arrivals to describe streamed
data of independent instances; costs can also be asso-
ciated with various options within the model. We plan
to explore such options in further work.
The experience gained and techniques learned are
likely to be relevant to business processes in gen-
eral. Phase-type models have an important role in this
work.
ACKNOWLEDGEMENT
This research is partly supported by BTIIC (BT Ire-
land Innovation Centre), funded by BT and Invest
Northern Ireland and by the Natural Sciences and En-
gineering Research Council of Canada (NSERC).
REFERENCES
Agrawal, R., Imieli
´
nski, T., and Swami, A. (1993). Min-
ing association rules between sets of items in large
databases. In Acm sigmod record, volume 22, pages
207–216. ACM.
Barron, Y., Perry, D., and Stadje, W. (2016). A make-to-
stock production/inventory model with map arrivals
and phase-type demands. Annals of Operations Re-
search, 241(1-2):373–409.
Dobson, A. J. and Barnett, A. G. (2008). An Introduction to
Generalized Linear Models. Chapman and Hall.
Dudin, A., Kim, C., Dudina, O., and Dudin, S. (2016).
Multi-server queueing system with a generalized
phase-type service time distribution as a model of call
center with a call-back option. Annals of Operations
Research, 239(2):401–428.
Dudin, S. A. and Lee, M. H. (2016). Analysis of single-
server queue with phase-type service and energy har-
vesting. Mathematical Problems in Engineering,
2016.
Duong, T., Phung, D., Bui, H. H., and Venkatesh, S.
(2009). Efficient duration and hierarchical modeling
for human activity recognition. Artificial intelligence,
173(7-8):830–856.
Fackrell, M. (2009). Modelling healthcare systems with
phase-type distributions. Health care management
science, 12(1):11.
Faddy, M. and McClean, S. (2005). Markov chain mod-
elling for geriatric patient care. Methods of informa-
tion in medicine, 44(03):369–373.
Fine, S., Singer, Y., and Tishby, N. (1998). The hierarchi-
cal hidden markov model: Analysis and applications.
Machine learning, 32(1):41–62.
Garg, L., McClean, S., Meenan, B., and Millard, P. (2009).
Non-homogeneous markov models for sequential pat-
tern mining of healthcare data. IMA Journal of Man-
agement Mathematics, 20(4):327–344.
Garg, L., McClean, S. I., Barton, M., Meenan, B. J., and
Fullerton, K. (2012). Intelligent patient management
and resource planning for complex, heterogeneous,
and stochastic healthcare systems. IEEE Transactions
on Systems, Man, and Cybernetics-Part A: Systems
and Humans, 42(6):1332–1345.
Gillespie, J., McClean, S., Garg, L., Barton, M., Scotney,
B., and Fullerton, K. (2016). A multi-phase des mod-
elling framework for patient-centred care. Journal of
the Operational Research Society, 67(10):1239–1249.
Griffiths, J. D., Williams, J. E., and Wood, R. (2013).
Modelling activities at a neurological rehabilitation
unit. European Journal of Operational Research,
226(2):301–312.
Haas, P. J. (2006). Stochastic petri nets: Modelling, stabil-
ity, simulation. Springer Science & Business Media.
Jones, B., McClean, S., and Stanford, D. (2018). Modelling
mortality and discharge of hospitalized stroke patients
using a phase-type recovery model. Health care man-
agement science, pages 1–19.
Knight, V. A. and Harper, P. R. (2012). Modelling emer-
gency medical services with phase-type distributions.
Health Systems, 1(1):58–68.
Marshall, A. H. and Zenga, M. (2012). Experimenting with
the coxian phase-type distribution to uncover suitable
fits. Methodology and computing in applied probabil-
ity, 14(1):71–86.
McChesney, I. (2016). Process support for continuous,
distributed, multi-party healthcare processes-applying
workflow modelling to an anticoagulation monitoring
protocol. In International Conference on Ubiquitous
Computing and Ambient Intelligence, pages 255–266.
Springer.
McClean, S., Barton, M., Garg, L., and Fullerton, K.
(2011). A modeling framework that combines markov
models and discrete-event simulation for stroke pa-
tient care. ACM Transactions on Modeling and Com-
puter Simulation (TOMACS), 21(4):25.
Peterson, J. L. (1981). Petri net theory and the modeling of
systems.
Rabiner, L. R. (1989). A tutorial on hidden markov models
and selected applications in speech recognition. Pro-
ceedings of the IEEE, 77(2):257–286.
Tang, X., Luo, Z., and Gardiner, J. C. (2012). Model-
ing hospital length of stay by coxian phase-type re-
Using Phase-type Models to Monitor and Predict Process Target Compliance
89

gression with heterogeneity. Statistics in medicine,
31(14):1502–1516.
Taylor, P. (2015). Autonomic Business Processes. PhD the-
sis, University of York.
Tsoi, A. C., Zhang, S., and Hagenbuchner, M. (2005). Pat-
tern discovery on australian medical claims data-a sys-
tematic approach. IEEE Transactions on Knowledge
& Data Engineering, (10):1420–1435.
Van Der Aalst, W. (2012). Process mining: Overview and
opportunities. ACM Transactions on Management In-
formation Systems (TMIS), 3(2):7.
van der Aalst, W. M., Reijers, H. A., Weijters, A. J., van
Dongen, B. F., De Medeiros, A. A., Song, M., and
Verbeek, H. (2007). Business process mining: An in-
dustrial application. Information Systems, 32(5):713–
732.
Vishnevskii, V. M. and Dudin, A. N. (2017). Queueing sys-
tems with correlated arrival flows and their applica-
tions to modeling telecommunication networks. Au-
tomation and Remote Control, 78(8):1361–1403.
Xie, H., Chaussalet, T. J., and Millard, P. H. (2006).
A model-based approach to the analysis of patterns
of length of stay in institutional long-term care.
IEEE Transactions on Information Technology in
Biomedicine, 10(3):512–518.
Youngblood, G. M. and Cook, D. J. (2007). Data mining
for hierarchical model creation. IEEE Transactions on
Systems, Man, and Cybernetics, Part C (Applications
and Reviews), 37(4):561–572.
ICORES 2019 - 8th International Conference on Operations Research and Enterprise Systems
90
