
Understanding Sprinting Motion Skills using Unsupervised Learning
for Stepwise Skill Improvements of Running Motion
Chanjin Seo
1
, Masato Sabanai
1
, Hiroyuki Ogata
2
and Jun Ohya
1
1
Department of Modern Mechanical Engineering, Waseda University, 3-4-1, Ookubo, Shinjuku, Tokyo, Japan
2
Faculty of Science and Technology, Seikei University, 3-3-1, Kichijoji-kitamachi, Musahino-shi, Tokyo, Japan
Keywords: Running Motion, Unsupervised Learning, Coaching System, Stepwise Skill Improvement.
Abstract: To improve running performances, each runner’s skill, such as characteristics and habits, needs to be known,
and feedback on the performance should be outputted according to the runner's skill level. In this paper, we
propose a new coaching system for detecting the skill of a runner and a method of giving feedback using a
sprint motion dataset. Our proposed method calculates an extracted feature to detect the skill using an
autoencoder whose middle layer is an LSTM layer; we analyse the feature using hierarchical clustering, and
we analyse the human joints that affect the skill. As a result of experiments, five clusters are obtained using
hierarchical clustering. This paper clarifies how to detect the skill and to output feedback to achieve a level
of performance one step higher than the current level.
1 INTRODUCTION
Receiving appropriate guidance based on objectively
evaluated performance in rehabilitation and sports
practice is important for learners to improve their skill.
In particular, it is essential for a guidance system to
output feedback on their improvement so that learners
can efficiently improve their skill. Traditionally, such
feedback has relied on the professional experience of
medical and sports experts. Nowadays, emerging
technologies such as deep learning (DL) and image
processing have made it possible to use computerized
coaching systems that are able to obtain information
from sensors and analyze it to give objective feedback.
The advantage of a computerized coaching system is
not only the ability to objectively evaluate the learner's
performance but also to help the learner to improve
their skill. Implementing such a coaching system may
be helpful for human performers.
In this paper, we propose a coaching system that
addresses the problem of enhancing sprinting
performance effectively by offering feedback in a step-
by-step manner. Section 2 describes work related to
objectively evaluating performance. In Section 3, we
explain the requirements for the coaching system, as
described above, and our proposed methods. Then,
experiments on exercise behaviour and experimental
results are presented in Section 4. We discuss the
experimental results in Section 5 and conclude the
paper in Section 6.
2 RELATED WORK
Many systems that automatically evaluate exercise
motion using sensors and output a score based on the
performance level have been presented in the literature.
As an example in the field of sports, Pirsiavash et al.
proposed a system that can automatically evaluate
performance in diving and figure skating. They used
performances from videos recorded during Olympic
games. Their method predicts the score given by
referees from the movement of the performer’s joints,
and also outputs feedback for the joint positions that
need to be improved in case of a performance with a
low score. They used a discrete cosine transformation
(DCT) matrix to extract features from the movement of
the performer’s joints. In other work, Venkataraman et
al. used Cross Approximate Entropy (XApEn) instead
of DCT and applied supervised learning to Pirsiavash
et al.’s dataset. Venkataraman et al. claim that XApEn
extracts better features than DCT.
In the healthcare field, Parmar et al. presented a
method for evaluating exercises for physical therapy:
for example, the Blastoff exercise. Here, the
practitioner’s performance is indicated by a “good” or
Seo, C., Sabanai, M., Ogata, H. and Ohya, J.
Understanding Sprinting Motion Skills using Unsupervised Learning for Stepwise Skill Improvements of Running Motion.
DOI: 10.5220/0007358804670475
In Proceedings of the 8th International Conference on Pattern Recognition Applications and Methods (ICPRAM 2019), pages 467-475
ISBN: 978-989-758-351-3
Copyright
c
2019 by SCITEPRESS – Science and Technology Publications, Lda. All rights reserved
467
“bad” outcome using a support vector machine (SVM).
In the medical field, Zia et al. introduced a system for
assessing surgical skill using robot kinematics data in
Robot-Assisted Minimally Invasive Surgery (RMIS)
training, to address the problem of enhancing surgical
skill. Their method involves not only predicting scores
for surgical skill, but also classifying the skill into three
levels: novice, intermediate and expert.
In general, the above methods cannot handle features
that are involved in determining the performer’s skill,
such as a habit. Therefore, we use unsupervised
learning because this approach can classify each
performer’s skill without the necessity of knowledge
about the performance.
3 PROPOSED METHOD
3.1 Basic Idea and Strategy
The skill of a person performing an exercise motion
cannot be represented by a one-dimensional evaluation
axis, such as the quality of the performer. We believe
that it could be represented by multi-dimensional
evaluation axes composed of many abilities, such as
body flexibility, agility of action, etc. Additionally, an
ideal exercise motion is not composed of only one
pattern, but has multiple patterns. From this viewpoint,
target skills could be represented by peaks (local
optimal solutions) when it is evaluated with multi-
dimensional evaluation axes. For example, in case of a
sprinter’s running form, the peak changes to fit the
various aspects of different running forms, such as step
frequency type or stride length type during sprinting.
In particular, the peak is decided according to each
person’s skill, such as the individual’s talent,
characteristics and habits. With the systems in the
related work described above, it can be difficult to
improve the performance because these systems output
an improvement which is not possible to fit each
person’s skill; therefore, we consider that, to improve
performance, it is necessary to know each person’s
skill. We believe that the performers should improve
their skill by following a plan that leads to a higher
level of skill than the current level. The reason is that
this plan is easier and more efficient for them than a
plan that involves directly improving their skill so as to
achieve a peak. Therefore, the coaching system we aim
to develop should be improved step-by-step in
accordance with the performance achieved after each
performer have understood their skill, rather than to
improve the performance so as to simply indicate a
difference in skill after analysing the difference
between bad performers and good performers.
Second, we think that the feedback given to improve
a performance should not include all of the joints that
must be improved, as opposed to Pirsiavash et al.’s
method, because this is generally difficult. The method
of Parmar et al. could only evaluate whether a
performance was right or wrong. Also, the method of
Zia et al. could evaluate a performer’s skill, such as a
low or high level, because they could use the result of
evaluating scores to judge the level of skill in surgical
techniques. However, these two studies did not
propose how to improve the skill of unskilled
performers. In general, we assume that the above
systems that objectively evaluate performance could
not understand the performer’s skill and could not
improve it step-by-step by considering the perfo-
rmer’s skill level.
In outline, our approach for improving performance
step-by-step to a peak is quite different from the
approaches in the related work described above for
directly improving performance to an optimal solution.
Against this background, we propose a new coaching
system based on the following approach: 1) Extract
features of exercise behavior of performers and
recognize the skill of the performers using these
features; 2) Determine a peak that fits their skill in
order to improve the performance; and 3) Output
advice for stepwisely improving the skill level to
achieve the peak. In this paper, we focus on how to get
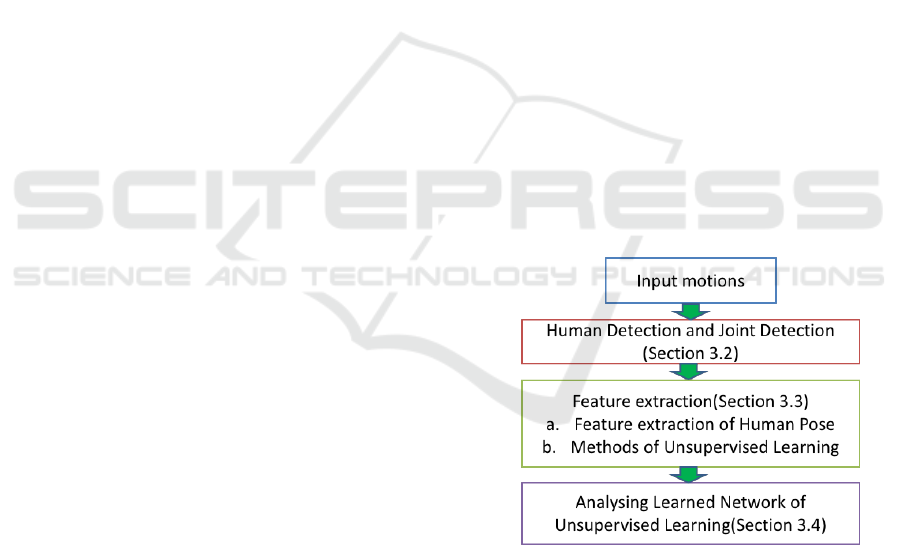
the features of skill and to understand it.
Figure 1: Outline of our proposed method.
Our system uses unsupervised learning because we
hypothesize that similar skill levels in performances
form clusters, and those clusters lead to an
understanding of the character of the performances
As a prerequisite, using unsupervised learning is more
accurate and results in higher reproducibility than
classifying the performances based on an expert’s
experience. Therefore, our coaching system uses
unsupervised learning.
ICPRAM 2019 - 8th International Conference on Pattern Recognition Applications and Methods
468
In Section 3.2, we explain a method of detecting
human joints in a video of running motion. In Section
3.3, we describe a method of learning an autoencoder,
which is one kind of unsupervised learning. In Section
3.4, we clarify Cluster Analysis to use the features
calculated by the autoencoder. Finally, we verify the
feature of the clusters calculated after cluster analysis.
Figure 1 shows outline of our proposed methods.
3.2 Human Detection and Joint
Detection in a Video
To detect a human in a video of a human perfo-rmance,
it is possible to use higher object detection’s methods.
We chose YOLOv3 (Redmon et al., 2018) because it
is ideal for use in detecting running motion while
maintaining high accuracy and achieving real-time
processing speed.
As the method of human joint detection, we chose the
network of Chu et al. There are several reasons for this.
First, the method of Newell et al. has the same problem
that occurs in false detection, namely, that the right and
left joints of the lower limbs are swapped, and this
works as noise, which leads to unsuccessful results
using a training dataset. Last, the method of Yang et al.
is much more accurate than that of Chu et al. using the
MPII dataset (Andriluka et al., 2014), but Chu et al.’s
network gives more false detections than Yang et al.’s
network with our data. Therefore, we used Yang et
al.’s network in order to stabilize the detection of
human joints.
3.3 Feature Extraction
Given a video, we propose a method of unsupervised
learning for extracting generic features of running
motion based on the detected joints using Yang et al.’s
network.
Feature Extraction of Human Pose: Let
and
be the x component of the j-th joint and head
position in the t-th frame of the video, respectively. We
normalize the vector given by subtracting the head
position from the j-th joint position:
(1)
Eq. (1) is similar to Pirsiavash et al.’s method, but our
method can calculate similar features in the
performance of each person even if they have different
physical constitutions, such as their height.
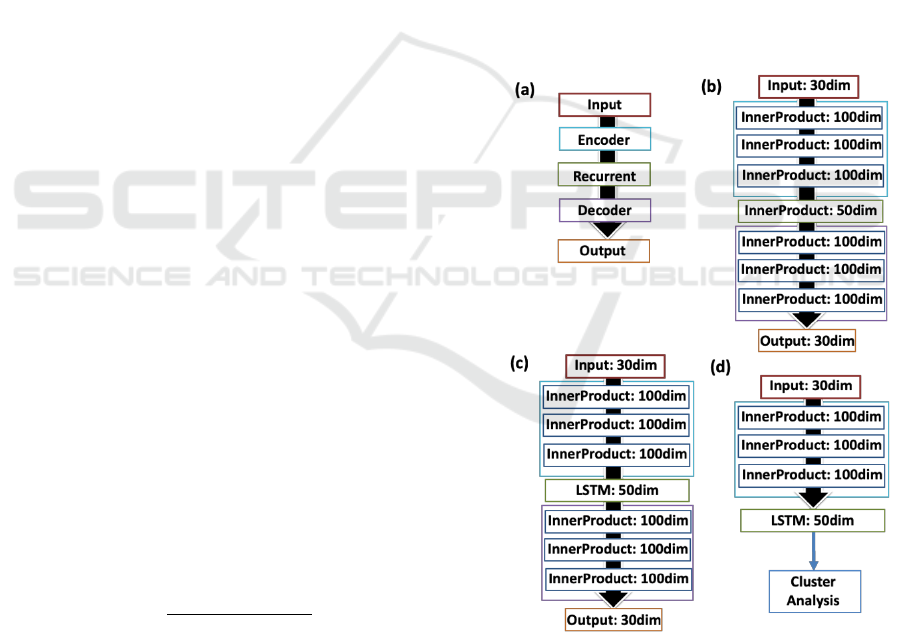
Network Structure: Our network is based on an
autoencoder structure, which was used as the LSTM
layer in the middle layer, such as ERD (Fragkiadaki et
al., 2015). Those networks have traditionally been used
to generate and predict human motions.
We use the network with the structure in Fig. 2(b) and
Fig. 2(c). As shown in Fig. 2(b), the input layer and
output layer have 30 dimensions, and the inner product
layer has 100 dimensions in the part of the Encoder
layer and the Decoder layer. The middle layer has 50
dimensions. We use Euclidean distance for the loss
function on the features using Eq. (1) between the
output data and the input data. We train our model with
stochastic gradient descent(SGD), using the Caffe (Jia
et al., 2014) package. Second, we change the middle
layer to an LSTM layer, as shown in Fig. 2(c), and we
do transfer learning to use the model in Fig. 2(b) and
use same loss function using Fig. 2(b). We train our
model with SGD and backpropagation through time
with momentum and the gradient clipping set at 60.
After the network has learned, we perform hierarchical
clustering for the features obtained from the Encoder
layer and the LSTM layer to verify classification by
unsupervised learning, as shown in Fig. 2(d).
Figure 2: Network Structures: (a) ERD structure; (b) likely
autoencoder structure; (c) used as LSTM layer in the middle
layer of ERD by (a). (d) The structure for analysing running
motion after learning was done in (b).
Understanding Sprinting Motion Skills using Unsupervised Learning for Stepwise Skill Improvements of Running Motion
469
3.4 Algorithm for Analysing Learned
Network
To analyze how the input affects the output in DL, it is
important to verify which element of the input is
related to the output of the learned network. In this
paper, the degree of influence of the input on the output
in DL is called the contribution degree of input values
(CDIV).
The methods of Zhou et al. and Selvaraju et al. both
involve calculating the CDIV. Both methods visua-lize
the degree of influence of a pixel of the input image on
the output using a heatmap for the model of supervised
learning of image classification by DL. Their CDIV
can help for analysing features which is obtained by
supervised learning to understand what inputs have an
influence in the features. We suppose that they do not
use only the features obtained by supervised learning,
but also we suppose those methods use the feature
obtained by unsupervised learning. In fact, we used the
CDIV to verify each cluster in the cluster analysis
described later Fig. 3(c), and our proposed method is
simpler to calculate it than the methods of Zhou et al.
and Selvaraju et al. This can help to verify the skill of
an individual, which is obtained by unsupervised
learning, in exercise behavior in each cluster after the
cluster analysis in Fig. 2(d).
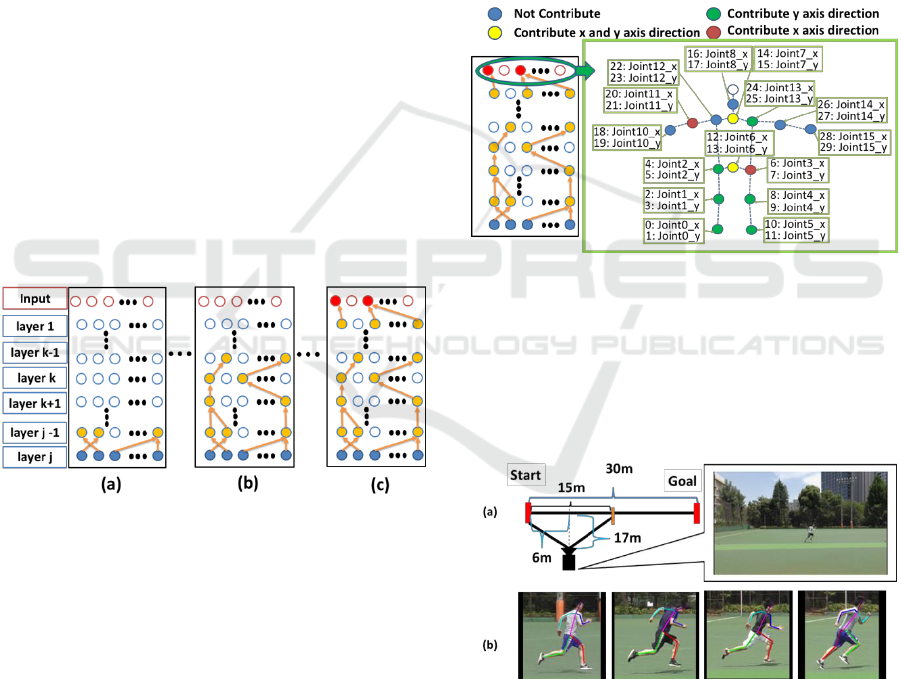
Figure 3: Outline of the CDIV in our method: The method
can calculate the principal input for the output which can be
found easily by tracing the nodes.
To calculate the CDIV, we propose a simpler method
than the conventional methods using the weight of the
last layer(j-th layer in Fig. 3) in the network and the
gradient of the learned model in the network. First, as
shown in Fig. 3 (a), we find a node in (j-1)-th layer that
has the most influence on the j-th layer. Second, we
give 1 point to the most influential node in the (j-1)-th
layer, and we give 0 points to the other nodes. This
operation is performed on all nodes in the (j-1)-th layer.
After scoring all nodes in the (j-1)-th layer, we exclude
the nodes that have 0 points or that were not activated
in the (j-1)-th layer, as shown in Fig. 3(a). For the
remaining nodes, we perform operations similar to
those performed on the (j-1)-th layer in the (j-2)-th
layer. Third, we repeat the same operations as shown
in Fig. 3(b) until it reaches the input layer. Last, we can
calculate the node of the input contribution in the
network, as shown in Fig. 3(c). Our method has the
advantage that the principal input for the output can be
found easily by tracing the nodes. In our case, the
CDIV leads to knowing not only the joints contributing
to the performance for each person but also the
direction in which the joints contribute.
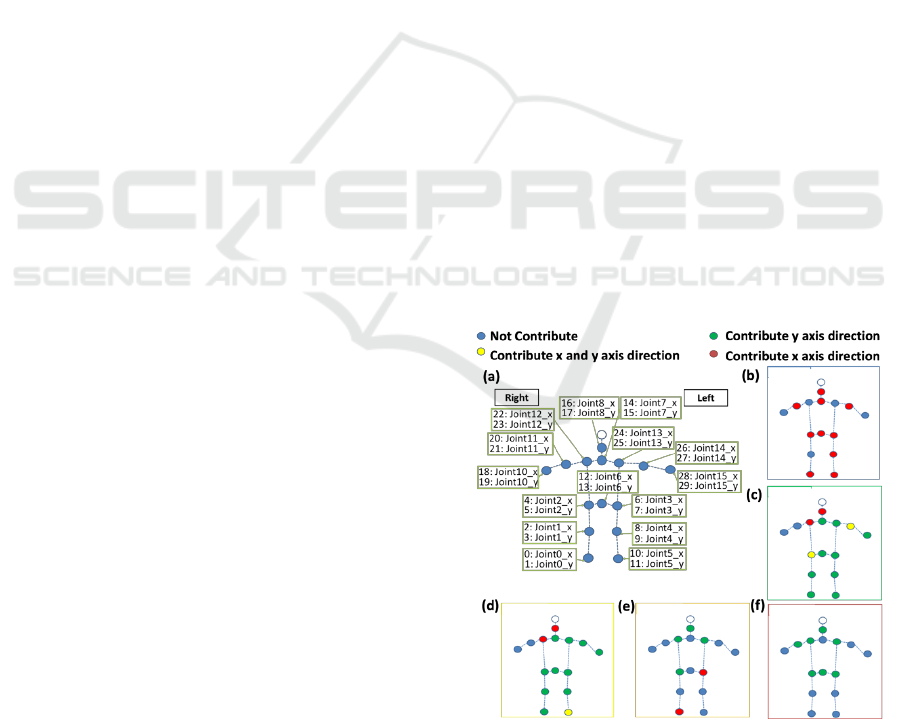
Figure 4 visualizes the input contribution in human
joints using the calculated CDIV result in Fig. 3(c).
This can help to verify skill of an individual in exercise
behavior in each cluster after the cluster analysis in Fig.
2(d).
Figure 4: Visualization of CDIV in human joints: We
visualize the CDIV of human joints in order to understand the
skill of a human performance. Blue color’s node is expressed
as not contributing to the motion. Green one is expressed as
contributing to the motion in the x-axis direction. Red one is
expressed as contributing to the motion in the y-axis
direction. Yellow one is expressed as contributing to the
motion in the x-axis and y-axis direction.
Figure 5: Sprint Dataset: (a) experimental conditions for
creating our dataset; (b) sample frames in our dataset.
4 EXPERIMENTS
In this section, we introduce the dataset used in the
experiments and present the experimental results
obtained using the method in Section 3.
ICPRAM 2019 - 8th International Conference on Pattern Recognition Applications and Methods
470
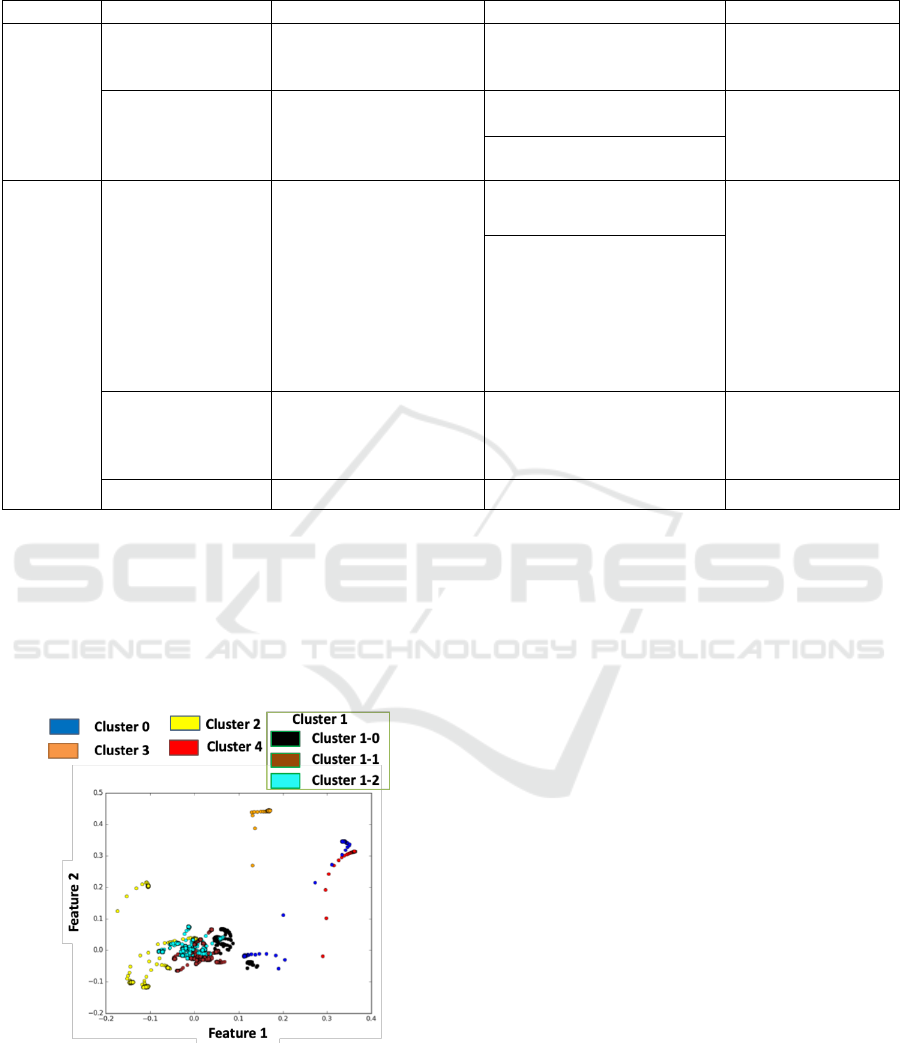
Table 1: Observational motion evaluation items concerning running motion in sprinting: These evaluation items can be
evaluated for performers by keeping scores.
Body Part
Evaluation Point
20
10
0
Upper
Limb
Putting the elbow
forward
The elbow moves forward
by a large amount before
the body side.
The elbow moves slightly
forward before the body .
The elbow does not
go forward before
the body.
Bending the elbow
Hold the elbow bent while
swinging
The elbow stretches forward
or backward.
Hold the elbow bent
and stretched while
swinging.
Bend the elbow to hook arm
in front of body.
Lower
Limb
Size of lower limb
movement
It can be seen that the
knee of the swinging leg
moves forward by large
amount, and the leg
swings back just below
the body.
The swinging leg is swings
weakly in running motion.
The forward
swinging of the
swinging leg and the
extending of the
knee are very small,
and flight duration is
extremely short.
There is no swing back of the
swinging leg in the direction
directly beneath the body, and
the foot of the swinging leg is
touching the ground
immediately before going in
front of the swinging leg .
Switching of legs
The swinging leg
overtakes the supporting
leg almost at the same.
The swinging leg over-takes
the supporting foot
immediately after touching
the ground.
The swing leg
slowly overtakes the
supporting leg by
touching the ground.
Foot on the ground
Ground of the thenar part.
Ground of the sole of the foot.
Ground of the heel.
4.1 Running Motion Dataset
It is difficult to evaluate our proposed system for
datasets such as that used by Pirsivash et al., which
cannot be evaluated without professional skills, but
our system needs a dataset in order to be used by per-
Figure 6: Visualization of Hierarchical Clustering Result
using PCA: We visualize the feature of all running motion
using PCA. A color and a cluster correspond as shown in
the upside.
sons even without professional skills. From this
viewpoint, the running motion in sprinting was
applied to our system; this was optimal also in that it
was easy to determine the individual’s characteristics
and habits during running. Therefore, we chose
running motion as our target.
Our dataset consists of mostly subjects who had no
experience of athletics. The reason for this is that we
judged that this is essential for the introduction of our
study to verify how a performer’s skill could lead to
stepwise improvements in a performance that is
evaluated as imperfect. For example, if we used the
data of top sprinters, we would not be able to discover
imperfect performances, because it would not be
possible to evaluate top sprinters using only the joint
motion we propose, and we would have to use the
joint motion and other information, such as
information from myoelectric sensors, if we want to
evaluate their performance. Therefore, such an appr-
oach is not suitable for ascertaining the advantages of
our system, so we gathered data mostly from test
subjects having no experience of athletics.
We collected data from 14 healthy subjects (13 male
and 1 female, aged 23-31 years old) by measuring
running motion when they ran 30 m at full speed. As
the experimental conditions, the video camera was
placed at the position shown in Fig. 5(a) so that the
range from 0 m to 15 m appeared in the videos. The
reason for taking the video in this range is that the
Understanding Sprinting Motion Skills using Unsupervised Learning for Stepwise Skill Improvements of Running Motion
471
starting motion makes a large contribution to the total
running time. Thus, we focused on improving the
starting motion, which is considered to lead to
improve running skill. On the other hand, we used a
video camera capable of capturing video at 60 frames
per second when the subject was running. At the same
time, we measured the time taken to run 30 m. Each
subject was asked to run 4 to 6 times, and we captured
71 videos. We used the videos to detect human joints
using the method described in Section 3.1, as shown
Fig. 5(b), and to analyze the detected joints using the
methods described in Section 3.2 and Section 3.3.
In addition, as for the scoring related to the running
motion, a person having experience of springing in
athletics was asked to keep scores for the subjects
using the evaluation items shown in Table 1 every one
cycle. Here, one-cycle is defined as the period from
when the supporting leg leaves the ground until the
opposite foot reaches the ground. In preparing these
evaluation items, we referred to the work Suzuki et
al. Their evaluation items were targeted at elementary
school students in Japan, but we considered that there
would be no problem even if we used them to evaluate
adults because they referred to many studies on
sprinting by athletes and non-athletes in the creation
of these items.
4.2 Result of Cluster Analysis
We shows the visualization of the features in the
running motion using the method of Section 3.4 based
on Principal Component analysis (PCA). As a result
of performing hierarchical clustering on this feature,
we found that there are roughly 5 clusters, as shown
in Fig. 6. In particular, Cluster 1, which has the largest
number of subjects among the 5 clusters, was divided
into another three clusters (sub-clusters), as shown in
Fig. 6. We discuss the feature of each cluster in
Section 5.
5 DISUCUSSION
5.1 Discussion of Results of Cluster
Analysis
We verified the validity of the 5 clusters obtained in
Section 4 by comparing the CDIV described in
Section 3.4 with the evaluation method in Table 1.
Figure 7(a) shows the joint ids in the MPII dataset
(Andriluka et al., 2014), and Fig. 7(b)-(f) show the
CDIV in each cluster. At this time, the contributed x-
axis direction of the CDIV is the forward moving
direction of the subject, and the contributed y-axis
direction of the CDIV is the upward direction of the
subject. Table 2 shows the average of the scores and
the standard deviation of the score for each cluster by
scoring the running motion using Table 1.
According to Fig. 7(b), the subjects in Cluster 0 had
all joints contributing to the motion in the x-axis
direction for the upper limbs and left lower limbs, and
it is considered that the thrust during running was
higher than the subjects in the other clusters. In fact,
Table 2 shows that the average value of the scores was
higher than those of the other clusters. As seen in Fig.
6, overwhelmingly most of subjects belonged to
Cluster 1, and the standard deviation of Cluster 1 was
also large. Figure 7(c) shows a visualization of the top
15 joints that contribute most to the running motion
in Cluster 1, and we know that this cluster can be
divided into another 3 clusters based on the results in
Section 4.2. Since the features of these 3 clusters are
important for Cluster 1, they are explained in detail
later. According to Fig. 7(d), the subjects in Cluster 2
had a larger number of joints contributing to motion
in the y-axis direction. In particular, all the inputs of
the lower limbs contributed to the running motion in
the y-axis direction. Hence, it is considered that there
is a tendency for inefficient running motion in which
the lower limb moves more in the upward and
downward directions compared with the other
clusters. Actually, the average value of the score in
Cluster 2 was small, as shown in Table 2, and this was
due to the lower scores for the items related to lower
limbs in Table 1. Cluster 3 was occupied by one
subject.
Figure 7: Visualization of the CDIV in each cluster: (a) The
indexes of the joints based on the MPII dataset. (b) CDIV
of Cluster 0. (c) CDIV of Cluster 1. (d) CDIV of Cluster 2.
(e) CDIV of Cluster 3. (f) CDIV of Cluster 4.
ICPRAM 2019 - 8th International Conference on Pattern Recognition Applications and Methods
472
According to Fig. 7(e), the CDIV of this subject was
contributed to by the right hip joint in the x-axis
direction and the left hip joint in the y-axis direction.
We can only evaluate usual running based on Table
1. As we checked the running record of the subject in
our experiment, the features were calculated when the
subject in Cluster 3 started to run prematurely.
Therefore, it can be presumed that this cluster
indicated the characteristics of the premature start.
Cluster 4 was occupied by one subject too.
According to Fig. 7(f), the CDIV of this subject was
contributed to by the part from the hip joint to the
upper limb. It is thought that there is a tendency for
inefficient running motion, like Cluster 2, but this
running motion was evaluated based on usual running
as specified in Table 1. However, we know that the
running time for the subject in Cluster 4 was the
slowest in his running times that he ran in the
experiments. We consider that something that cannot
be measured using the evaluation items in Table 1 can
be detected by unsupervised learning, and the cause
could be identified by analysing the CDIV of the
learned network.
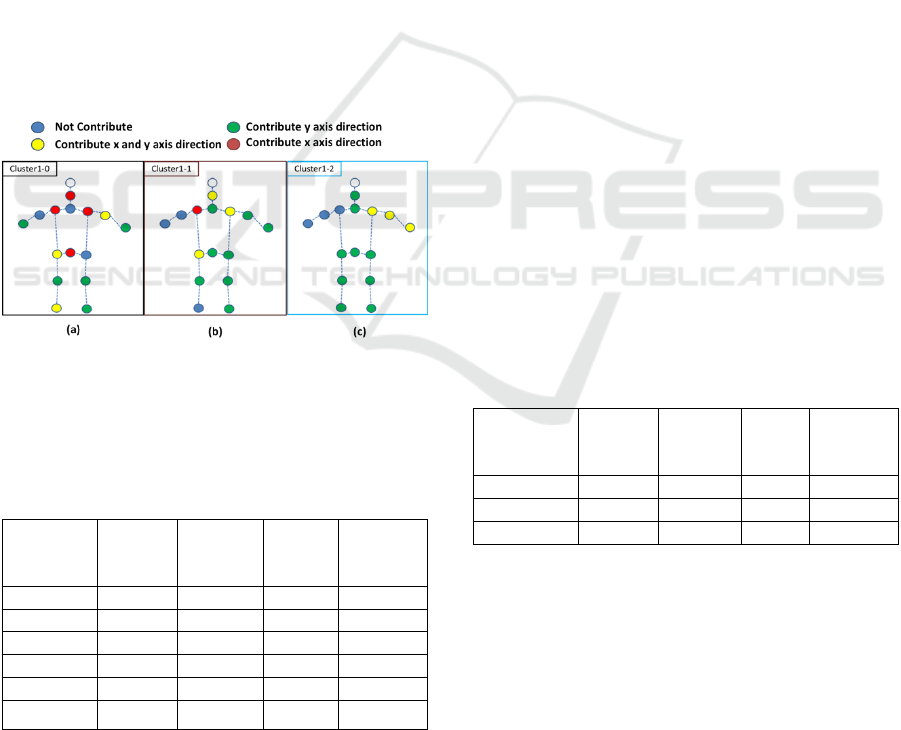
Figure 8: Visualization of the CDIV of human joints in each
cluster in Cluster 1: (a) CDIV of Cluster 1-0. (b) CDIV of
Cluster 1-1. (c) CDIV of Cluster 1-2.
Table 2: The basic information in each cluster: the number
of people, number of frames, mean score, and standard
deviation of score in each cluster.
Number
of
People
Number
of
frames
Mean
Score
Standard
deviation
of Score
Cluster 0
2
323
58.08
16.95
Cluster 1
66
10810
49.60
15.68
Cluster 2
6
1009
47.24
10.12
Cluster 3
1
165
54.79
10.13
Cluster 4
1
157
47.58
11.08
Total
76
12464
49.56
22.57
Next, we discuss the three clusters in Cluster 1.
Figure 7 shows the CDIV of human joints in each
cluster. Table 3 shows the average of the scores and
the standard deviation of the score for each cluster,
obtained by scoring the running motion using Table
1. According to Fig. 8(a), Cluster 1-0 has a larger
number of joints contributing to motion in the x-axis
direction. From this, it is thought that the thrust during
running is higher than the other clusters. In fact,
groups with slightly higher scores are included in
Cluster 1-0, as shown in Table 3. According to Fig.
8(b), Cluster 1-1 has a small number of joints
contributing to motion in the x-axis direction
compared with Cluster 1-0. In Table 3, this is
considered to be a normal level for running motion
since the scores are distributed around the score of
51.35. According to Fig. 8(c), Cluster 1-2 is consider-
ed to be inefficient running motion in that it has a
larger number of joints contributing to motion in the
y-axis direction, as shown in Cluster 2. Actually, the
score in Table 1 also has the lowest average value in
the other clusters, as shown in Table 3. As a whole, it
can be ascertained from Fig. 8 that Cluster 1 tends to
have a higher number of joints contributing to motion
in the y-axis direction, leading to a lower score, and a
higher number of joints contributing to motion in the
x-axis direction, leading to a higher score.
From the above, it is considered that the clusters
obtained by unsupervised learning had validity in that
they can be understood from the evaluation items in
Table 1. In addition, it can be considered that, for
achieving skill in running motion, a feature that
analyses the skill of running motion using the CDIV
and the evaluation items in Table 1 could be detected
by cluster analysis.
Table 3: The basic information in each sub-cluster in
Cluster 1: number of people, number of frames, mean score,
and standard deviation of score in each cluster.
Number
of
People
Number
of
frames
Mean
Score
Standard
deviation
of Score
Cluster 1-0
6
981
59.88
15.57
Cluster 1-1
29
4686
51.35
14.65
Cluster1-2
31
5143
46.04
15.47
5.2 Method of Feedback
As the method of feedback, we focus on the fact that
each cluster in Cluster 1 is divided into the step-by-
step clusters in Table 3. We believe that the subjects
can improve their skill by aiming at other skills which
are higher than the skill they possess. For example, a
subject in Cluster 1-2 aims to achieve the CDIV of
Cluster 1-1, which is one step higher, and the subject
in Cluster 1-1 aims to achieve the CDIV of Cluster 1-
0, which is one step higher too. Therefore, with the
Understanding Sprinting Motion Skills using Unsupervised Learning for Stepwise Skill Improvements of Running Motion
473

improved skill, it may be possible to achieve a skill
that is one step higher than the current skill. However,
this method is not perfect because we cannot confirm
it. For this reason, we would like to conduct other
experiments in order to verify our method using the
results obtained in this paper.
5.3 Remaining Issues
It is difficult to find a peak of each cluster, which is
aimed at improving running motion, because the peak
is not clear using our dataset alone. In other words,
we do not know which direction is the peak for the
subjects to improve the skill of their running motion.
We believe that this problem can be solved to
improve the running motion by not only subjects who
have no experience of athletics but also subjects who
have experience of athletics. The reason is that, using
our method, the running motion of experienced
people may be a peak that is a few steps higher than
that of non-experienced people, and their motion may
be the peak for the motion of non-experienced people
in the same cluster .
Second, in this paper, we evaluate the running
motion using the evaluation items in Table 1, but it
will be necessary to automatically output a score for
running motion in the future. For this reason, it is
possible to find the score for a performance one step
higher than the current one in the same cluster. In
particular, the evaluation items in Table 1 focus only
on the upper limbs and lower limbs, yet other items
are needed, such as a forward-bent posture, which is
important in running motion. We plan to expand these
items by using a method such as dynamically
analysing each cluster’s features obtained as describ-
ed in Section 3.3.
6 CONCLUSIONS
This paper has proposed a system that can let the
viewer understand the skill of a performer and can
output feedback for achieving one step higher
performance aimed at by the performer. Among them,
we proposed CDIV as a method for analysing the
input component of the features obtained by an
autoencoder in which the middle layer is replaced
with an LSTM layer. From the CDIV, the validity of
the running skill, in which five clusters were obtained
by hierarchical clustering, was confirmed by
comparing with the evaluation items in Table 1. In
addition, we showed the possibility of detecting skill
involving aspects such as the individual’s charact-
eristics. Then, we demon-strated the possibility of a
method of feedback for improving the performance to
a level one step higher than the current one using the
CDIV of each cluster in Cluster 1.
As the future work, we will further clarify the skill
of running motion by adding the running motions of
experienced athletes. Also, we will improve the
evaluation items by dynamically analysing the runn-
ing motion in each cluster. Moreover, we would like
to conduct other experi-ments in order to verify our
method.
ACKNOWLEDGEMENTS
This study was part of research activities of the
Human Performance Laboratory, Organization for
University Research Initiatives, Waseda University.
REFERENCES
Andriluka, M., Pishchulin, L., Gehler, V. P. and Schiele, B.,
2014. 2D human pose estimation: New benchmark and
State of the Art Analysis. In the IEEE Conference on
Computer Vision and Pattern Recognition(CVPR),
3686-3693.
Chu, X., Yang, W., Ouyang, W., Ma, C., Yuillw, L. A. and
Wang, X., 2017. Multi-Context Attention for Human
Pose Estimation. In the IEEE Conference on Computer
Vision and Pattern Recognition(CVPR), 1831-1840.
Fragkiadaki, K., Levine, S., Felsen, P. and Malik, J., 2015.
Recurrent Network Models for Human Dynamics.
International Conference on Computer Vision(ICCV),
4346-4354.
Jia, Y., Shelhamer, E., Donohue, J., Karayev, S., Long, J.,
Girshick, R., Guadarrama, S. and Darrell, T., 2014.
Caffe: Convolutional architecture for fast feature
embedding. arXiv:1408.5093.
Newell, A., Yang, K. and Deng, J., 2016. Stacked
Hourglass Networks for Human Pose Estimation.
arXiv:1603.06937.
Parmar, P. and Morris, T. B., 2016. Measuring the quality
of exercises. In IEEE International Conference
Engineering in Medicine and Biology Society, 556-
571.
Pirsiavash, H., Vondrick, C. and Torralba, A., 2014.
Assessing the Quality of Actions. European Conference
on Computer Vision(ECCV), 556-571.
Redmon, J. and Farhadi, A., 2018. YOLOv3: An
Incremental Improvement. arXiv:1804.02767.
Selvaraju, R. R., Cogswell, M., Dasm, A., Vedantam, R.,
Parikh, D. and Batra, D., 2017. Grad-Cam: Visual
Explanations from Deep Network via Gradient-based
Localization. International Conference on Computer
Vision(ICCV), 618-626.
Suzuki, Y., Tomozoe, H., Yoshinaga, T. Kaji, M. and
Hirayama, K., 2016. Shissou dousa no
ICPRAM 2019 - 8th International Conference on Pattern Recognition Applications and Methods
474

kansatutekidousahyoukahouni kansuru kenkyuu(Study
on the observed behavior evaluation method of
sprinting action). Japan Journal of Physical Education,
Health and Sport Sciences, 32(1), 1-20.
Venkataraman, V., Vlachos, I. and Turaga, K. P., 2015.
Dynamical Regularity for Action Analysis. In
Proceeding of the British Machine Vision
Conference(BMVC), 67.1-67.12.
Yang, W., Li, S., Ouyang, W., Li, H. and Wang, X., 2017.
Learning Feature Pyramids for Human Pose
Estimation. International Conference on Computer
Vision(ICCV), 1281-1290.
Zia, A. and Essa, I., 2017. Automated Surgical Skill
Assessment in RMIS Training. arXiv:1712.08604.
Zhou, B., Khosla, A., Lapedriza, A., Oliva, A. and Torralba,
A., 2016. Learning Deep Features for Discriminative
Localization. In the IEEE Conference on Computer
Vision and Pattern Recognition(CVPR), 2921-2929.
Understanding Sprinting Motion Skills using Unsupervised Learning for Stepwise Skill Improvements of Running Motion
475
