
Feature Extraction of Epileptic EEG in Spectral Domain via Functional
Data Analysis
Shengkun Xie
1
and Anna Lawniczak
2
1
Ted Rogers School of Management, Ryerson University, Toronto, Canada
2
Department of Mathematics and Statistics, University of Guelph, Guelph, Canada
Keywords:
Functional Data Analysis, Power Spectrum, Functional Principal Component Analysis, EEG, Epilepsy
Diagnosis.
Abstract:
Functional data analysis is a natural tool for functional data to discover functional patterns. It is also often
used to investigate the functional variation of random signals. In this work, we propose a novel approach by
analyzing EEG signals in the spectral domain using functional data analysis techniques including functional
descriptive statistics, functional probes, and functional principal component analysis. By first transforming
EEG signals into their power spectra, the functionality of random signals is greatly enhanced. Because of this
improvement, the application of functional data analysis becomes meaningful in feature extraction of random
signals. Our study also illustrates a great potential of using functional PCA as a feature extractor for EEG
signals in epilepsy diagnosis.
1 INTRODUCTION
Feature extraction of high dimensional data has been
an important research area in machine learning (Bou-
veyron et al., 2007; Kriegel et al., 2009; Yu and Liu,
2003; Jimenez and Landgrebe, 1998). It aims at ob-
taining a set of key features, so that, the complexity
of data classification can be greatly reduced. Ideally,
in feature extraction, one looks for a highly separable
feature vector as an input for the classification prob-
lem. However, the degree of inseparability signifi-
cantly affects the choice of a classification method.
If the extracted features are either linearly or non-
linearly separable, there is no extra effort needed to
select a suitable classification method. In biomedi-
cal signal classification (such as EEG or ECG classi-
fication), due to its high dimensional nature, feature
extraction of the given signals is often the most im-
portant step to meet the success of classification (Al-
ickovic et al., 2018; Truong et al., 2017; Fergus et al.,
2016). After the feature vector is obtained, a classi-
fication method such as linear discriminate analysis
(LDA), k-nearest neighbor (KNN), or support vector
machines (SVM) is then applied to determine a group
membership.
In many real-world applications of biomedical
signal classification (Qazi et al., 2016; Li et al., 2005;
Phinyomark et al., 2012; Gandhi et al., 2011; Subasi
and Gursoy, 2010), a low dimensional and linear or
non-linearly separable feature vector is highly desir-
able for both, the ease of data visualization in med-
ical devices and a possibility of using a simple clas-
sification method, such as a linear classifier or the k-
nearest neighbor method. To meet this goal, there is a
lot of current research focusing on feature extraction
of signals in the time domain using sparse represen-
tation of signals (Zhang et al., 2015). This type of
research aims at extracting a low dimensional feature
vector through sparse decomposition of signals and
improvement of the linear or non-linear separability
by selecting its most discriminative features. Often
the first goal is easy to achieve by enforcing the spar-
sity on signal approximation, but it is more difficult to
make a set of good features, which are linearly or non-
linearly separable. Among many published research
works, the time-frequency decomposition technique
is the most popular within this type. It decomposes
the signal in terms of time and frequency domain
components. By doing time-frequency domain de-
composition, the separability of signals is greatly im-
proved. The classification is then based on extracted
features in time and frequency domains, which are the
coefficients of the selected time-frequency basis func-
tions (Nyan et al., 2006; Garcia et al., 2003).
Functional data analysis (FDA) is a natural tool
for studying functional data, such as images, temper-
118
Xie, S. and Lawniczak, A.
Feature Extraction of Epileptic EEG in Spectral Domain via Functional Data Analysis.
DOI: 10.5220/0007353301180127
In Proceedings of the 8th International Conference on Pattern Recognition Applications and Methods (ICPRAM 2019), pages 118-127
ISBN: 978-989-758-351-3
Copyright
c
2019 by SCITEPRESS – Science and Technology Publications, Lda. All rights reserved

ature data, or growth curves (Ramsay, 2005; Wang
et al., 2016; Ramsay and Silverman, 2007). This is
due to the existence of stable, and highly observable
deterministic patterns contained in the data, as a part
of the key signal features. When data is functional
in nature and discriminative, a set of coefficients of
basis functions can be obtained by signal representa-
tion using common basis functions. From statistical
point of view, this belongs to a functional regression
problem, and it is usually addressed by an ordinary
least square method or a regularization based least
square method. The classification of signals can be
done by classifying the extracted coefficients obtained
from signal representation using basis functions. On
the other hand, FDA allows us to investigate the func-
tional variation at various levels. This creates another
layer of feature extraction by further looking at the de-
composition of data variation. When random signals
are not functional in nature, the application of FDA
may not be successful. In theory, a random signal can
be represented in terms of a linear combination of in-
finite basis functions. This essentially allows applica-
bility of using FDA for random signals. However, for
decomposition of random signals, the coefficients of
basis functions, from signal to signal, are often highly
volatile, due to the fact that the signals are lacking
functional nature. The classification of extracted fea-
tures may be difficult due to high variability, high di-
mensionality and lack of separability of the features.
This may call for a novel approach in order to improve
the functionality of random signals in a given domain.
In this work, we propose a novel approach and
illustrate it by analyzing EEG signals in the spec-
tral domain using functional data analysis techniques
including functional descriptive statistics, functional
probes and functional principal component analysis.
We first transform EEG signals into power spectra to
improve the functionality of EEG signals. We then
use functional PCA to extract signal features. We also
demonstrate the application of the proposed method
for epilepsy diagnosis (Lima et al., 2009; Liang et al.,
2010). The significance of this work is the novelty of
the proposed method and the achieved high separabil-
ity of the considered data, as well as the high applica-
bility of the method to other types of signals such as
financial time series and long-term observational eco-
nomical data for classification or pattern recognition
problems. Unlike the regular use of functional princi-
pal component analysis, which aims at either estimat-
ing the functionality or capturing functional data vari-
ation, our work emphasizes the feature extraction of
signals. This paper is organized as follows. In Section
2, we discuss the proposed methods including spectral
analysis and functional data analysis. In Section 3,
the analysis of publicly available EEG data and sum-
mary of main results are presented. Finally, we con-
clude our findings and provide further remarks in Sec-
tion 4.
2 METHODS
Statistical measures, models or distributions are often
used for pattern recognition of high dimensional data
or signals. Most of the real-life signals are stochas-
tic and the pattern of how they are related is mea-
sured by sample auto-covariance matrix or sample
auto-correlation matrix in the time domain. The auto-
covariance matrix is then further decomposed using
various matrix decomposition methods to reduce the
dimension of feature space. For epileptic EEG sig-
nals, our study shows that there is a better functional
relationship between the periodograms and the fre-
quency values than the pattern in the time domain.
This motivates us to study functional data analysis in
a spectral domain for clustering EEG signals, instead
of analyzing signals in the original time domain. We
will first discuss the transformation of a signal to the
spectral domain.
2.1 Spectral Analysis
For a given signal X
t
of length n, sampled at discrete
times, we define the discrete Fourier transform (DFT)
to be
d(ω
j
) = n
−1/2
n
∑
t=1
X
t
e
−2πiω
j
t
(1)
for j = 0, 1,..., n − 1, where the frequency ω
j
= j/n.
Transforming the signal by discrete Fourier transform
allows to obtain a concentration of signal powers us-
ing a small set of more dominant frequencies. This
means that one is able to focus on a selected ω
j
and
its transformed values d(ω
j
) only.
By applying the inverse DFT to d(ω
j
), the signal
X
t
can be exactly recovered as follows:
X
t
= n
−1/2
n−1
∑
j=0
d(ω
j
)e
2πiω
j
t
. (2)
The periodogram for each frequency ω
j
is defined as
I(ω
j
) = | d(ω
j
) |
2
=
1
n
n
∑
t=1
n
∑
s=1
(X
t
−
¯
X)(X
s
−
¯
X)e
−2πiω
j
(t−s)
=
1
n
n−1
∑
h=−(n−1)
n−|h|
∑
t=1
(X
t+|h|
−
¯
X)(X
s
−
¯
X)e
−2πiω
j
h
=
n−1
∑
h=−(n−1)
ˆ
γ(h)e
−2πiω
j
h
,
Feature Extraction of Epileptic EEG in Spectral Domain via Functional Data Analysis
119
where
ˆ
γ(h) is the auto-covariance function of time lag
h. In the above, we used the fact that
n
∑
t=1
e
−2πiω
j
t
= 0. (3)
Notice that the periodogram is just the Fourier trans-
form of the auto-covariance function, which captures
the quadratic covariation of signal in the spectral do-
main.
Furthermore, we can express the periodogram as a
sum of squared sine and cosine transforms of a signal
as follows:
| d(ω
j
) |
2
= d
2
c
(ω
j
) + d
2
s
(ω
j
) (4)
where d
c
(ω
j
) is the cosine transform and d
s
(ω
j
) is
the sine transform of the signal. These transforms are
defined, respectively, as follows:
d
c
(ω
j
) = n
−1/2
n
∑
t=1
X
t
cos(2πω
j
t) (5)
d
s
(ω
j
) = n
−1/2
n
∑
t=1
X
t
sin(2πω
j
t), (6)
where j = 0,1, 2, ...,n − 1. I(ω
j
) is also called a
power spectrum of a signal X
t
. Because of its defini-
tion, a periodogram captures the distribution of vari-
ation of a signal in the spectral domain. The larger
a value of the periodogram the more dominant is its
corresponding frequency. Thus, the dominant val-
ues determine the signal power spectra. Often these
more dominant frequencies correspond to smaller fre-
quency values, which implies that local patterns are
more significant than the global one, after the signal
is transformed into the spectral domain. Because of
this, we only focus on the analysis of the power spec-
trum in a sub-interval, i.e. we analyze only the first
200 frequency values for the given signals.
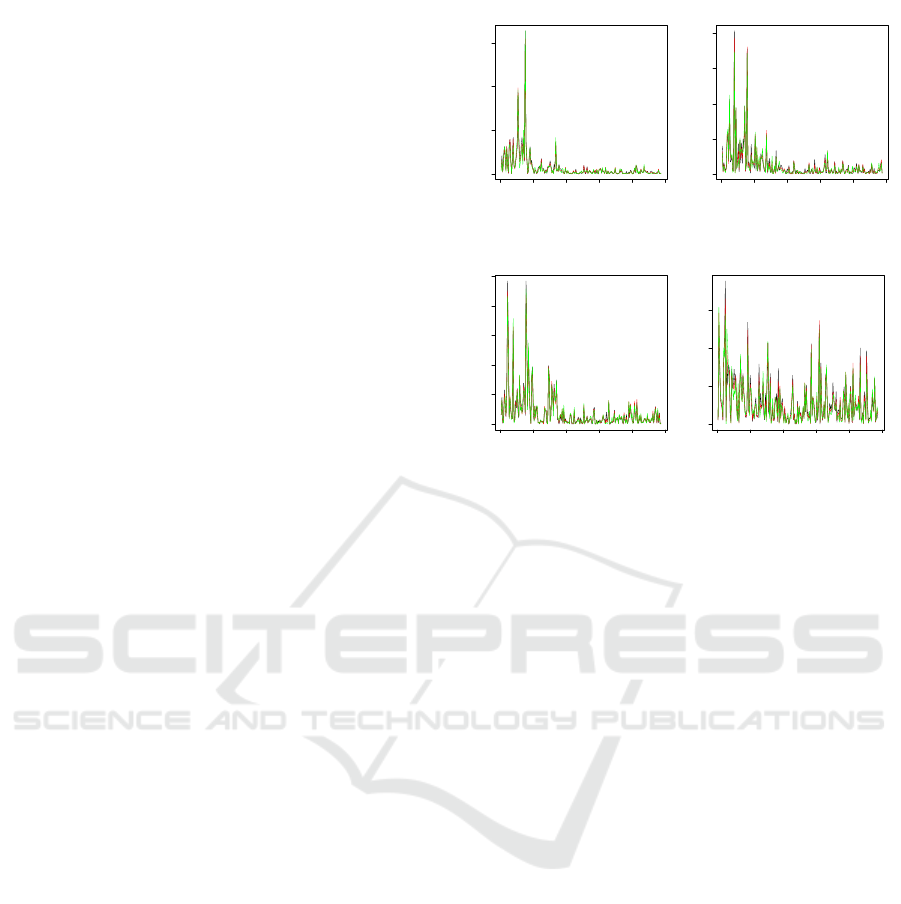
To illustrate the above points, we present a set
of results of the power spectra for selected different
types of EEG signals in Figure 1 (the data set will be
discussed later). One can clearly see that the power
spectra of the first 200 frequency values behave sim-
ilarly within each set of data, but their patterns look
differently over different frequency values.
2.2 Functional Data Analysis
Often a signal is sampled at discrete times. However,
functional data analysis allows us to model the power
spectrum of a signal with discrete observations by a
linear combination of a set of continuous basis func-
tions. Mathematically, for the ith signal in a given
data set, we can expand the power spectrum I
i
(ω) by
I
i
(ω) =
K
∑
k=1
α
ik
φ
k
(ω), (7)
0.00 0.01 0.02 0.03 0.04 0.05
0 50000 100000 150000
Frequency
Signal Power
(a) Set A
0.00 0.01 0.02 0.03 0.04 0.05
0 50000 100000 150000 200000
Frequency
Signal Power
(b) Set B
0.00 0.01 0.02 0.03 0.04 0.05
0e+00 2e+04 4e+04 6e+04 8e+04 1e+05
Frequency
Signal Power
(c) Set C
0.00 0.01 0.02 0.03 0.04 0.05
0 20000 40000 60000
Frequency
Signal Power
(d) Set D
Figure 1: Sample plots of the power spectra for data sets A
(Normal: Eyes Closed), B (Normal: Eyes Open), C (Non-
epileptogenic zone) and D (Epileptogenic zone), respec-
tively. Each plot contains three sample power spectra of
the first 200 frequency values.
where ω is the frequency value, α
ik
is the coefficient
of the kth basis function and K is the total number of
basis functions. In feature extraction, since our objec-
tive is not to fully represent a power spectrum using
a set of functional basis, often a small finite number
K is chosen. That is, we approximate the power spec-
trum by a linear combination of a small number of
K basis functions. Notice that, within the discussion
of this section, we do not separate the mean function
from the representation of a signal, but in the later dis-
cussion we will separate the mean function from the
signal expansion because we will study the functional
variation of the signal power spectra.
For a sample of N signals, the matrix notation of
power spectrum becomes
I(ω) = CΦ(ω) (8)
where I(ω) is a column vector of length N, Φ(ω) is a
column vector of length K containing the basis func-
tions, and C is the coefficient matrix of size N × K.
Notice that the basis function φ(ω) can be different
for various groups of signals. However, because we
will consider the signals which share many common-
alities in the spectral domain, it is more reasonable
to use the same basis functions for all the considered
groups of signals. This will allow us to extract sig-
nal features within the same feature space. In func-
tional data analysis, there are two types of basis func-
ICPRAM 2019 - 8th International Conference on Pattern Recognition Applications and Methods
120

tions: periodical basis functions and non-periodical
basis functions. In this work, we select non-periodical
basis functions as we don’t expect that power spectra
to be periodic. Within non-periodical basis functions,
B-spline basis function is the most popular one, there-
fore we choose this type of basis function for our in-
vestigation (De Boor et al., 1978; Unser et al., 1993).
Of course, we cannot rule out the possibility of the ef-
fect of selected basis functions, so we will investigate
this effect in this work.
2.2.1 Functional Descriptive Statistics
Summary statistics are often the key features, which
are useful for signal classification. Since we have
the functional representation of data, the basic sum-
mary statistics can be expressed in functional form as
a function of frequency ω.
For a given set of sample of length N, the func-
tional mean power spectrum is given as follows:
¯
I(ω) = N
−1
N
∑
i=1
I
i
(ω) = N
−1
N
∑
i=1
K
∑
k=1
α
ik
φ
k
(ω)
=
K
∑
k=1
¯
α
k
φ
k
(ω), (9)
where
¯
α
k
is the average of the coefficients at a given
frequency of the N signals. When N → ∞,
¯
α
k
→ α
k
,
where α
k
is the true coefficient of φ
k
(ω). In this case,
we can denote the mean power spectrum by
µ(ω) =
K
∑
k=1
α
k
φ
k
(ω). (10)
Similarly to the sample variance, the functional vari-
ance, calculated based on N sample power spectra, is
given by
S
2
I
i(ω)
=
1
N − 1
N
∑
i=1
I
i
(ω) −
¯
I(ω)
2
=
1
N − 1
N
∑
i=1
K
∑
k=1
α
ik
φ
k
(ω) −
K
∑
k=1
¯
α
k
φ
k
(ω)
2
=
1
N − 1
N
∑
i=1
K
∑
k=1
(α
ik
−
¯
α
k
)φ
k
(ω)
2
. (11)
For a given sample of N signals, the functional
variance-covariance at two different frequency values
ω
1
and ω
2
can be estimated by
v(ω
1
,ω
2
) =
1
N − 1
N
∑
i=1
I
i
(ω
1
) −
¯
I(ω
1
)
I
i
(ω
2
) −
¯
I(ω
2
)
. (12)
2.2.2 Functional Probes
Purely descriptive statistics such as functional mean,
functional variance, or functional covariance, allow
us to see the functional central tendency and the func-
tional variation pattern of signal power spectra. How-
ever, they are high dimensional statistics. In signal
classification, the dimensions of these functional de-
scriptive statistics must be further reduced. Here, we
consider an application of functional probes. A probe
ρ
ξ
is a measure allowing us to see specific variation
by defining a functional weight ξ(ω), and it is defined
as
ρ
ξ
=
Z
ξ(ω)I(ω)dω. (13)
This is an inner product of functions ξ(ω) and I(ω).
The ξ(ω) has been structured so that we can extract
specific features or patterns of the variation in power
spectrum I(ω). In this work, we choose functional
mean and functional standard deviation of the power
spectrum from a given group of signals as weight
functions. The probe values for the ith signal power
spectrum using functional mean and functional stan-
dard deviation of the jth group power spectrum be-
comes
ρ
¯
I
i j
=
Z
¯
I
( j )
(ω)I
i
(ω)dω
=
K
∑
k
1
=1
K
∑
k
2
=1
α
ik
1
¯
α
( j )
k
2
Z
φ
k
1
(ω)φ
k
2
(ω)dω,
ρ
S
i j
=
Z
S
( j )
I
i(ω)
I
i
(ω)dω. (14)
The functional probe values capture the similarity
between the weight function and the ith power spec-
trum of a signal. When the basis functions are or-
thonormal ( i.e.,
R
φ
k
1
(ω)φ
k
2
(ω)dω = 0, for k
1
6= k
2
,
and
R
φ
2
k
(ω)dω = 1, for k = 1,2,..., K), the probe
value using a functional mean becomes
ρ
¯
I
i j
=
K
∑
k=1
α
ik
¯
α
( j )
k
, (15)
which can be interpreted as a similarity measure be-
tween two different groups of signals in the spectral
domain. However, the closed form does not exist for
probe value using functional standard deviation.
So far, we have discussed functional probe values
based on the power spectrum I(ω). If we replace I(ω)
by v(ω
1
,ω
2
), i.e. the variance-covariance function,
the functional probe value becomes
Z
ξ(ω
2
)v(ω
1
,ω
2
)dω
2
. (16)
This is exactly the left hand side of the eigen-equation
for solving eigenvalues and eigenvectors in func-
tional principal component analysis, which will be
discussed in the next section.
Feature Extraction of Epileptic EEG in Spectral Domain via Functional Data Analysis
121

2.2.3 Functional Principal Component Analysis
In multivariate statistics, principal component anal-
ysis (PCA) of p-variate random vector X =
(X
1
,X
2
,... ,X
p
) looks for a set of weight values,
ξ
j
=(ξ
1 j
,ξ
2 j
,... ,ξ
p j
), so that, at the jth step, the lin-
ear combination of variables X
i
has the greatest vari-
ance. That is Var(
∑
p
i=1
ξ
i j
X
i
), or in the matrix nota-
tion, Var(ξ
>
j
X) is maximized. For j = 1,2,. . ., p, this
process is repeated by replacing each X
i
by the value
obtained after subtracting the previous principal com-
ponent, subject to
∑
p
i=1
ξ
2
i j
= 1 and
∑
p
i=1
ξ
i j
ξ
il
= 0 for
j < l, and 1 ≤ l, j ≤ p. The actual implementation of
this procedure can be done by a singular value decom-
position (SVD) of the data matrix X, which contains
N realizations of X. In this work, data matrix X be-
comes I(ω), which is also an N × p data matrix, where
p is the total number of frequency values being con-
sidered. Formally, the SVD of I(ω) is a factorization
of the form UΣV, where U is a N × N unitary matrix,
Σ is a N × p matrix consisting of eigenvalues of I(ω),
and V is a p× p unitary matrix. The columns of U and
the columns of V are called the left eigenvector and
the right eigenvector of I(ω), respectively. Also, each
column of V is just the weight vector ξ
j
. The feature
extraction of data matrix I(ω) becomes the computa-
tion of I(ω)ξ
>
j
, for j = 1,2,. .., p. For example, the
first principal component scores set is I(ω)ξ
>
1
, and the
second principal component scores set is I(ω)ξ
>
2
.
Notice that, the functional probes discussed above
aim at capturing the variation of data associated with
the weight function. If we carefully select the func-
tional weight ξ(ω), so that the variance of func-
tional probe values in (13) is maximized, subject
to the constraint that
R
ξ
l
(ω)ξ
j
(ω)dω = 0 for l 6=
j, and
R
ξ
2
(ω)dω = 1, then this becomes the func-
tional PCA. In this case, functional probe values are
the principal component scores and the weight func-
tion becomes functional principal component loading.
From the discussion above, we can see the connection
between the multivariate PCA and functional PCA. If
we focus on only the discrete values of ω, then func-
tional PCA becomes multivariate PCA. However, the
functional PCA allows us to explore the functional
variation of different principal components.
Suppose that the power spectrum of a given signal
can be expanded using K basis functions, which is
given as follows:
I
i
(ω) = µ(ω) +
K
∑
k=1
β
ik
φ
k
(ω), (17)
where µ(ω) is the functional mean of power spectrum.
We may then express this in a matrix notation
I − µ = Cφ, (18)
where C is the N × K coefficient matrix, and
φ=(φ
1
,φ
2
,... ,φ
K
)
>
. Now, we consider how to obtain
the function principal components and their scores.
First let us denote the variance-covariance function by
v(ω
1
,ω
2
). This function is defined in (12). In matrix
form the variance-covariance function is
v(ω
1
,ω
2
) =
1
N − 1
φ
>
(ω
1
)C
>
Cφ(ω
2
). (19)
Next, to find the principal component weight func-
tions, we have to solve the following eigen-equation
for the appropriate eigenvalue λ
Z
v(ω
1
,ω
2
)ξ(ω
2
)dω
2
= λξ(ω
1
). (20)
Suppose that the eigen-function ξ(ω) has an expan-
sion
ξ(ω) =
K
∑
k=1
b
k
φ
k
(ω), (21)
or in the matrix notation
ξ(ω) = φ
>
(ω)b, (22)
where b=(b
1
,b
2
,... ,b
K
). This yields
Z
v(ω
1
,ω
2
)ξ(ω
2
)dω
2
=
1
N − 1
Z
φ
>
(ω
1
)C
>
C
φ(ω
2
)φ
>
(ω
2
)bdω
2
.
=
1
N − 1
φ
>
(ω
1
)C
>
CΦb,
where Φ=
R
φ(ω)φ
>
(ω)dω is a K × K matrix. Thus,
the eigen-equation (20) becomes
1
N − 1
φ
>
(ω)C
>
CΦb = λφ
>
(ω)b. (23)
Since equation (23) must hold for all ω, this implies
the following matrix equation
1
N − 1
C
>
CΦb = λb. (24)
To obtain the required principal components, we de-
fine u = Φ
1/2
b, thus the equation (24) becomes
1
N − 1
Φ
1/2
C
>
CΦ
1/2
u = λu. (25)
By solving the symmetric eigenvalue problem in (25)
for u, and then computing b = Φ
−1/2
u one gets the
eigen-function ξ(ω), which is given by
ξ(ω) = φ
>
(ω)Φ
−1/2
u. (26)
If φ
k
(ω) are orthogonal, then Φ becomes the K ×
K identity matrix. Thus, the eigen-analysis of the
functional PCA problem in (24) reduces to
1
N − 1
C
>
Cb = λb, (27)
ICPRAM 2019 - 8th International Conference on Pattern Recognition Applications and Methods
122
which is the multivariate PCA that replaces variance-
covariance matrix by the coefficient matrix C ob-
tained from the function approximation of power
spectrum. From the discussion above, we notice that
the multivariate PCA conducts eigen-analysis for a
p × p covariance matix. With the function approxi-
mation using K basis functions, the eigen-analysis of
functional PCA is applied to a K × K coefficient ma-
trix, which depends on the value of K. In the case
of using sparse approximation, which gives a small
value of K, the problem is more efficient in terms of
computational complexity.
0.00 0.01 0.02 0.03 0.04 0.05
0 5000 10000 15000 20000 25000 30000 35000
Frequency
Signal Power
(a) Set A
0.00 0.01 0.02 0.03 0.04 0.05
0 10000 20000 30000 40000 50000
Frequency
Signal Power
(b) Set B
0.00 0.01 0.02 0.03 0.04 0.05
0 5000 10000 15000 20000 25000 30000
Frequency
Signal Power
(c) Set C
0.00 0.01 0.02 0.03 0.04 0.05
0 5000 10000 15000 20000 25000 30000 35000
Frequency
Signal Power
(d) Set D
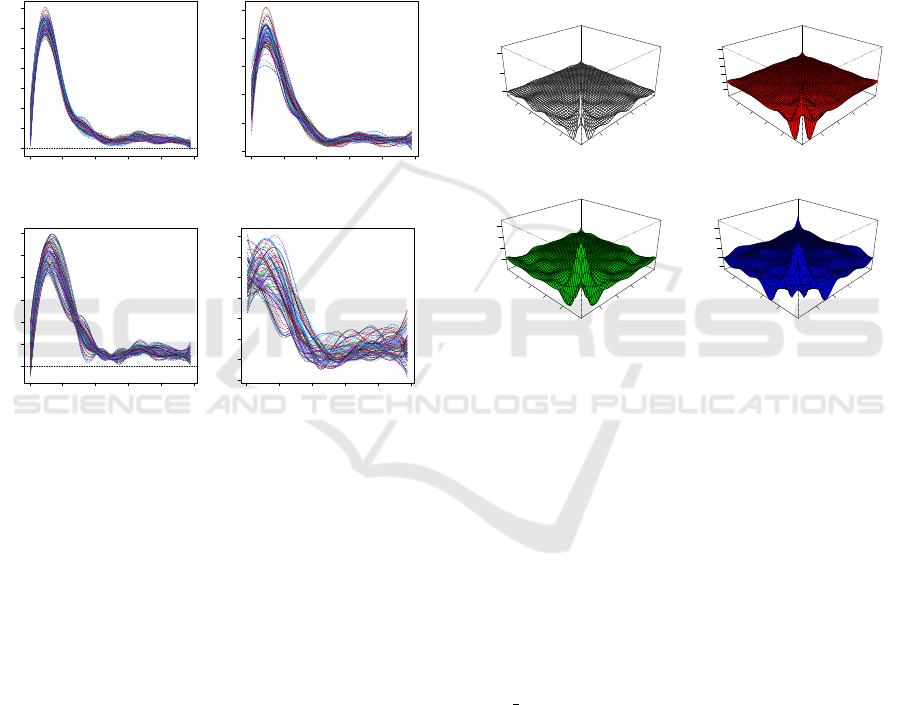
Figure 2: The plots of functional power spectrum for data
sets A (Normal: Eyes Closed), B (Normal: Eyes Open),
C (Non-epileptogenic zone) and D (Epileptogenic zone) re-
spectively. 10 B-splines basis functions are used to smooth
sample power spectra.
2.2.4 Feature Extraction by Functional
Principal Component Analysis
After the eigen-function ξ(ω) is obtained, we can ex-
tract the principal component scores, denoted by P
j
,
for the given power spectrum I(ω) by the following
formula
P
j
=
Z
I(ω)ξ
j
(ω)dω, j = 1,.. .,K. (28)
Subsitituting (18) and (26) into the equation
above, we get
P
j
=
Z
(µ(ω) + Cφ(ω))φ
>
(ω)Φ
−1/2
u
j
dω. (29)
=
Z
µφ
>
Φ
−1/2
u
j
+
Z
Cφφ
>
Φ
−1/2
u
j
= ¯µΦ
−1/2
u
j
+ CΦ
−1/2
u
j
, (30)
where ¯µ =
R
µ(ω)φ
>
(ω)dω. Thus, P
1
to the first prin-
cipal component score vector of the N signal power
spectra, and P
2
is the second principal component
score vector, and so on.
Notice that, to fully represent a given power
spetrum I
j
(ω), the number of basis functions K may
approach to infinity. However, for the purpose of fea-
ture extraction, we aim for a low dimensional fea-
ture subspace, which may require a choice of small
K value. We then use a cubic B-spline basis, which
gives the order number to be 4, and we select the num-
ber of basis functions K to be 10. This selection leads
to a good approximation of the power spectra.
Frequency
0.01
0.02
0.03
0.04
Frequency
0.01
0.02
0.03
0.04
0e+00
5e+06
1e+07
(a) Set A
Frequency
0.01
0.02
0.03
0.04
Frequency
0.01
0.02
0.03
0.04
-1e+07
0e+00
1e+07
2e+07
3e+07
4e+07
(b) Set B
Frequency
0.01
0.02
0.03
0.04
Frequency
0.01
0.02
0.03
0.04
0.0e+00
5.0e+06
1.0e+07
1.5e+07
(c) Set C
Frequency
0.01
0.02
0.03
0.04
Frequency
0.01
0.02
0.03
0.04
-1e+07
0e+00
1e+07
2e+07
3e+07
(d) Set D
Figure 3: The plots of functional covariance of power spec-
tra for data sets A (Normal: Eyes Closed), B (Normal: Eyes
Open), C (Non-epileptogenic zone) and D (Epileptogenic
zone), respectively.
3 RESULTS
In order to demonstrate the application of the pro-
posed method to epilepsy diagnosis, we use a
set of EEG signals coming from healthy volun-
teers and from patients during seizure-free inter-
vals. This database is from the University of
Bonn, Germany (http://epileptologie-bonn.de/cms/
front content.php?idcat=193). There are four differ-
ent sets of EEG data, denoted, respectively by A, B,
C, and D. Data in sets A and B are normal signals
with eyes closed and open, respectively. Data in sets
C and D are epileptic signals coming from patients
suffering from epilepsy. Signals in the set C are col-
lected from the patients’ non-epileptogenic zone, and
signals in the set D are from the patients’ epilepto-
genic zone. Each dataset contains 100 single channel
scalp EEG segments of a 23.6 second duration. To
achieve this the EEG signals, were sampled at 173.61
Hz (i.e., T =4096).
Feature Extraction of Epileptic EEG in Spectral Domain via Functional Data Analysis
123
0.00 0.01 0.02 0.03 0.04 0.05
0 5000 10000 15000 20000 25000 30000
Frequency
Mean Signal Power
(a) Set A
0.00 0.01 0.02 0.03 0.04 0.05
10000 20000 30000 40000
Frequency
Mean Signal Power
(b) Set B
0.00 0.01 0.02 0.03 0.04 0.05
5000 10000 15000 20000 25000
Frequency
Mean Signal Power
(c) Set C
0.00 0.01 0.02 0.03 0.04 0.05
10000 15000 20000 25000
Frequency
Mean Signal Power
(d) Set D
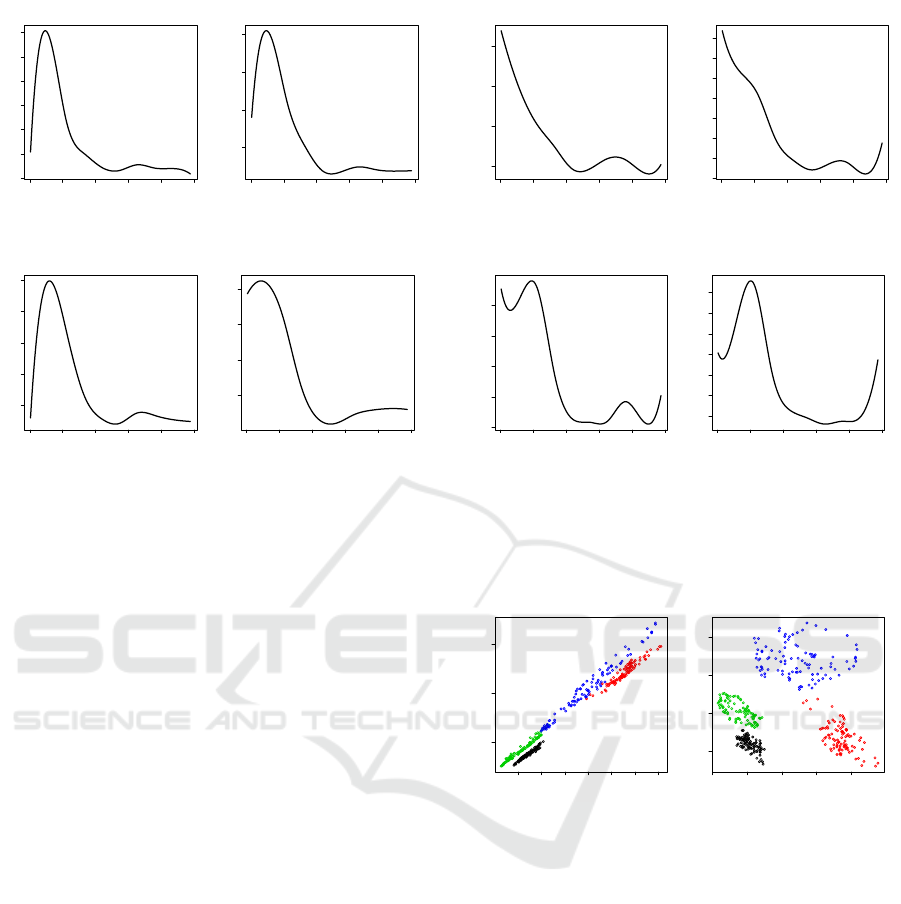
Figure 4: The plots of functional mean power spectra for
data sets A (Normal: Eyes Closed), B (Normal: Eyes
Open), C (Non-epileptogenic zone) and D (Epileptogenic
zone), respectively.
From the results displayed in Figure 2, one can
see that the smoothed signal power spectra behave
similarly for both signals from healthy people (sets
A and B) and signals from patients, which were col-
lected from a non-epileptogenic zone (set C). How-
ever, there are still some differences that we can see
among the graphs. This may suggest that further clas-
sification is needed based on these power spectra to
recognize the differences hidden in the power spectra.
Also, one can see that the power spectra of signals
collected from patients’ epileptogenic zone (set D)
are more volatile and look different from the signals
of healthy people. However, they share some com-
monalities with signals from the set C. The graphical
dispay offers some evidence that suitable clustering
methods may differentiate these types of signals suc-
cessfully.
Many clustering methods, including PCA are ap-
plied to the variance-covariance data matrix to recog-
nize the differences among different groups of data.
Therefore, we further examine the auto-covariance
data matrices for each set of signals. The results dis-
played in Figure 3 show that the auto-covariances are
significant only at low-frequency values. This sug-
gests that it may be sufficient to extract features from
small signal windows only. Thus, the focus on more
dominant powers within the spectral domain may lead
to a dimension reduction and this expectation is con-
firmed by our results displayed in Figure 1.
0.00 0.01 0.02 0.03 0.04 0.05
500 1000 1500 2000
Frequency
Signal Power Std
(a) Set A
0.00 0.01 0.02 0.03 0.04 0.05
500 1000 1500 2000 2500 3000 3500 4000
Frequency
Signal Power Std
(b) Set B
0.00 0.01 0.02 0.03 0.04 0.05
500 1000 1500 2000 2500
Frequency
Signal Power Std
(c) Set C
0.00 0.01 0.02 0.03 0.04 0.05
2000 2500 3000 3500 4000 4500 5000
Frequency
Signal Power Std
(d) Set D
Figure 5: The plots of the functional standard deviations
of power spectra for data sets A (Normal: Eyes Closed), B
(Normal: Eyes Open), C (Non-epileptogenic zone) and D
(Epileptogenic zone), respectively.
7.0e+06 8.0e+06 9.0e+06 1.0e+07 1.1e+07 1.2e+07 1.3e+07
1500000 2000000 2500000
Probe Values based on Mean
Probe Values based on Std
(a) Functional Probes
-1000 -500 0 500 1000
-500 0 500 1000
First PC scores
2nd PC scores
(b) PC scores
Figure 6: The extracted probe values using the functional
mean and the functional standard deviation of power spec-
trum of signals of the Set D as the functional probe for
data sets A (Normal: Eyes Closed, Black), B (Normal:
Eyes Open, Red), C (Non-epileptogenic zone, Green) and
D (Epileptogenic zone, Blue) are displayed in (a). The plot
for extracted principal component scores for first two com-
ponents of power spectra for data sets A (Normal: Eyes
Closed, Black), B (Normal: Eyes Open, Red), C (Non-
epileptogenic zone, Green) and D (Epileptogenic zone,
Blue) are displayed in (b).
In Figures 4 and 5, the functional mean and the
functional standard deviation are reported for each set
of signals. In these figures, we observe the strong
commonalities and similarities among the respective
functional statistics of the sets A, B, and C, but these
statistics look different from the ones of the set D.
This may imply a different nature of EEG signals
among the patients and non-patients (including sig-
ICPRAM 2019 - 8th International Conference on Pattern Recognition Applications and Methods
124
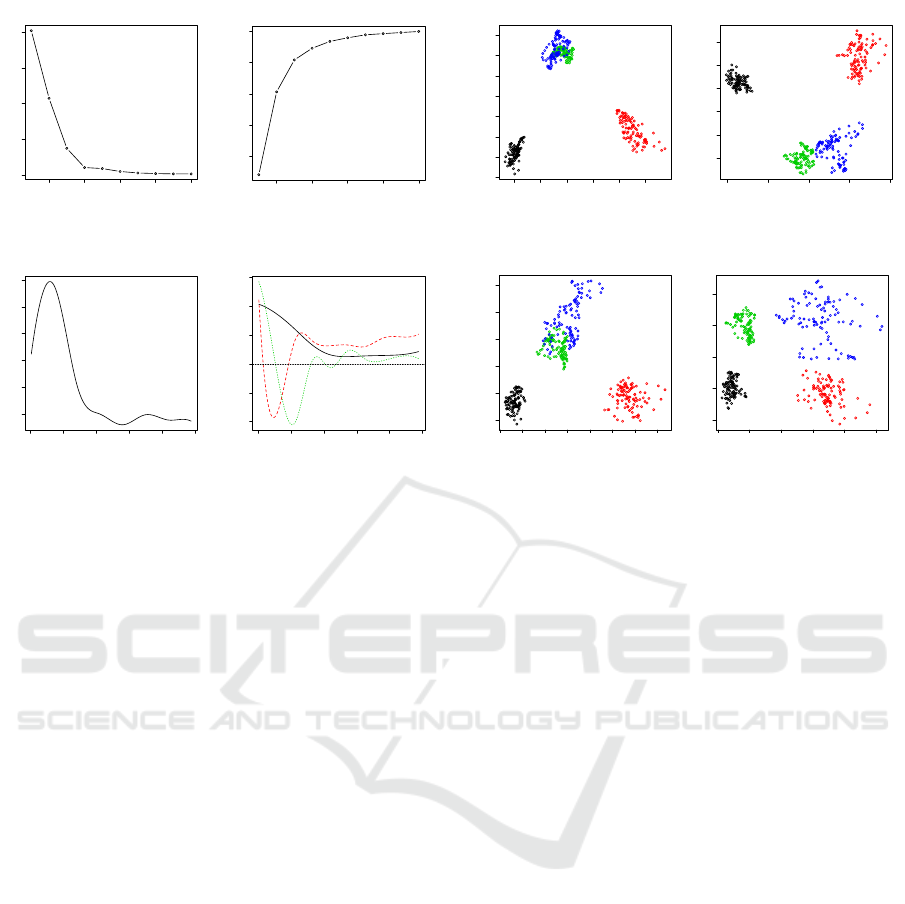
2 4 6 8 10
0e+00 1e+05 2e+05 3e+05 4e+05
Principal Components
Eigenvalues
(a) Eigenvalues
2 4 6 8 10
0.6 0.7 0.8 0.9 1.0
Principal Components
Variance Proportion
(b) Cumulative Variance
0.00 0.01 0.02 0.03 0.04 0.05
5000 10000 15000 20000 25000 30000
Frequency
mean value
(c) Overall Functional Mean
0.00 0.01 0.02 0.03 0.04 0.05
-10 -5 0 5 10 15
Frequency
values
(d) First Three Harmonics
Figure 7: The results of principal components of power
spectra including eigenvalues, variance proportion, overall
functional mean and the first three eigenfunctions. The first
eigenfunction is in black, the second eigenfunction is in red
and the third one is in green.
nals from non-epileptogenic zone). Also, we observe
that the functional variation at high frequency is much
higher for patitents’ data, particularly for the set D. To
further reduce the dimensionality of the power spec-
trum and its functional mean and its functional stan-
dard deviation, the functional probe values are calcu-
lated based on the inner product of a selected func-
tional mean and a given signal power spectrum. The
results using functional standard deviation as a weight
function are also obtained. In our study, the best re-
sults, in terms of separability of features, are the ones
that use the functional mean and the functional stan-
dard deviation calculated from the set D. Using these
two functional probes, we extract a two-dimensional
feature vector from a given signal power spectrum.
The Figure 6 (a) clearly display the pattern, which
shows a great separability of extracted features (i.e.,
functional probe values), due to the dimension reduc-
tion. We also see that the relationship between these
two features seem to be linear for all cases. This
implies that the feature variation within each group
might not have been maximized, due to the pre-fixed
functional probes. When compared to the results ob-
tained by PCA, we confirm that indeed this is the case.
Principal component extractions aim at obtaining
a set of scores, so that, further investigation can be
done by using them. Our goal is to obtain a set of
principal components scores that form clusters for dif-
-2000 -1000 0 1000 2000 3000
-2000 -1500 -1000 -500 0 500 1000 1500
First PC scores
2nd PC scores
(a) K=200
-2000 -1000 0 1000 2000
-1000 -500 0 500 1000 1500
First PC scores
2nd PC scores
(b) K = 100
-1500 -1000 -500 0 500 1000 1500 2000
-1000 -500 0 500 1000 1500
First PC scores
2nd PC scores
(c) K = 50
-1000 -500 0 500 1000 1500
-1000 -500 0 500 1000
First PC scores
2nd PC scores
(d) K = 25
Figure 8: The Evolution of extracted first two principal
component scores of power spectra under different choices
of K for data sets A (Normal: Eyes Closed, Black), B (Nor-
mal: Eyes Open, Red), C (Non-epileptogenic zone, Green)
and D (Epileptogenic zone, Blue).
ferent groups of signals. The obtained principal com-
ponent scores are reported in Figure 6 (b) under the
selection of K = 10, which is considered to be the op-
timal value in terms of feature separability. From the
displayed results, we can see that in clustering power
spectra of the four sets of signals the functional PCA
is more successful than the functional mean and the
functional standard deviation as the probes, as can be
seen from the previously discussed results. We no-
tice that, the principal components scores of power
spectra are completely separable from other groups.
Overall, the principal components scores form bet-
ter into clusters that have clear centroids and more
homogenous variations. This is particularly impor-
tant and useful for model-based classification meth-
ods such as Gaussian mixture models. The Figure 7
displays more results of the principal component anal-
ysis including eigvenvalues, cumulative variance pro-
portion, functional grand mean and functional prin-
cipal components. The displayed results show that
the first three principal components are dominant in
terms of explanation of data variation. The functional
grand mean reflects, mainly, the pattern of the power
spectra of the sets A, B, and C. These sets have ei-
ther signals from healthy people or signals from a
non-epileptogenic zone of a patient. The main char-
acteristics of power spectra of the set D are reflected
in both second and third principal components, while
Feature Extraction of Epileptic EEG in Spectral Domain via Functional Data Analysis
125

the first principal component captures the functional
grand mean. This helps to explain why by taking the
functional mean and the functional standard deviation
of power spectrum from set D as functional probes
also produce separable functional probe values.
We further investigate the effect of the number
of basis functions (i.e., K) on the separability of
extracted signal features (i.e., principal component
scores of power spectra). The obtained results are
displayed in Figure 8. We observe that the proposed
method is highly successful in separating the artifacts
(i.e., open/closed eyes) as the results did not depend
on how the number of basis functions was selected.
The feature separability increases with the decrease of
K, i.e., the number of basis functions. This may sug-
gest that the sparsity in approximation of the signal
power spectra plays an important role in the success
of applying functional principal component analysis.
When K=200, the extracted features for epileptic sig-
nals overlap significantly. This overlapping changes
when K decreases, and features start to be fully sepa-
rable when K is relatively small, for example, around
25. However, the overall separability between healthy
and epileptic signals is not affected by the number of
basis functions.
4 CONCLUDING REMARKS
Clustering and classification of highly dimensional
data are important tasks in pattern recognition and ar-
tificial intelligence. To be successful in using machine
learning techniques, including clustering and classifi-
cation, dimension reduction of data is a key approach.
In this work, we have conisdered an approach that
first transforms signals to the spectral domain and ob-
tains their power spectra. Next, we have applied the
functional data analysis techniques to further investi-
gate the charateristics of the signals. We have demon-
strated that functional data analysis in spectral domain
is useful for understanding the key features of differ-
ent types of EEG signals. Especially, the extracted
features, using functional principal component anal-
ysis, can be used for classification of different types
of EEG signals. Also we have investigated the effect
of sparsity on the performance of separating signal
features. The obtained results demonstrate that the
proposed method may be useful for an epilepsy diag-
nosis. Future work will focus on the study of wavelet
spectral domain functional PCA and its application to
clustering random signals.
ACKNOWLEDGEMENT
The authors acknowledges partial support from
NSERC (Natural Sciences and Engineering Research
Council of Canada).
REFERENCES
Alickovic, E., Kevric, J., and Subasi, A. (2018). Perfor-
mance evaluation of empirical mode decomposition,
discrete wavelet transform, and wavelet packed de-
composition for automated epileptic seizure detection
and prediction. Biomedical Signal Processing and
Control, 39:94–102.
Bouveyron, C., Girard, S., and Schmid, C. (2007). High-
dimensional data clustering. Computational Statistics
& Data Analysis, 52(1):502–519.
De Boor, C., De Boor, C., Math
´
ematicien, E.-U., De Boor,
C., and De Boor, C. (1978). A practical guide to
splines, volume 27. Springer-Verlag New York.
Fergus, P., Hussain, A., Hignett, D., Al-Jumeily, D., Abdel-
Aziz, K., and Hamdan, H. (2016). A machine learning
system for automated whole-brain seizure detection.
Applied Computing and Informatics, 12(1):70–89.
Gandhi, T., Panigrahi, B. K., and Anand, S. (2011). A com-
parative study of wavelet families for eeg signal clas-
sification. Neurocomputing, 74(17):3051–3057.
Garcia, G. N., Ebrahimi, T., and Vesin, J.-M. (2003).
Support vector eeg classification in the fourier and
time-frequency correlation domains. In Neural En-
gineering, 2003. Conference Proceedings. First Inter-
national IEEE EMBS Conference on, pages 591–594.
IEEE.
Jimenez, L. O. and Landgrebe, D. A. (1998). Supervised
classification in high-dimensional space: geometrical,
statistical, and asymptotical properties of multivariate
data. IEEE Transactions on Systems, Man, and Cyber-
netics, Part C (Applications and Reviews), 28(1):39–
54.
Kriegel, H.-P., Kr
¨
oger, P., and Zimek, A. (2009). Clustering
high-dimensional data: A survey on subspace cluster-
ing, pattern-based clustering, and correlation cluster-
ing. ACM Transactions on Knowledge Discovery from
Data (TKDD), 3(1):1.
Li, D., Pedrycz, W., and Pizzi, N. J. (2005). Fuzzy wavelet
packet based feature extraction method and its appli-
cation to biomedical signal classification. IEEE Trans-
actions on biomedical engineering, 52(6):1132–1139.
Liang, S.-F., Wang, H.-C., and Chang, W.-L. (2010). Com-
bination of eeg complexity and spectral analysis for
epilepsy diagnosis and seizure detection. EURASIP
Journal on Advances in Signal Processing, 2010:62.
Lima, C. A., Coelho, A. L., and Chagas, S. (2009). Auto-
matic eeg signal classification for epilepsy diagnosis
with relevance vector machines. Expert Systems with
Applications, 36(6):10054–10059.
ICPRAM 2019 - 8th International Conference on Pattern Recognition Applications and Methods
126

Nyan, M., Tay, F., Seah, K., and Sitoh, Y. (2006). Classifi-
cation of gait patterns in the time–frequency domain.
Journal of biomechanics, 39(14):2647–2656.
Phinyomark, A., Phukpattaranont, P., and Limsakul, C.
(2012). Feature reduction and selection for emg sig-
nal classification. Expert Systems with Applications,
39(8):7420–7431.
Qazi, K. I., Lam, H., Xiao, B., Ouyang, G., and Yin, X.
(2016). Classification of epilepsy using computational
intelligence techniques. CAAI Transactions on Intel-
ligence Technology, 1(2):137–149.
Ramsay, J. (2005). Functional data analysis. Encyclopedia
of Statistics in Behavioral Science.
Ramsay, J. O. and Silverman, B. W. (2007). Applied
functional data analysis: methods and case studies.
Springer.
Subasi, A. and Gursoy, M. I. (2010). Eeg signal classifica-
tion using pca, ica, lda and support vector machines.
Expert systems with applications, 37(12):8659–8666.
Truong, N. D., Kuhlmann, L., Bonyadi, M. R., Yang, J.,
Faulks, A., and Kavehei, O. (2017). Supervised learn-
ing in automatic channel selection for epileptic seizure
detection. Expert Systems with Applications, 86:199–
207.
Unser, M., Aldroubi, A., Eden, M., et al. (1993). B-spline
signal processing: Part i theory. IEEE transactions on
signal processing, 41(2):821–833.
Wang, J.-L., Chiou, J.-M., and M
¨
uller, H.-G. (2016). Func-
tional data analysis. Annual Review of Statistics and
Its Application, 3:257–295.
Yu, L. and Liu, H. (2003). Feature selection for high-
dimensional data: A fast correlation-based filter solu-
tion. In Proceedings of the 20th international confer-
ence on machine learning (ICML-03), pages 856–863.
Zhang, Z., Xu, Y., Yang, J., Li, X., and Zhang, D. (2015).
A survey of sparse representation: algorithms and ap-
plications. IEEE access, 3:490–530.
Feature Extraction of Epileptic EEG in Spectral Domain via Functional Data Analysis
127
