
Usage of GPS Data for Real-time Public Transport Location Visualisation
Aleksejs Zacepins, Egons Kalnins, Armands Kviesis and Vitalijs Komasilovs
Department of Computer Systems, Faculty of Information Technologies, Latvia
University of Life Sciences and Technologies, Jelgava, Latvia
Keywords:
Public Transport, Smart City, Smart Transportation.
Abstract:
The concept of the smart city has been fashionable in the political arena in recent years. Cities are trying
to be modern and provide various ICT based services for their citizens. An efficient public transportation
service is critical for the citizens, but traffic congestions are still a problem in cities and are one of the main
reasons for public transport delays. Therefore, it is important for citizens to know where the needed public
transport vehicle is located at the moment, to know if the transport has already passed the stop or not. Authors
of this research propose a real-time public transport tracking system using a global positioning system (GPS)
technology module to receive the location of the vehicle in a real-time. System is based on the Raspberry Pi
3, which is used to transfer positioning data received from GPS module to the remote database. Based on
received data, the location of the bus is visualised in the developed Web system.
1 INTRODUCTION
The concept of Smart city is not novel, but in the re-
cent years it rose up to a new level by using ICT (In-
formation and Communication Technologies) and IoT
(Internet of Things) to build and integrate critical in-
frastructures and services of a city (Nam and Pardo,
2011). Smart city can be defined in many ways (Par-
tridge, 2004; Harrison et al., 2010; Hall et al., 2000;
Giffinger, 2007; Washburn et al., 2010; Caragliu et al.,
2011; Albino et al., 2015), but the main idea of the
Smart city is to provide efficient services for the citi-
zens. Smart city consists of several multidimensional
components (like Smart energy, Smart government,
Smart economy etc.), and Smart mobility is one of
them (Nam and Pardo, 2011). In its turn, Smart pub-
lic transportation is a significant part of the Smart mo-
bility dimension in Smart cities, as one of the main
problems of urban centres today is mobility of citi-
zens (Lima et al., 2017). Efficient urban transporta-
tion systems are widely accepted as essential infras-
tructure for smart cities, and they can highly increase
a city’s vitality and convenience for residents (Liu
et al., 2017).
Governments on the national and municipalities
on the local level are trying to motivate citizens to use
public transport service instead of private vehicles by
promoting the development of journey planning tech-
nologies in order to optimise commuter interactions
with transportation systems (Cohen et al., 2017). Still
huge amount of people are using private vehicles for
transportation in the cities and bus passengers jour-
neys are decreasing. For example in 2016/2017, 2.20
billion passenger journeys were made by local bus in
England outside London, down 0.8% compared with
2015/16. In London decrease of 2.3% is observed and
passenger journey number is decreasing for several
years in a row (information by Department for Trans-
port, Annual bus statistics: England 2016/17
1
). Sit-
uation in author’s home country Latvia is similar, in
year 2016 passenger flow is decreased by 2.8% com-
pared to 2015 and tendency is to have passenger num-
ber decrease by 2% each year (statistics by Latvian
road transport directorate
2
).
Many citizens using public transportation have ex-
perienced time losses because of waiting at the stops
(Jadhav et al., 2017), which is not corresponding to
the efficient service. Citizen does not get any idea of
current location of a bus or exact timing of arriving
bus. So citizen have to wait for a bus at the bus stop
for several tens of minutes or even hours, when con-
sidering regional buses (Khot and Yadav, 2016). Pub-
lic transport is suffering from a number of uncertain
conditions for the possible delays, like traffic conges-
1
https://assets.publishing.service.gov.uk/government/
uploads/system/uploads/attachment_data/file/666759/
annual-bus-statistics-year-ending-march-2017.pdf
2
www.atd.lv/sites/default/files/Info_2016_9_menesi_
05122016.pdf
Zacepins, A., Kalnins, E., Kviesis, A. and Komasilovs, V.
Usage of GPS Data for Real-time Public Transport Location Visualisation.
DOI: 10.5220/0007350902770282
In Proceedings of the 5th International Conference on Vehicle Technology and Intelligent Transport Systems (VEHITS 2019), pages 277-282
ISBN: 978-989-758-374-2
Copyright
c
2019 by SCITEPRESS – Science and Technology Publications, Lda. All rights reserved
277
tions, traffic accidents and others (Suganya and Valar-
mathi, 2017). But still improvement and expansion of
the public transportation service is a key factor to min-
imise traffic congestions in urban cities (Garg et al.,
2017).
In today’s smart world in line with all fast emerg-
ing technologies public transport system must be im-
proved. One of the technological solutions, which can
improve transportation system quality, is GPS (Global
Positioning System). GPS allows the precise posi-
tioning of an object using satellite signals. There are
a many applications of this technology in various sci-
entific fields including transportation sector (Mintsis
et al., 2004). GPS has nearly global coverage, that al-
lows to detect location almost everywhere, and nowa-
days technology demonstrates high robustness (Dani
Reagan Vivek et al., 2017). Using GPS data, trans-
port system can also keep track on driver’s perfor-
mance while s/he is driving a bus. Tracking of all
buses helps to reduce chances of vehicle theft opera-
tions and if any accident happens with bus system, it
can be easily identified (Garg et al., 2017). GPS data
are not just useful for travel time prediction and lo-
cation identification, but can also provide information
about traffic, e.g., the existence of congestions (Bacon
et al., 2011), therefore it can extend the ITS (Intel-
ligent Transport System) concept, which is basically
used to improve the safety and efficiency of the traffic
management system (Nasim and Kassler, 2012).
There are many approaches and algorithms of bus
arrival time prediction based on GPS data (Kviesis
et al., 2018; Amita et al., 2015; Yin et al., 2017; Fan
and Gurmu, 2015)), but author’s idea is to give citi-
zens an easy tool to see the public transport location
in real-time and make decisions by themselves. In
overall, collection of public transport GPS data can
be as a one source for the data mining in Smart cities,
as data mining is one of the three core pillars (Nasim
and Kassler, 2012) for the smart city together with IoT
and mobile wireless networks.
So the main aim of this paper is to describe ap-
proach for real-time GPS data collection with its fur-
ther application in public transport vehicles for ser-
vice quality improvement by visualisation of real-
time vehicle location. Such system will help to im-
prove interest of citizens towards usage of public
transportation system.
2 MATERIAL AND METHODS
Within this research authors developed GPS data col-
lection system for demonstration of real-time public
bus location. For GPS data visualisation additional
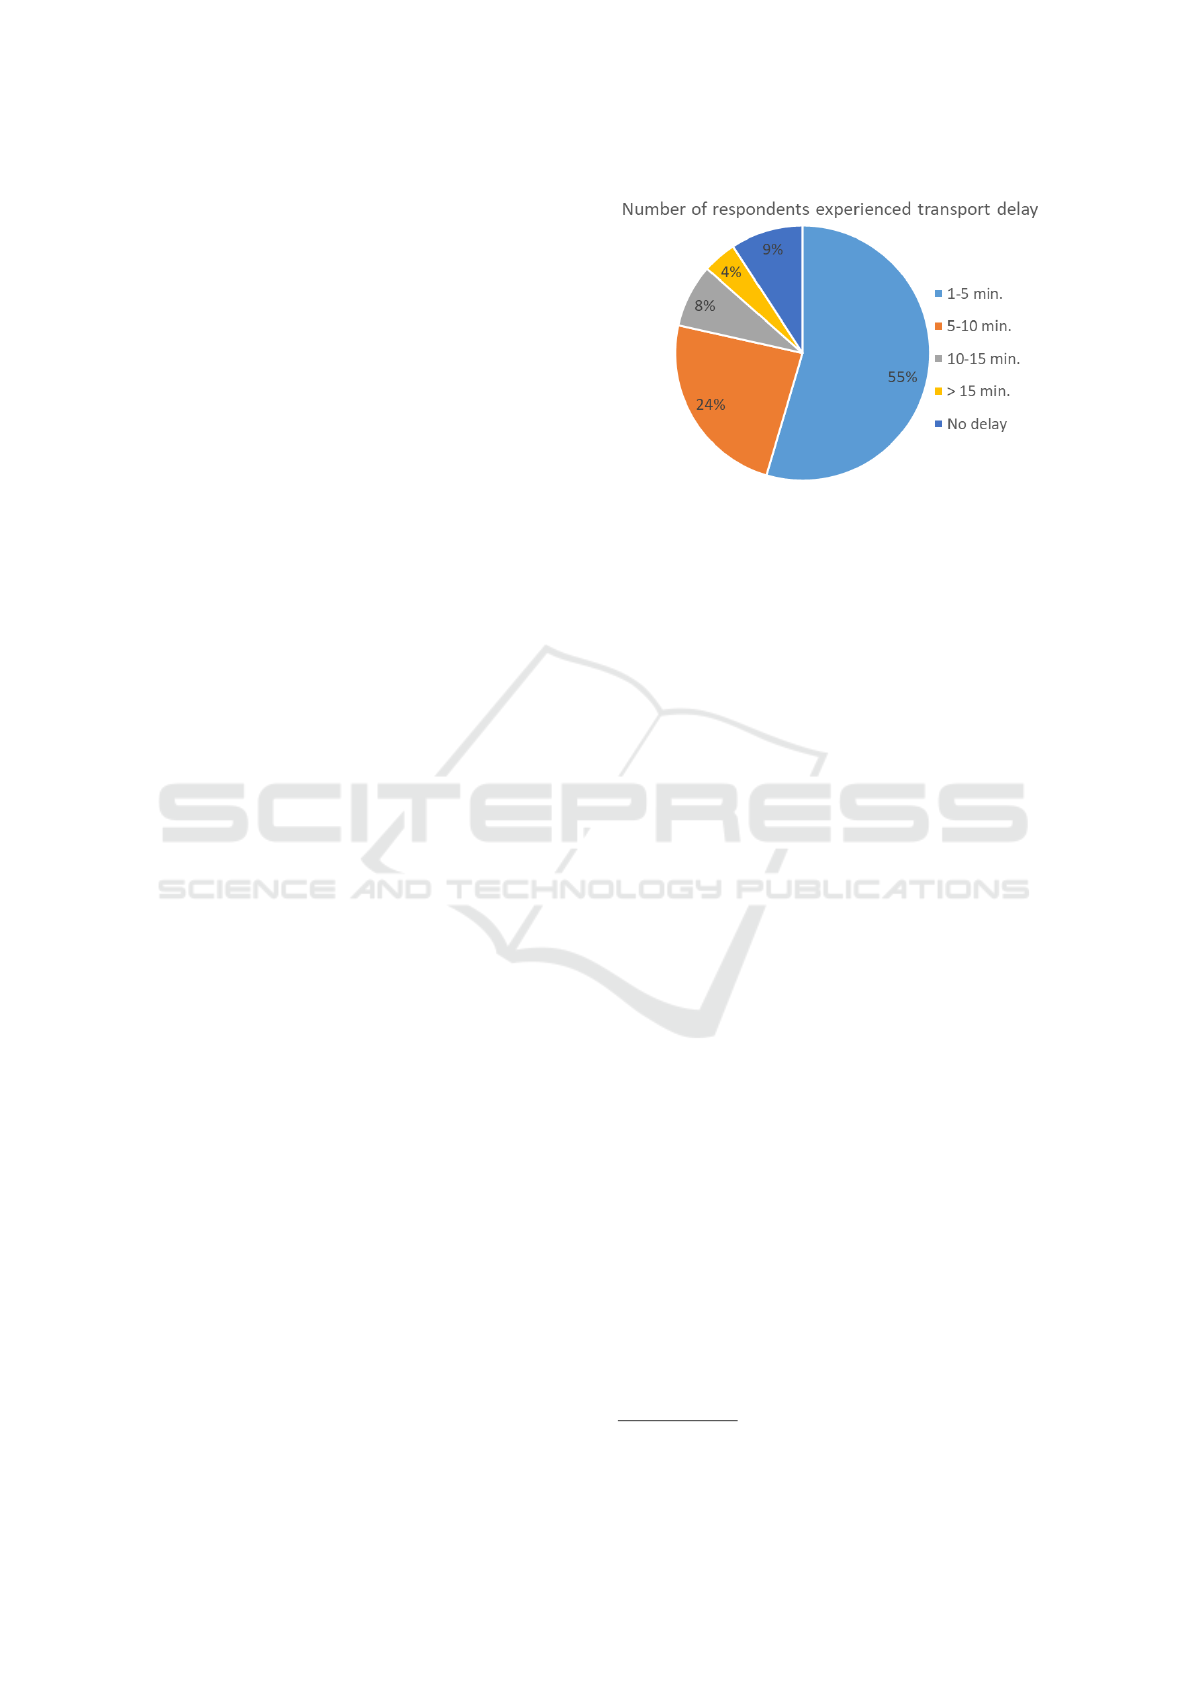
Figure 1: Delay of the transport, experienced by the respon-
dents.
WEB system is developed for use in any device with
Internet connection. Before the development process,
authors conducted a survey to know the Latvian soci-
ety opinions and their needs to know the public trans-
port real-time location and approximate bus arrival
time at the specific bus stop. As well existing intel-
ligent transportation systems in Latvia are described
and compared with some international systems.
2.1 Survey about Research Topicality
To get to know the Latvian society opinion on the
importance of knowing the public transport real lo-
cation and approximate bus stop arrival time authors
conducted a survey using the Google Forms. For the
survey citizens of Riga (capital of Latvia) were asked
to answer 13 questions about Riga main public trans-
portation service provider "Rigas Satiksme" (RS
3
).
Survey included questions about how often they use
public transport, how often transport has delays and
how those delays affects citizens plans. There were
also some questions about GPS technology and pos-
sible benefits of its usage. 163 respondents replied
to the survey. Respondent group consisted of 78.5%
women and 21.5% men, average age was 25.4 years.
Analysis of the answers concluded, that bus has
the most delays. As well more than 30% of respon-
dents marked that their used public transport has de-
lays almost every day. Regarding the delays, 54.6%
said that delay was less than 5 minutes, but other
36.4% marked that delay was more than 5 minutes
(4.3% said that delay was more than 15 minutes) (see
Fig 1).
It is worth to emphasize that plenty of respon-
dents (65%) said that they missed their work, school
or meeting due to transport delays. 43.6% noted, that
this really spoiled their mood. The next question was
3
https://www.rigassatiksme.lv/en/about-us/
VEHITS 2019 - 5th International Conference on Vehicle Technology and Intelligent Transport Systems
278
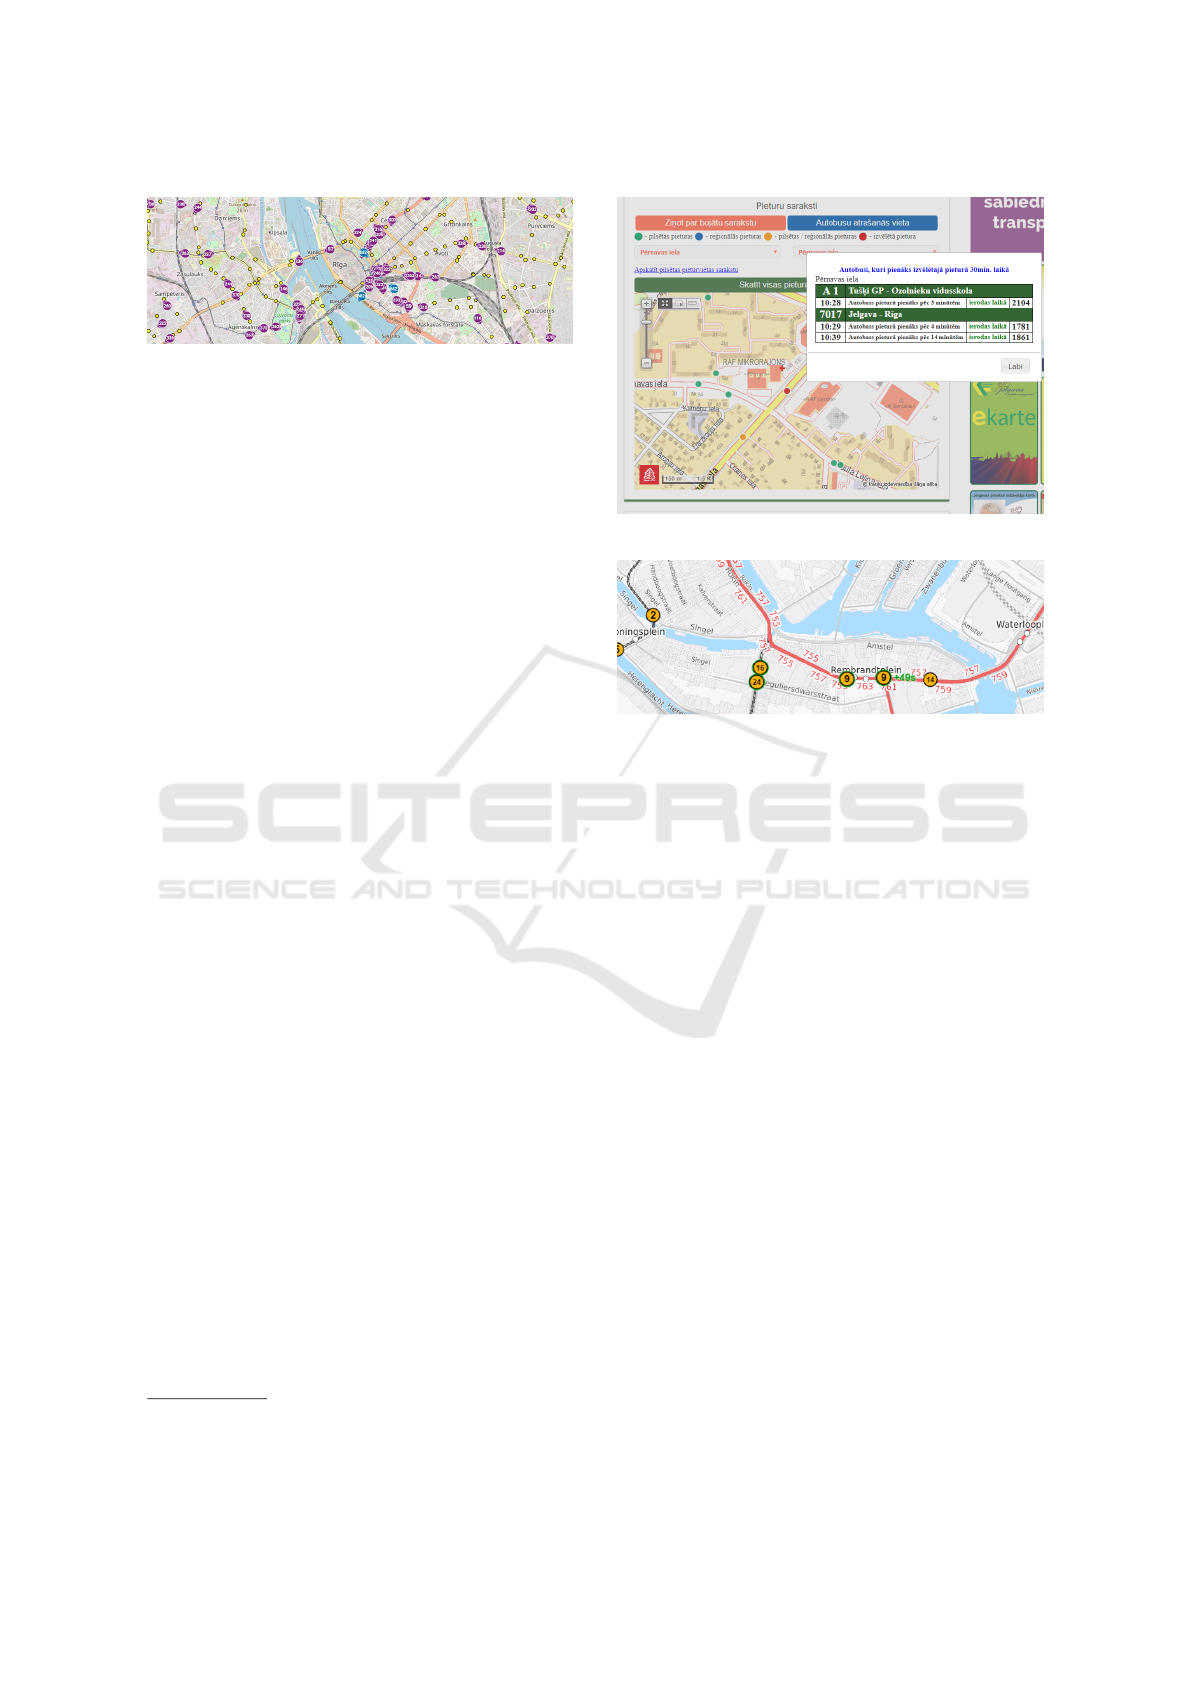
Figure 2: RS web system for minibus location visualisation.
about the citizens’ wish to know not only the transport
scheduled times, but also real location showed that
this is very actual, because 92.7% respondents replied
positively. This allows to re-plan their schedules, in-
form others about possible delays, and consider other
transportation options.
2.2 Existing Intelligent Transportation
Systems in Latvia
Today GPS data is used in many logistic enterprises
to monitor the transport, calculate fuel consumption,
driver work load etc. As well, taxi companies use
transport positioning data for optimising operational
efficiency of the driver, but mainly this data is not for
a public use, but for private enterprise needs. It is
found that in Latvia only two public transport service
providers started to analyse GPS data and provide it
for the public usage. In Riga, Rigas Satiksme devel-
oped mobile and web applications for real-time GPS
data visualisation. Each vehicle, which is equipped
with GPS device is demonstrated on the map, based
on OpenStreetMaps. To get GPS data from vehi-
cle, GET query is sent to the specific web address:
https://marsruti.lv/rigasmikroautobusi/gps.txt. Using
this text file, it is possible to get vehicle number and
it’s exact location. GPS data is updated with 5 sec
intervals. Web system for public use (see Fig 2) is
accessible online
4
. At this moment, only location of
minibuses is shown.
In authors’ home town Jelgava (Jelgava is the
fourth largest city in Latvia, a historical centre of
Zemgales region, distance from Riga is 42 km, res-
idents number is approx. 62 000), local public trans-
port operator "Jelgavas Autobusu Parks" (JAP
5
) also
implemented feature of demonstrating real GPS posi-
tion of the buses. In Jelgava there are twenty local bus
routes. JAP also uses the same approach as RS, using
the Mapon service. But the visualisation approach is
different, JAP shows approaching buses in 30 minutes
time interval to the selected bus stop and not showing
all bus real-time location on map. As well provided
4
https://marsruti.lv/rigasmikroautobusi/#minibus/map/en
5
https://www.jap.lv/?lang=en
Figure 3: JAP web system for bus location visualisation.
Figure 4: TRAVIC web system.
information about bus location is only textual, not vi-
sual (see Fig 3).
Comparing to local systems in the world, there
are TRAVIC (Traffic Visualisation Client), which is
developed by geOps company collaborating with the
University of Freiburg (see Fig 4). This product is
a web-based solution for real-time transport location
visualisation and route demonstration by the static
transport schedule. The application combines static
and real-time schedule data and calculates the current
position of the transport vehicles. TRAVIC solution
uses publicly available open data, which is stored in
General Transit Feed Specification format. To this
moment, system collects data from more than 700
sources mainly from North America and from Cen-
tral Europe (Germany, Switzerland, Netherlands). 66
sources are for real-time data (in the system marked
with green line of the circle) other are static, based on
transport schedule. Real time data is collected using
the GTFS RT format, which is extension of GTFS.
Data transfer is made using Google developed plat-
form independent protocol.
3 RESULTS AND DISCUSSION
As a result of authors developed approach efficient
tool for extracting valuable traffic data from vehicles
is presented. Within this research authors demonstrate
Usage of GPS Data for Real-time Public Transport Location Visualisation
279

Figure 5: GPS module GP-20U7.
simplified approach for GPS data collection, which
can be used in public transport sector without addi-
tional need to buy expensive GPS commercial hard-
ware. The GPS accuracy was accepted to be within
10 meters as the primary use would be for public bus
tracking. This is easily obtained with the most GPS
sensors on the market. As a result, authors demon-
strate developed system and user interface for GPS
data visualisation.
3.1 Developed System for GPS Data
Collection
In authors’ case Raspberry Pi 3 with additional GPS
module GP-20U7 was used (see Fig 5). Based on
technical specification module precision is 2.5m, but
during experiments authors observed location preci-
sion about 9m. An update of GPS coordinates was im-
mediate, when data from GPS module was received,
module sent coordinate updates each second. The
GP-20U7 GPS module is energy efficient and has
only 40mA power consumption. GPS module and
Raspberry Pi is connected using UART interface, and
only 3 wires were necessary – Vcc, GND and RX.
Authors chose to use Raspbian as Raspberry Pi op-
erating system. Software, to communicate with GPS
module, was developed using Python programming
language. Software aim was to get raw GPS data
from GPS module and send values to dedicated cloud
server for further data analysis and visualisation. For
system tests Internet access was shared from mobile
phone, but for the final solution additional 3G/4G
module should be connected to the Raspberry Pi for
persistent Internet access.
Example of data that is sent to the remote database
is shown below. For data transfer to the cloud server
PUT request is used.
{"id":"5ad39422c57f652a8827e225","vehicleId":
"11001","serialNumber":1337,"routeId":"riga_trol_
27","vehicleTypeId":800,"geoData":{"latitude":
56.92166,"longtitude":24.091107,"speed":
0.0,"provider":null,"date":"2018-04-16T19:55:
05.832Z"}}
For public transport GPS data visualisation stand-
alone web system was developed. It is possible to see
real-time transport location based on selected route.
For system development several technologies were
used: NoSQL database MongoDB for data storage,
.NET Core SignalR library, for data transfer from
server to client, web API for GPS data collection. Sig-
nalR library was chosen to implement data exchange
using websockets protocol which allows to faster up-
date data in real time using one websocket connec-
tions. Web API was implemented in REST archi-
tecture style and its main purpose is to allow using
HTTP protocol for getting, updating and adding new
data in database. GPS receivers use web API to up-
date location data and each time corresponding API
method is called, it also calls SignalR hub method
that distributes data to clients who has joined group,
which has been identified by selected route. All ve-
hicle data on given route identifier is distributed to all
clients that has subscribed for vehicle data method.
C# and JavaScript languages were used for server and
client application development. For server-side .NET
Core 2.0 framework version was used. Client side was
made using JavaScript Angular 2 framework. Client
application is integrated in the same solution and de-
ployed on one Azure web application service. Archi-
tecture of the developed system is demonstrated in Fig
6.
3.2 Web System for GPS Data
Visualisation
User interface of the developed system is shown in
Fig 7. Basic idea is, that user choose the needed pub-
lic transport route and stop, afterwards system shows
on the map where is the nearest transport. All RS
public transport routes and stops were integrated from
their publicly available GTFS feed
6
. Feed informa-
tion was converted from .txt to JSON format, us-
ing Javascript library for further data upload to local
database. Google Maps services were used to display
map and location. In case when there is no GTFS feed
for public transport agency, it is possible to retrieve
route data from Google Directions service and with
custom algorithm extract waypoint information and
draw approximate route polylines in map and mark
stops. Based on provided information system user can
see if the public transport has already passed the stop
or is still approaching it.
6
http://saraksti.rigassatiksme.lv/riga/gtfs.zip
VEHITS 2019 - 5th International Conference on Vehicle Technology and Intelligent Transport Systems
280
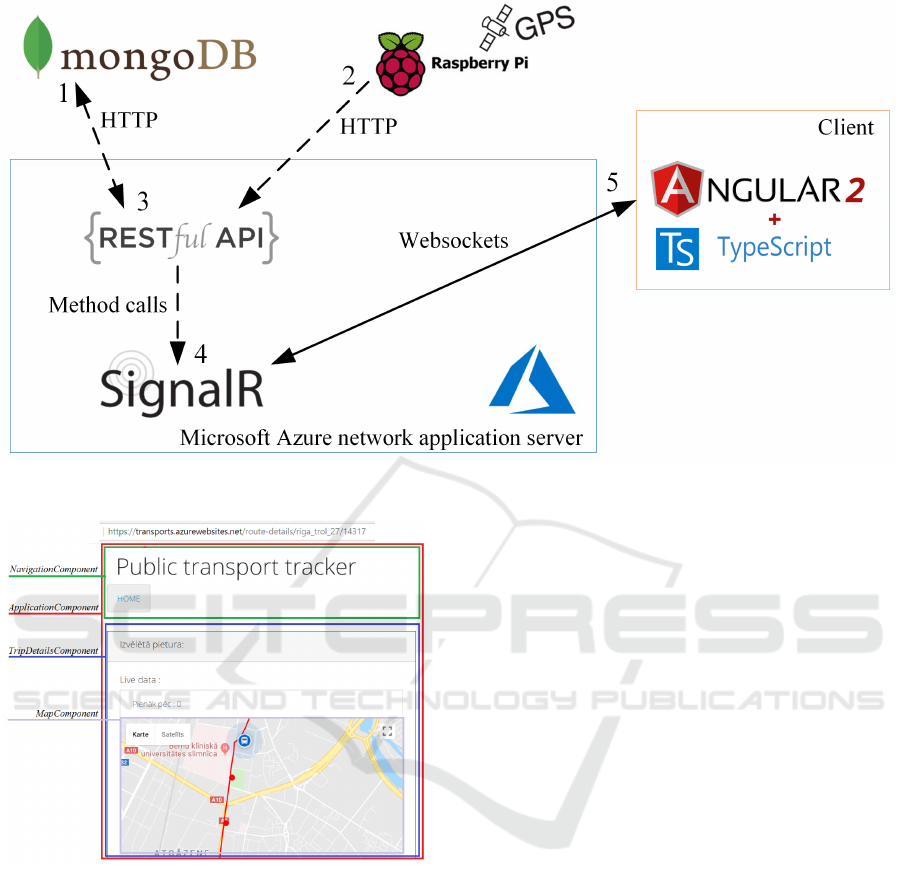
Figure 6: Architecture of the developed system for GPS data visualisation.
Figure 7: User interface of the developed system.
4 CONCLUSIONS
Implementation of GPS data monitoring for pub-
lic transport needs can significantly increase service
quality for its customers and give additional value for
service provider internal needs.
The data provided by the GPS records can be
translated into reliable indicators that will show the
exact position of the bus on the route.
Developed system prototype demonstrates easy
and relatively cheap solution for public transport lo-
cation visualisation for service users based on GPS
data. Developed system eliminates the need for a third
party to maintain the infrastructure and management
of the system.
The GPS location reported by the unit was almost
always accurate to within 10 meters and no loss of sig-
nal was experienced during the testing phase. Know-
ing real-time transport location helps citizens to avoid
unpredictable transport delays and helps to re-plan
their scheduled route.
ACKNOWLEDGMENTS
Scientific research, publication and presentation are
supported by the ERANet-LAC Project „Enabling re-
silient urban transportation systems in smart cities
(RETRACT, ELAC2015/T10-0761)”.
REFERENCES
Albino, V., Berardi, U., and Dangelico, R. M. (2015). Smart
cities: Definitions, dimensions, performance, and ini-
tiatives. Journal of Urban Technology, 22(1):1–19.
Amita, J., Singh, J., and Kumar, G. (2015). Prediction
of Bus Travel Time Using Artificial Neural Network.
International Journal for Traffic and Transport Engi-
neering,, 5(4):410–424.
Bacon, J., Bejan, A., Beresford, A., Evans, D., Gibbens, R.,
and Moody, K. (2011). Using real-time road traffic
data to evaluate congestion, volume 6875 LNCS.
Caragliu, A., del Bo, C., and Nijkamp, P. (2011). Smart
cities in Europe. Journal of Urban Technology,
18(2):65–82.
Usage of GPS Data for Real-time Public Transport Location Visualisation
281

Cohen, Y., Makri, S., Reymann, S., and Kaparias, I. (2017).
User-Centred Design in Public Transport: Discov-
ering Mobile User Needs. In 12th ITS European
Congress, pages 1–17.
Dani Reagan Vivek, J., Gokul Prashanth, R., and Ganesh
Prabhu, B. (2017). Smart transportation system. Im-
perial Journal of Interdisciplinary Research (IJIR),
3(4):1855–1858.
Fan, W. and Gurmu, Z. (2015). Dynamic travel Time
Prediction Models for Buses Using Only GPS Data.
International Journal of Transportation Science and
Technology, 4(4):353–366.
Garg, N., Gawande, P. V., Kurekar, P. P., and Kharat, D. B.
(2017). Bus Tracking using GPS and Real Time Pre-
diction. International Research Journal of Engineer-
ing and Technology(IRJET), 4(4):3477–3479.
Giffinger, R. (2007). Smart cities Ranking of European
medium-sized cities. October, 16(October):13–18.
Hall, R. E., Bowerman, B., Braverman, J., Taylor, J., and
Todosow, H. (2000). The vision of a smart city. 2nd
International Life . . . , 28:7.
Harrison, C., Eckman, B., Hamilton, R., Hartswick, P.,
Kalagnanam, J., Paraszczak, J., and Williams, P.
(2010). Foundations for Smarter Cities. IBM Jour-
nal of Research and Development, 54(4):1–16.
Jadhav, A., Kodre, A., Shejul, P., Awaghad, S., and Shirke,
S. (2017). Smart Bus System Implementation of
Smart Ticketing and Bus Tracking System. Interna-
tional Education and Research Journal, 3(1):2016–
2017.
Khot, S. and Yadav, R. (2016). GPS Tracking System
for Public Transport. International Journal of Ad-
vanced Research in Computer Engineering & Tech-
nology, 5(6):2278–1323.
Kviesis, A., Zacepins, A., Komasilovs, V., and Munizaga,
M. (2018). Bus arrival time prediction with limited
data set using regression model. In Proceedings of the
4th International Conference on Vehicle Technology
and Intelligent Transport Systems (VEHITS 2018),
pages 643–647.
Lima, S., Barbosa, S., Palmeira, P., Matos, L., Secundo,
I., and Nascimento, R. (2017). Systematic Review:
Techniques and Methods of Urban Monitoring in In-
telligent Transport Systems. In ICWMC 2017 : The
Thirteenth International Conference on Wireless and
Mobile Communications, pages 1–5.
Liu, Y., Weng, X., Wan, J., Yue, X., Song, H., and Vasi-
lakos, A. V. (2017). Exploring Data Validity in Trans-
portation Systems for Smart Cities.
Mintsis, G., Basbas, S., Papaioannou, P., Taxiltaris, C., and
Tziavos, I. N. (2004). Applications of GPS technology
in the land transportation system.
Nam, T. and Pardo, T. A. (2011). Conceptualizing smart
city with dimensions of technology, people, and in-
stitutions. In Proceedings of the 12th Annual Inter-
national Digital Government Research Conference on
Digital Government Innovation in Challenging Times
- dg.o ’11, pages 282–291.
Nasim, R. and Kassler, A. (2012). Distributed Architectures
for Intelligent Transport Systems: A Survey. In 2012
Second Symposium on Network Cloud Computing and
Applications (NCCA), pages 130–136.
Partridge, H. (2004). Developing a Human Perspective to
the Digital Divide in the Smart City. ALIA 2004 Bien-
nial Conference Challenging Ideas, page 7.
Suganya, S. and Valarmathi, A. (2017). Gps Enabled An-
droid Application for Bus Schedule System. Inter-
national Journal of Scientific Research in Computer
Science, Engineering and Information Technology,
2(3):2456–3307.
Washburn, D., Sindhu, U., Balaouras, S., Dines, R. A.,
Hayes, N. M., and Nelson, L. E. (2010). Helping
CIOs Understand "Smart City" Initiatives: Defining
the Smart City, Its Drivers, and the Role of the CIO.
Cambridge, MA: Forrester Research, Inc.
Yin, T., Zhong, G., Zhang, J., He, S., and Ran, B. (2017).
A prediction model of bus arrival time at stops with
multi-routes. In Transportation Research Procedia,
volume 25, pages 4627–4640.
VEHITS 2019 - 5th International Conference on Vehicle Technology and Intelligent Transport Systems
282
