
Prediction of Learning Improvement in Mathematics through a Video
Game using Neurocomputational Models
Richard Torres-Molina
1
, Andr
´
es Riofr
´
ıo-Valdivieso
1
, Carlos Bustamante-Orellana
1
and Francisco Ortega-Zamorano
2
1
School of Mathematical Science and Information Technology, Yachay Tech University, Urcuqu
´
ı, Ecuador
2
Department of Computer Sciences and Languages, Universidad de M
´
alaga, M
´
alaga, Spain
Keywords:
Neurocomputational Model, Mathematics, Learning, Video Game.
Abstract:
Learning math is important for the academic life of students: the development of mathematical skills is
influenced by different characteristics of students such as geographical position, economic level, parents’ edu-
cation, achievement level, teacher objectives, social level, use of information and communication technologies
by teachers, learner motivation, gender, age, preferences for playing video games, and the school year of the
students. In this work, these previously mentioned characteristics were considered as the attributes (inputs) of
a multilayer neural network that uses a backpropagation algorithm to predict the percentage of improvement in
mathematics through a 2D mathematical video game that was developed to allow the children to practice addi-
tion and subtraction operations. After applying the neural model, using the twelve attributes mentioned before
and the backpropagation algorithm, there was a network of one layer with ten neurons and another network
of two layers with 5 neurons in the first layer and 20 neurons in the second layer. Both architectures produced
a mean squared error smaller than 0.0069 in the prediction of the student’s percentage of improvement in
mathematics, being the best configurations found in this study for the neural model. These results lead to the
conclusion that we are able to predict the percentage of improvement in math that the students could achieve
after playing the game, and therefore, claiming if the video game is recommendable or not for certain students.
1 INTRODUCTION
Mathematics can be described as a science that in-
vestigates abstract structures in order to create by it-
self logical definitions using properties and patterns
(Ziegler and Loos, 2016). Different studies agree
that learning math is difficult for students (Stoica,
2015)(Hurst and Cordes, 2017). Furthermore, the
way students describe their identity towards this sub-
ject, such as that of being a ”math hater” is related
to their learning opportunities. Therefore, teaching
mathematics in a way that students enjoy learning
concepts and solving exercises has become a chal-
lenge, making it necessary to find a new technique
to promote the study of this science (Andersson et al.,
2015).
Information Communication Technologies (ICT)
have gained an important role in teaching; many
countries have invested in the acquisition and main-
tenance of devices used in education (Comi et al.,
2017a). Of course, the effective use of ICT will de-
pend on the practice that teachers make of it (Comi
et al., 2017a). One improvement in the teaching
of mathematics is the use of ICT through mobile
technologies, virtual learning environments (VLE),
personal learning environments (PLE) (Borba et al.,
2016), and video games. Computer-based interac-
tive educational methods in teaching allow students
to increase their mathematical performance and re-
duce failures at solving a task (Comi et al., 2017b;
Pachemska et al., 2014).
Video games are an innovative approach to im-
prove the cognitive abilities and mathematical skills
of the students (Boot et al., 2008). A study had shown
that educational math games like ”Monkey Tales: The
Museum of Anything” have a positive effect on the
mathematical performance during gameplay (Vander-
cruysse et al., 2015). In another study, the arithmetic
performance between a math game and paper exer-
cises were tested with 52 children divided into two
groups with a time stamp of three weeks. The first
group adopted the game ”Monkey Tales”: the second
554
Torres-Molina, R., Riofrío-Valdivieso, A., Bustamante-Orellana, C. and Ortega-Zamorano, F.
Prediction of Learning Improvement in Mathematics through a Video Game using Neurocomputational Models.
DOI: 10.5220/0007348605540559
In Proceedings of the 11th International Conference on Agents and Artificial Intelligence (ICAART 2019), pages 554-559
ISBN: 978-989-758-350-6
Copyright
c
2019 by SCITEPRESS – Science and Technology Publications, Lda. All rights reserved
one used paper exercises. Through a series of mea-
sures in working memory, visuomotor skills, affec-
tive and cognitive learning, it was shown that game
training has a better affective response, and the stu-
dents’ scores were higher in the game training than
paper exercises; however, future research in the use
of games for educational purposes is in continuous
development (Castellar et al., 2015).
An artificial neural network (ANN) is a system
based on perceptrons interconnections, it tries to sim-
ulate neural connections that exist in the brain in order
to resolve classification, pattern recognition, and opti-
mization problems. The multilayer perceptron (MLP)
is a neural set that is connected between adjacent lay-
ers, this process adapts the weight in order to mini-
mize the output respect the real values through back-
propagation (Ramchoun and Ettaouil, 2016; Sankar
et al., 1992; Silva et al., 2008). The MLP was used
because statistical analysis cannot always classify and
predict the desired outcomes. Moreover, MLP has
been used in some fields as meteorology, economy,
business, and learning (Musso et al., 2013).
Due to the predictive capabilities of back prop-
agation (BP) and learning improvement in children
through video games, this work used 360 children and
a neural network in order to predict the percentage of
improvement in their mathematical skills after play-
ing a 2D mathematical video game.
2 METHODOLOGY
Artificial neural networks were used to analyze data
gathered to predict the influence of playing a game
and its relation to the percentage improvement in
mathematics of a group of children. To get permis-
sion to test the game and collect student information
we sent authorization letters to different schools from
Imbabura, Ecuador. The data collected corresponds
to 360 students in eighth and ninth grades of primary
education.
We developed a 2D mathematical video game us-
ing the Unity 3D engine, C] programming language,
PHP, MySQL, and models from Unity Technologies
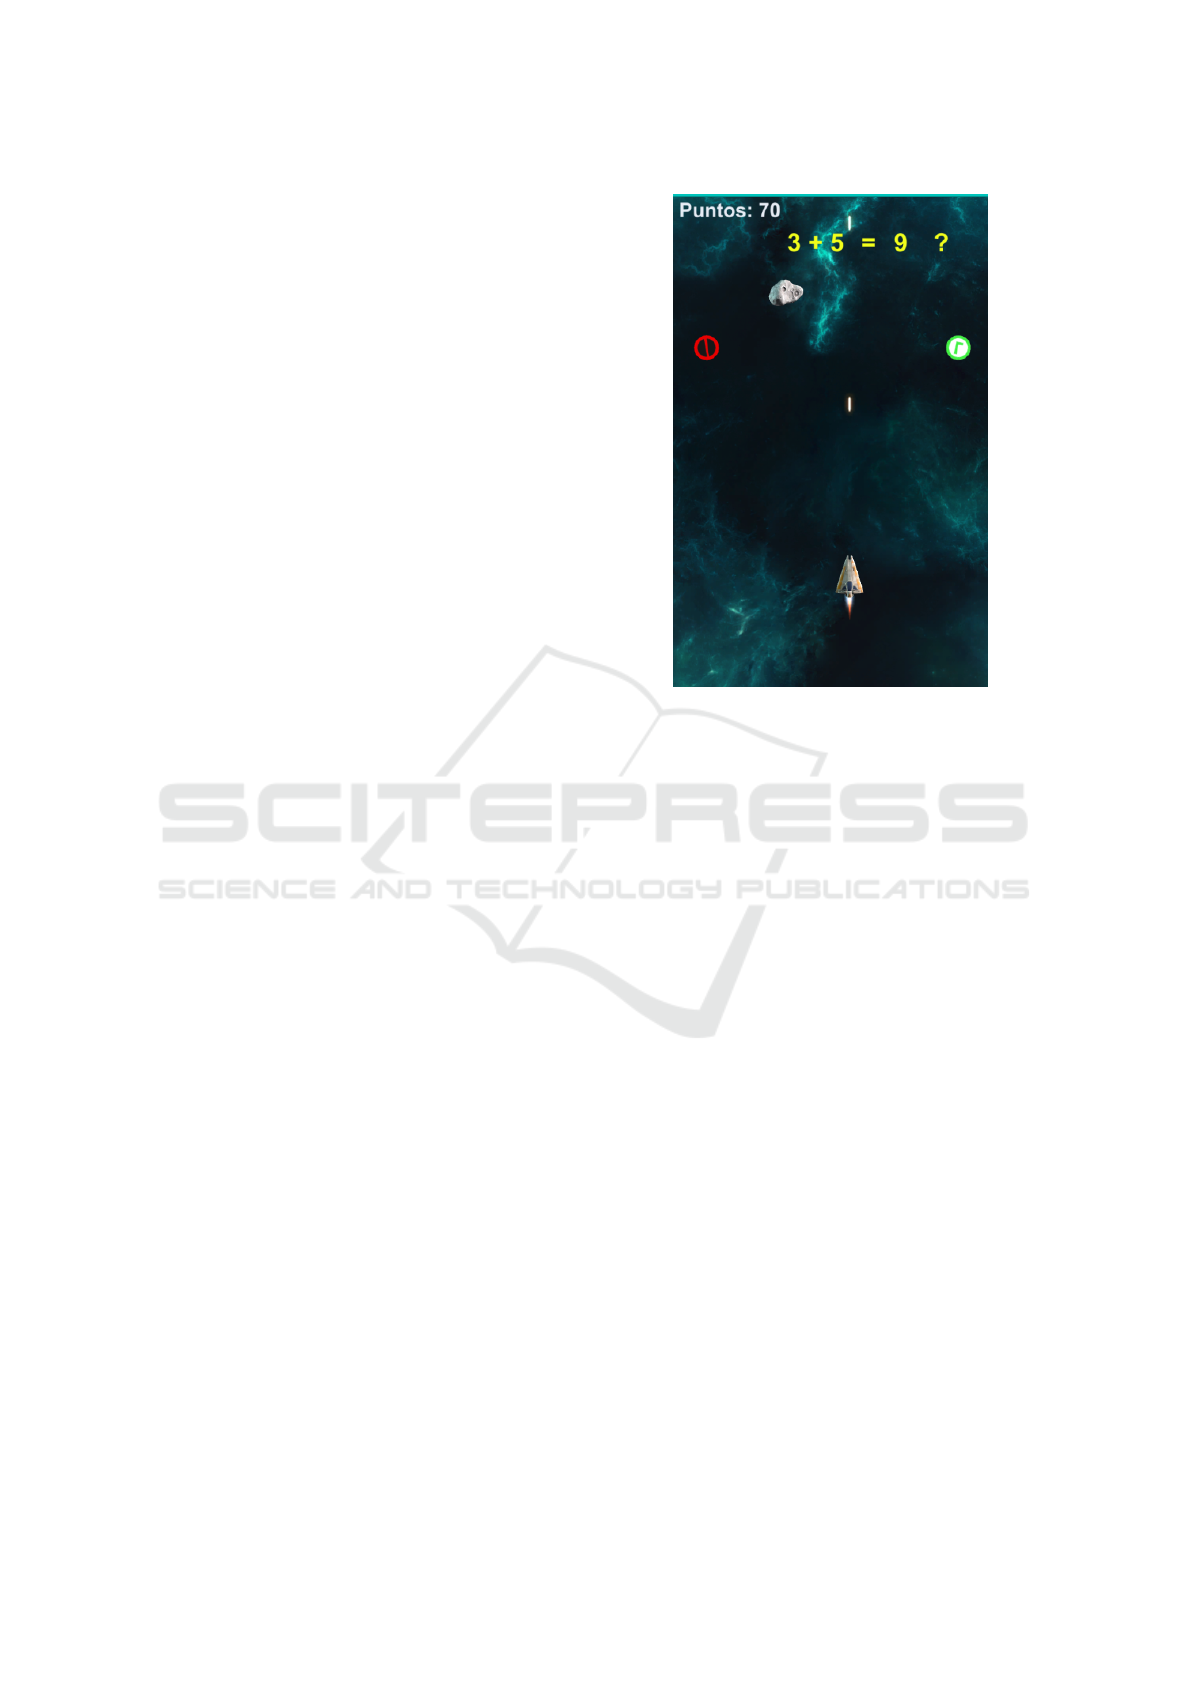
(Technologies, 2014). The goal of the game is to solve
sums by making a spaceship shoot up toward a green
symbol if the answer is correct, and the red symbol
otherwise (see Fig.1). Depending on the answer, stu-
dents gain points or lose them. The objective is to
engage the student through an enjoyable learning ex-
perience in a time-sensitive game to solve obstacles
and math problems. The game stimulates students to
progress by increasing the difficulty in the math prob-
lems and obstacles (rocks) through three levels: easy,
Figure 1: Screen shot of the mathematical educational video
game.
medium, and difficult. Students can exceed each level
by acquiring a score of 100. In the game, the collected
data was each student’s name, score, and session time.
The data used in the ANN include the results of
math test each student took before and after playing
the game. The data also includes information ob-
tained from a questionnaire applied to each student
before participating in the activities. The following is
a list of the attributes collected gathered by the ques-
tionnaire:
1. Geographical position
2. Economic level
3. Parents’ education
4. Achievement level
5. Teacher objectives
6. Social level
7. Use of ICT by teachers
8. Learner motivation
9. Gender
10. Age
11. Preferences for playing video games
12. School year
The qualitative nature of some of the attribute items
on the questionnaire required a scale from 1 to 5,
whereas yes or no items required a scale from 1 or
0; all of the quantitative answers were then summed
Prediction of Learning Improvement in Mathematics through a Video Game using Neurocomputational Models
555
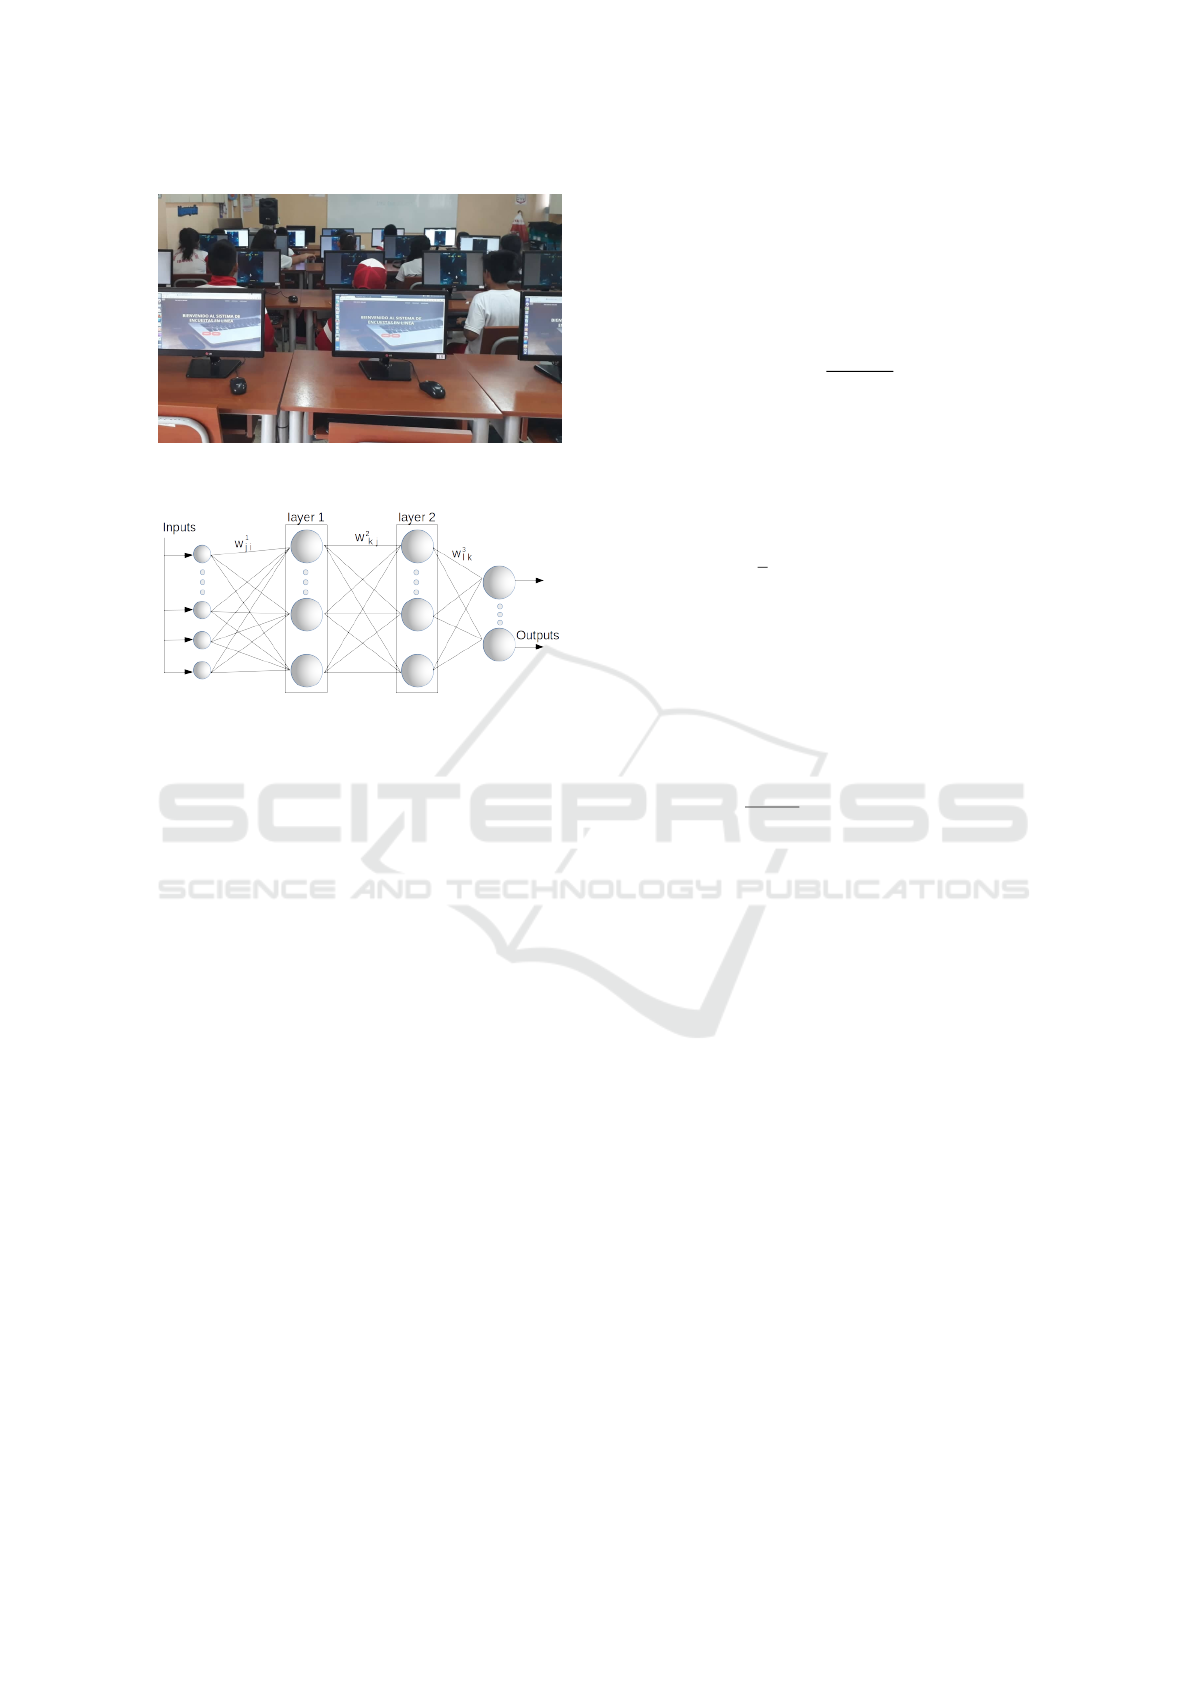
Figure 2: Students taking the tests and playing the video
game.
Figure 3: Back propagation architecture of two layers and n
inputs.
to obtain a final result for each attribute for each of
the students.
The math test consisted of 30 addition problems
divided into three categories. The easy category
involved sums of numbers between 0 and 20, the
medium category involved sums of numbers between
-40 and 40, and the difficult category involved num-
bers between -100 and 100.
The students took a 30 item addition test before
they played the video game to establish a database
of scores by item difficulty. Then, after the students
played the game, they retook a 30 item addition test to
see whether there was an improvement in their scores.
A total number of 360 students from different
schools of Urcuqu
´
ı and Ibarra participated in the pre-
test, the video game play, and the post-test (see Fig.
2). The collected data was input into the multiple
layer neuronal network that implements the BP al-
gorithm to predict the percentage of improvement in
math skills using a video game.
The neural networks of multiple layers have the
BP algorithm as a method of learning, Fig. 3 shows
a diagram of this architecture. The main equations of
this algorithm are summarized.
Let n,i be the entire numbers, the activation of the
neurons through its synaptic potential y
i
belonging to
the hidden n
i
is given by (1),
y
i
= g(
L
∑
j=1
w
i j
· s
j
) = g(h) (1)
where h represents the synaptic potential, w
i j
are the
synaptic weights between neuron i in the current layer
and the neurons of the previous layer with activation
s
j
. Furthermore, the sigmoid activation function is
given by (2),
g(x) =
1
1 − e
−βx
(2)
The primary objective of BP is to reduce the error
obtained by modifying the synaptic weights, to obtain
a minimum difference between targets (given outputs)
and network outputs. The error is given in (3),
E =
1
2
p
∑
k=1
M
∑
i=1
(z
i
(k) − y
i
(k))
2
(3)
where the first sum is on the p patterns of the data
set and the second sum is on the M output neurons.
z
i
(k) is the target value for output neuron i for pattern
k and y
i
(k) is the corresponding response output of
the network. The synaptic weights between two last
layers of neurons are given by (4),
4 w
i j
(k) = −η
∂E
∂w
i j
(k)
= η[z
i
(k) − y
i
(k)]g
0
i
(h
i
)s
j
(k) (4)
where η is the learning rate and g
0
is the derivative
of the sigmoid function y
i
, and the other weights are
modified according to deltas (δ) that propagate the er-
ror.
Training and Validation Processes: The training was
executed on a controlled form. The weights in the first
epoch were obtained with random numbers adjusting
the synaptic weights in an on-line manner. To alle-
viate overfitting, we split the set of available training
patterns, into training, validation, and test sets. The
training set adjusted the synaptic weights as shown in
(4) and the validation set was used to control overfit-
ting effects.
3 RESULTS
We obtained questionnaire and math tests data of 360
students of both genders between the ages of 12 and
14, used as the ANN attributes (inputs) and target
value.
The resulting dataset consists of twelve attributes
representing the inputs of our neurocomputational
model, and the only output of the model is the stu-
dents’ percentage of improvement as seen in Fig. 4,
calculated by the difference between the grades on
ICAART 2019 - 11th International Conference on Agents and Artificial Intelligence
556
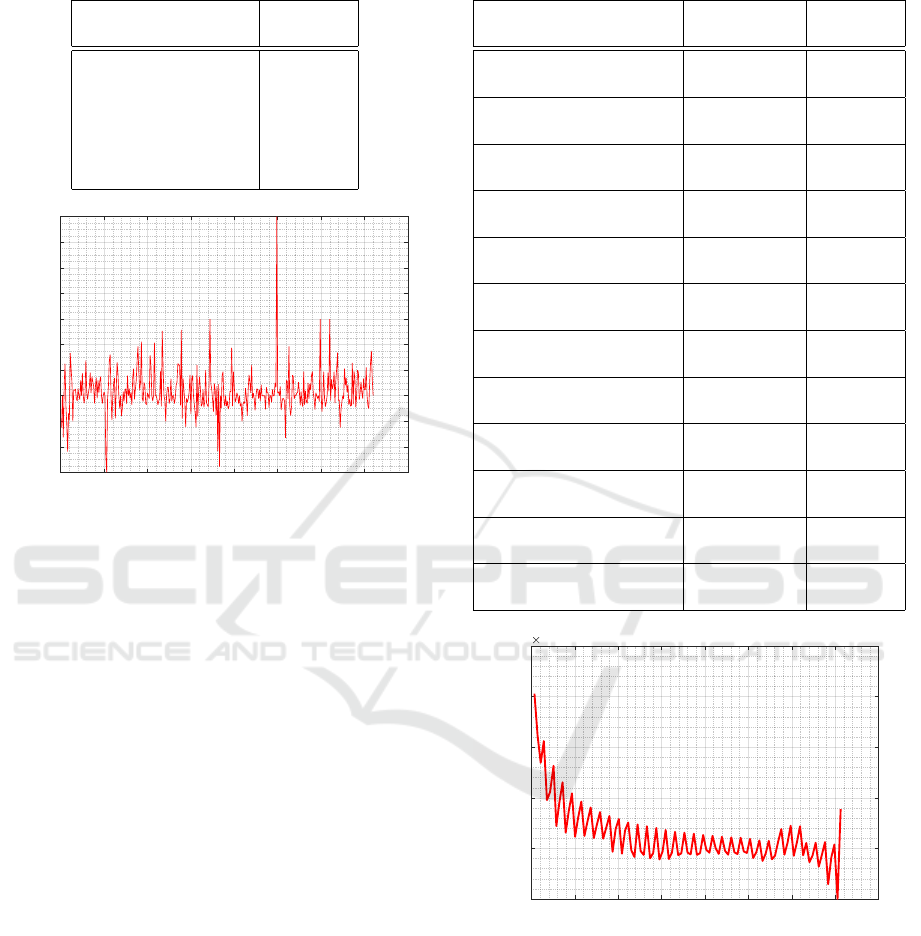
Table 1: MSE for different architecture neural network
models.
Architecture Models MSE
5 0.006998
10 0.006853
20 0.007218
5-10 0.006900
5-20 0.006854
10-20 0.006869
Student Number
0 50 100 150 200 250 300 350 400
Improvement Percentage
0
0.1
0.2
0.3
0.4
0.5
0.6
0.7
0.8
0.9
1
Figure 4: Improvement percentage calculated by the differ-
ence between the grades on the post- and pre- tests.
the post- and pre- tests divided by the grade on the
pre-test. The BP model training was done with the
normalized data set using a ten-fold cross-validation
procedure to predict student improvement after play-
ing the game.
Standard parameter values were used for train-
ing and testing the neural network model, using 1000
for the maximum number of iterations, η = 0.1 and
β = 1/2. A validation procedure was performed to
avoid the overfitting problems. The training dataset
was divided into two sub-dataset with a percentage of
70% to the training dataset and 30% to the validation
dataset.
Table 1 shows the mean squared error (MSE) ob-
tained from the prediction of the learning percent-
age when using the BP algorithm in the neural net-
work with different architectures models and twelve
attributes. The architectures used had one and two
layers, with a respective number of neurons used in
each layer.
Table 2 shows the MSE obtained in the predic-
tion of the improvement percentage of each student
in performing sums of integer numbers after playing
the video game when one of the twelve attributes is
removed. This approach was done using a ten-fold
cross-validation procedure with the two best architec-
ture models found in Table 1. The first column of
Table 2 indicates the removed attribute, the next col-
Table 2: MSE of best architecture neural network models
from Table 1 without one attribute.
Attribute
Architecture
MSE
Models
Geographical position
10 0.007125
5-20 0.006811
Economic level
10 0.006840
5-20 0.006833
Parents education
10 0.006832
5-20 0.007019
Achievement level
10 0.006944
5-20 0.006873
Teacher objectives
10 0.006871
5-20 0.006893
Social level
10 0.006851
5-20 0.007027
Use of ICT by teachers
10 0.006953
5-20 0.006861
Learning motivation
10 0.006870
5-20 0.006864
Gender
10 0.006907
5-20 0.007137
Age
10 0.006964
5-20 0.006842
Liking for video games
10 0.006865
5-20 0.006833
School year
10 0.007063
5-20 0.006826
0 50 100 150 200 250 300 350 400
Students Number
6
7
8
9
10
11
MSE
10
-3
Figure 5: MSE as a function obtained from the percentage
training data using twelve attributes in the BP algorithm.
umn shows the architecture used, and the last one the
MSE associated to that architecture respectively.
Fig. 5 illustrates the MSE using a BP neural net-
work model with different number of students in the
training set, which represent a percentage in the range
1% and 99%. Also, the BP algorithm was run 100
times using the twelve attributes, and an architecture
model of two layers with 5 and 20 neurons in each
layer respectively.
Prediction of Learning Improvement in Mathematics through a Video Game using Neurocomputational Models
557

4 DISCUSSION AND
CONCLUSIONS
The experiment was run to test for math improvement
in eighth and ninth grade students using the educa-
tional video game. In this sense, a BP model was
used to predict the percentage of learning growth of
students with specific characteristics.
The resulting characteristics (or attributes) gath-
ered were those that may show a significant relation-
ship with the performance of the students in math-
ematics which may determine the efficiency of the
game in such students. As such, the BP algorithm
can be used to predict how much the students are able
to improve their skills in mathematics by playing the
video game.
The characteristics of each student were used to
train an artificial neural network model using a nor-
malization of the data and a cross-validation proce-
dure in order to obtain the MSE of the prediction with
different architectures.
The MSE obtained in Table 1 and Table 2 is lower
than 0.0069 in most of the cases, therefore, we ob-
tained an efficient predictor. As shown in Table 1, the
one layer 10 neurons and two layers 5 and 20 neurons
architecture models have better results (smaller MSE)
in the prediction of the percentage of improvement in
comparison with the other ones used, when using the
twelve attributes.
From the results obtained in Table 2, the model
that gets better predictions is the one that uses an ar-
chitecture of two layers with 5 and 20 neurons, with
the geographical attribute position removed. We were
able to remove the geographical attribute because it
increased the MSE with this architecture.
Fig. 5 shows how as the training dataset (students
number) increases the MSE diminishes and then starts
to have a decrease in the 1%, reaching the smallest
MSE when the training dataset was 98% equivalent to
approximately 353 students, to then obtain an overfit-
ting problem when the training dataset was 99%.
For future work, the data collected can be used to
do a classification of the percentage learning rate us-
ing the BP algorithm taking a multi-class output de-
pending on an interval learning rate. The attributes
that were evaluated can be studied in more detail with
the use of a Self-Organizing Map (SOM), to estab-
lish what attribute or combination of attributes can
enhance the prediction in student learning.
As an overall conclusion, the results presented in
this work show that when the BP algorithm with all
the attributes was used, the best neurocomputational
model was one layer with 10 neurons, in comparison
when the geographical position was deleted, the best
architecture was two layers with 5 and 20 neurons,
to predict the student percentage of improvement in
mathematics after the use of a video game, and there-
fore, claiming if the video game is recommendable or
not for certain students.
ACKNOWLEDGEMENTS
The authors acknowledge support from Unidad
Educativa “Eloy Alfaro”, from Unidad Educativa
“Teodoro G
´
omez de la Torre”, and from Universidad
Yachay Tech, School of Mathematical Science and In-
formation Technology.
REFERENCES
Andersson, A., Valero, P., and Meaney, T. (2015). I am
[not always] a maths hater: Shifting students’ identity
narratives in context. Educational Studies in Mathe-
matics, pages 143–161.
Boot, W. R., Kramer, A. F., Simons, D. J., Fabiani, M., and
Gratton, G. (2008). The effects of video game play-
ing on attention, memory, and executive control. Acta
Psychologica, pages 387 – 398.
Borba, M., Askar, P., Engelbrecht, J., Gadanidis, G.,
Llinares, S., and Sanchez Aguilar, M. (2016). Blended
learning, e-learning and mobile learning in mathemat-
ics education. ZDM Mathematics Education, pages
589–610.
Castellar, E. N., All, A., de Marez, L., and Looy, J. V.
(2015). Cognitive abilities, digital games and arith-
metic performance enhancement: A study comparing
the effects of a math game and paper exercises. Com-
puters and Education, 85:123 – 133.
Comi, L., Argentin, G., Gui, M., Origoc, F., and Pagani, L.
(2017a). Is it the way they use it? teachers, ict and stu-
dent achievement. Economics of Education Review,
pages 24–39.
Comi, S. L., Argentin, G., Gui, M., Origo, F., and Pagani, L.
(2017b). Is it the way they use it? teachers, ict and stu-
dent achievement. Economics of Education Review,
pages 24 – 39.
Hurst, M. and Cordes, S. (2017). Understanding Emotions
in Mathematical Thinking and Learning. Academic
Press, 1st edition.
Musso, M., Kynd, E., Cascallar, E., and Dochy, F. (2013).
Predicting general academic performance and iden-
tifying the fifferential contribution of participating
variables using artificial neural networks. Frontline
Learning Research, pages 42–71.
Pachemska, S., Atanasova-Pachemska, T., Iliev, D., and
Seweryn-Kuzmanovska, M. (2014). Analyses of stu-
dent’s achievement depending on math teaching meth-
ods. Procedia - Social and Behavioral Sciences, pages
4035 – 4039.
ICAART 2019 - 11th International Conference on Agents and Artificial Intelligence
558

Ramchoun, H., M. A. J. I. Y. G. and Ettaouil, M. (2016).
Multilayer perceptron: Architecture optimization and
training. International Journal of Interactive Multi-
media and Artificial Intelligence, 4(1):26–30.
Sankar, K., Jerez, J., and Franco, L. (1992). Multilayer per-
ceptron, fuzzy sets, and classification. IEEE Transac-
tions on Neural Networks, 3:683 – 697.
Silva, L., Marques, J., and Alexandre, L. (2008). Data clas-
sification with multilayer perceptrons using a general-
ized error function. ELSEVIER, 21:1302–1310.
Stoica, A. (2015). Using math projects in teaching and
learning. Proceedings of the 13th International
Congress on Mathematical Education, pages 702–
708.
Technologies, U. (2014). Space shooter tutorial.
Vandercruysse, S., Maertens, M., and Elen, J. (2015). De-
scription of the educational math game monkey tales:
The museum of anything. pages 27–43.
Ziegler, G. and Loos, A. (2016). What is mathematics? and
why we should ask, where one should experience and
learn that, and how to teach it. Proceedings of the 13th
International Congress on Mathematical Education,
pages 63–77.
Prediction of Learning Improvement in Mathematics through a Video Game using Neurocomputational Models
559
