
Interactive Visualization of Differences between Software Model Versions
Jakub Ondik and Karol R
´
asto
ˇ
cn
´
y
Institute of Informatics, Information Systems and Software Engineering, Faculty of Informatics and Information
Technologies, Slovak University of Technology in Bratislava, Ilkovicova 2, Bratislava, Slovakia
Keywords:
Software Model, UML, Change Detection, Change Visualization.
Abstract:
During the development of software systems, various software models are created in the software design phase.
The models are being further modified not only by customers’ changes in system requirements, but as well by
design decisions based on problems being solved. These changes are sometimes not visible without previous
familiarity with original versions of software models, which can cause loss of efficiency not only for software
analysts, but also for developers, who must reflect these modifications into source code. The solution to these
problems can be found in the proposed method for visualization of modifications in software models, which
visualizes modifications directly in diagrams and supports interaction with the modifications. As the basis
for the difference detection, we propose an extendible modelling architecture. We evaluate this architecture
and the proposed method via working prototype which compares two model versions given in XMI form and
visualizes their differences. The evaluation proves that our method significantly shortens time necessary to
detect differences by developers and also decreases a number of unidentified differences.
1 INTRODUCTION
Visualization of modifications in evolving software
models allows developers to efficiently identify the
parts of models, which are modified. Due to this fact,
this visualization is important not only for software
analysts, who are designing and creating the model,
but also for software developers, who are reflecting
these changes into source code.
Software analysts and developers use various tools
for visualization of modifications in software mod-
els, both standalone tools (e.g., a tool implemented
in IBM Rational Rhapsody
1
) and extensions for ex-
isting modelling tools (Ohst et al., 2003). These tools
are often different not only in the visualization tech-
niques, but they also differ in supported model and
element types.
In this paper we provide an overview of existing
tools and approaches for visualization of modifica-
tions in software models along with their shortcom-
ings. We also propose the method for difference de-
tection in software models and the method for visu-
alization of modifications in software models, which
supports multiple context-based views in a form of
standalone tool and aims to overcome the shortcom-
1
https://www.ibm.com/us-en/marketplace/rational-
rhapsody
ings of similar existing tools.
For evaluation purposes we propose the prototype
with architecture that supports re-usability of imple-
mented extensions for multiple software modelling
tools and for tool-independent web interface.
The paper is structured as follows. Section 2 de-
scribes related work in the area of software model
modifications visualization. The proposed method for
difference detection in software models is defined in
Section 3. Following section introduces main contri-
bution of this work in the method for software models
modifications visualization. Section 4 describes pro-
posed prototype, evaluation approach of the proposed
methods and evaluation results. The last section con-
cludes contributions of the paper and discusses future
work and applicability of the proposed method in real
software development projects.
2 RELATED WORK
One of the existing tools providing visualization
of modifications in software models is an exten-
sion (Niere, 2004) for an UML CASE tool called Fu-
jaba Tool Suite (Burmester et al., 2004). This exten-
sion, however, uses extended internal metamodel of
Fujaba, which makes it non-reusable for other meta-
264
Ondik, J. and Rásto
ˇ
cný, K.
Interactive Visualization of Differences between Software Model Versions.
DOI: 10.5220/0007345502640271
In Proceedings of the 7th International Conference on Model-Driven Engineering and Software Development (MODELSWARD 2019), pages 264-271
ISBN: 978-989-758-358-2
Copyright
c
2019 by SCITEPRESS – Science and Technology Publications, Lda. All rights reserved

models, such as UML metamodel. It also only sup-
ports Fujaba-specific XMI format with support for
Poseidon for UML
2
. This extension supports visual-
ization of modifications only in class diagrams.
Fujaba Tool Suite visualizes modifications di-
rectly in class diagrams, while removals are high-
lighted with red color, and additions are highlighted
with green color. Changes in elements are visualized
with small U mark by their side, signifying an up-
date. This extension does not support visualization
of relations modifications and it does not support vi-
sualization of movements of elements at all (e.g., a
movement of an attribute between two classes).
UMLDiff
cld
(Girschick and Darmstadt, 2006) rep-
resents an algorithm for visualization of modifications
directly in class diagrams. In a case of modification,
whole modified part of element or element itself, is
highlighted by color specific to modification type, e.g.
if only a type of an attribute is modified, whole at-
tribute is highlighted. UMLDiff
cld
uses eight colors
for each of supported modification type, such as suc-
cessful and unsuccessful element mapping between
versions of models, additions, removals, original and
current positions of elements, cloning and changes.
This can result in insufficient clarity of the visualiza-
tion and can also result in high cognitive load for users
along with high initial need to learn which color cor-
responds to which modification type. UMLDiff
cld
also
uses its own XML-based model format.
The extension for tool PISET (Kelter et al., 1999;
Ohst et al., 2003) adds visualization of movements
of elements in class diagrams via double-head arrows
between removals and additions. The extension visu-
alizes additions by green borders and removals by red
borders. Modifications of elements (e.g. a change of
an attribute’s type) are not visualized, they are simply
visualized as removal and addition operations.
The PISET extension also supports filtration of
modifications by element types, model versions, and
referenced modifications. Elements that are filtered
out are visualized by gray color.
uml3d
3
is the 3D UML modelling tool that sup-
ports real-time collaboration inspired by web-based
document sharing tools (Ferenc et al., 2017). The tool
stores users’ modifications and it gives users an op-
portunity to use a timeline to visualize modifications
in the model. By interaction with the timeline, users
can see historical state of the model, while they see
the last five modification flagged by authors’ flag for
each timeline’s point. Details about modifications are
displayed by hovering over the flags. This visualiza-
tion approach has good collaboration possibilities, but
2
http://www.gentleware.com/
3
http://uml3d.herokuapp.com/
it requires from developers to observe and to remem-
ber full model’s history.
Sparx Enterprise Architect
4
provides, in addition
to software modelling features, means to create model
versions in form of snapshots and their further com-
parison with other model versions. This comparison
is visualized in a table containing list of all properties
of compared element in the first column. In the sec-
ond column current values of the element’s properties
are shown, while in the third column snapshot values
of the element are shown. The non-matching values
are highlighted with green color.
Enterprise Architect also supports visualization of
modifications directly in the diagrams
5
. However,
only three types of modifications are supported: an el-
ement movement in the diagram, an element removal
from the diagram and an element addition to the di-
agram. Visualization of modifications in relations or
element parts, such as change of attribute type, are
not supported directly in the diagram, only in a table
view. Unlike the previous tools, Enterprise Architect
supports XMI model format for multiple UML ver-
sions along with its own UML extensions.
Similarly to Enterprise Architect, the tool IBM
Rational Rhapsody DiffMerge
6
visualizes modifica-
tions in a table view and in diagrams. Visualization
of modifications in diagrams is realized via side-by-
side view, while the reference version of the diagram
highlights removed elements and relations with blue
color and the current version of the diagram highlights
added elements and relations with green color. Mod-
ification of attributes, inner properties of elements
(e.g. relations’ types), or movements of elements are
not visualized in diagrams.
The modification visualization by side-by-side
view is often used in comparing textual documents.
But in case of software models, this visualization
is not optimal. In contrast with textual docu-
ments, software models contain multiple types of ele-
ments (Elaasar et al., 2018) and they are not read from
top to bottom, so developers have to provide more
complex visual comparisons and mappings between
compared models.
The presented related tools and methods were se-
lected for their ability to visualize modifications di-
rectly in diagrams. In general, we can conclude short-
comings of the-state-of-the art, with respect to tools
using tabular visualization (e.g., EMF Compare
7
), to
following points:
4
http://sparxsystems.com/products/ea/
5
http://sparxsystems.com/resources/diff/
6
http://bit.ly/IBM Rational Rhapdosy DiffMerge
7
https://www.eclipse.org/emf/compare/
Interactive Visualization of Differences between Software Model Versions
265

• limited visualization of modifications to dia-
grams’ types,
• lack of visualization for movements of elements’
parts and elements themselves,
• missing support for common, standardized, data
format, e.g. XMI,
• visualization limited to small amount of modifica-
tion types,
• missing visualization of modification of relations
and stereotypes,
• high cognitive load caused by high number of
used colors or necessity to work with multiple
views, e.g. side-by-side view or combination of
diagram view and table view.
3 DIFFERENCE DETECTION
As the basis of modification visualization, it is neces-
sary to obtain correct and detailed information about
differences between compared model versions. Ex-
isting tools for difference detection in software mod-
els are either limited to small number of diagram
types, e.g. they only support class diagrams and
their extension could prove time-consuming (Costa
et al., 2014), they are limited to specific program-
ming languages (Xing and Stroulia, 2005) or they re-
quire construction of initial sets for the algorithm to
work (Kessentini et al., 2017). Due to insufficient
state-of-the-art difference detection methods, we pro-
pose our method for difference detection between two
versions of a software model.
We differentiate between two versions of software
models – version A, which is the reference version and
version B, which is the current version of the model.
The proposed method is based on comparing Merkle
trees (Merkle, 1988) that are created from the models.
3.1 Creation of Merkle Trees
In the first phase, hierarchies of the compared soft-
ware models are traversed and modified Merkle tree
instances are created according to Algorithm 1. Child
elements of the software models are recursively trans-
formed to sub-trees with mapped corresponding ele-
ments (see function CreateTree). After that a hash is
calculated for each sub-tree as a combination of child
sub-trees’ hashes and a local hash of the correspond-
ing element (see function ComputeHash).
Local hashes are calculated based on attributes of
UML element types, such as element type or element
name. Identifiers of the elements are not included in
Algorithm 1: Creation of Merkle tree.
merkleTreeA ← CreateTree(modelA)
merkleTreeB ← CreateTree(modelB)
function CREATETREE(element)
tree ← new Node()
tree.Element ← element
for all childElement in element.Children do
node ← CreateTree(childElement)
tree.Nodes.Add(node)
ComputeHash(node)
return tree
procedure COMPUTEHASH(node)
LocalHash ← ComputeHash(Element)
ChildrenHash ← 0
for all childNode in Nodes do
ChildrenHash ←
ChildrenHash xor childNode.Hash
node.LocalHash ← LocalHash
node.ChildrenHash ← ChildrenHash
node.Hash ← ChildrenHash xor LocalHash
the local hashes to avoid false negative matching in
case of re-indexing of software models’ elements, e.g.
caused by copying previous solutions between soft-
ware models.
3.2 Tree Traversal
After the modified Merkle tree is created, we traverse
it and detect differences in node hashes. As for the
types of differences, we use the following states:
• SAME, if the hashes are identical in both versions
of model,
• REMOVED, if the node was removed in the ver-
sion B of model,
• ADDED, if the node was was added to the version
B of model and
• INTERNAL DIFFERENCE, if we need to traverse
attributes of currently processed node.
Both instances of tree are traversed in parallel,
while the sub-trees are traversed only in case of Hash
field value mismatch. In case of such a mismatch,
the particular sub-trees are traversed and searched for
nodes with matching Hash value. If such a node is
found, this means the difference is located in parent
nodes. This parent node is then searched for based on
its LocalHash value. The differences in textual ele-
ments, such as UML note, are detected with separate
algorithm, in our case Diff Match Patch
8
.
8
https://github.com/google/diff-match-patch
MODELSWARD 2019 - 7th International Conference on Model-Driven Engineering and Software Development
266

If the matching node is not found, this fact is eval-
uated as a removal. On the other hand, if there is a
case of unmapped nodes, they are evaluated as addi-
tions. This allows the algorithm to correctly map an
element that was deleted and then recreated again or
moved within the model.
If multiple matching nodes are found, nodes with
same identifiers are mapped, otherwise, the first
matching pair is mapped and remaining nodes stay
unmapped. We can use this simple conflict solution,
due to we use results of difference detection for visu-
alization in which users can resolve real impact of the
modification.
The detected differences are put into three buck-
ets, based on the type of the difference, namely addi-
tion bucket, removals bucket and diffs bucket, where
nodes with internal differences are put.
4 VISUALIZATION OF
MODIFICATIONS
Although our proposed solution can be use for any
software model visualizations that utilize graph-based
approaches with information written in texts (e.g.,
names of classes), we decided to present our approach
on commonly used UML, while to achieve compati-
bility with commonly used UML modelling tools, we
use UML metamodel for the representation of ele-
ments, which allows us to support all of the UML di-
agrams and elements. It also allows us to use XMI as
a common data format for models.
4.1 Static and Detail Visualization
On Figure 1 we can see the detail view of the proposed
visualization method. Our method uses only four col-
ors green for addition, red for removal, orange for
change and blue for movement, i.e. single color for
every modification type, and only the specific modi-
fied parts are visualized. With this, we aim to over-
come the shortcomings of similar described tools –
visualization of whole element part, even when only
its single property was modified, e.g. visualization of
whole operation even when only a type of its parame-
ter was modified. and use of a separate color assigned
to this type of modification.
Addition and removal of an element is visualized
by highlighting the outline of the affected element,
due to the fact that the highlighting of the whole el-
ement could provide inadequate clarity. Change, ad-
dition and removal of relations is done by visualizing
directly affected part. Similar modification visualiza-
tion approach is used for other elements of diagram
(model), such as multiplicities, names of relations,
etc., that are not visualized on Figure 1.
Our proposed method supports visualization of el-
ement descriptions, which we can see on class Entitle-
mentType. This class contains a note icon highlighted
with orange color, which represents change. In a case
an element was removed only from diagram and not
from the whole model, our method uses a visual pat-
tern, such as diagonal greyed stripes.
4.2 Interactive Visualization
The proposed method also supports interactive visual-
ization of modifications. Original values of elements
and their parts can be seen after movement of mouse
cursor to the specific modification, e.g. field id of
class Feature where original type can be seen in a
form of originalValue → currentValue. This is also
supported for other element and part types, e.g. re-
lations (aggregation to composition), or element de-
scription. In a case of element description, similarly
to modifications of other elements parts, the modified
area is highlighted. Only difference is in the shade of
used color the specific modified part is highlighted
with a darker shade of color, while the paragraph is
highlighted with lighter color. The base color is the
same as for the other types of modifications.
Our method also supports visualization of move-
ment, which can be seen on Figure 2. For the bet-
ter clarity, the irrelevant parts of diagram are blurred.
For this, we use the focus+context type of visualiza-
tion technique semantic depth of field (Kosara et al.,
2001). Movement of the whole element (e.g. class) is
not supported.
4.3 Larger Models
Larger diagrams (models) require additional approach
for visualization of modifications. This is mainly
due to the fact, that in some cases, e.g. in case of
diagram visualizing architecture of the whole soft-
ware systems, the modifications can be hardly seen,
or they can get lost among a large number of ele-
ments or other modifications. We aim to solve these
problems with use of visualization technique called
heatmap (R
¨
othlisberger et al., 2009).
We chose to use this technique instead of saliency
map (Torralba et al., 2006) due to better support for
filters, which we want to use. Our method supports
two types of heatmap:
1. heatmap showing all types of modifications, while
heat is represented by color of modification type,
2. heatmap showing only one type of modifications,
which is selected by filter, while heat behaves in
Interactive Visualization of Differences between Software Model Versions
267
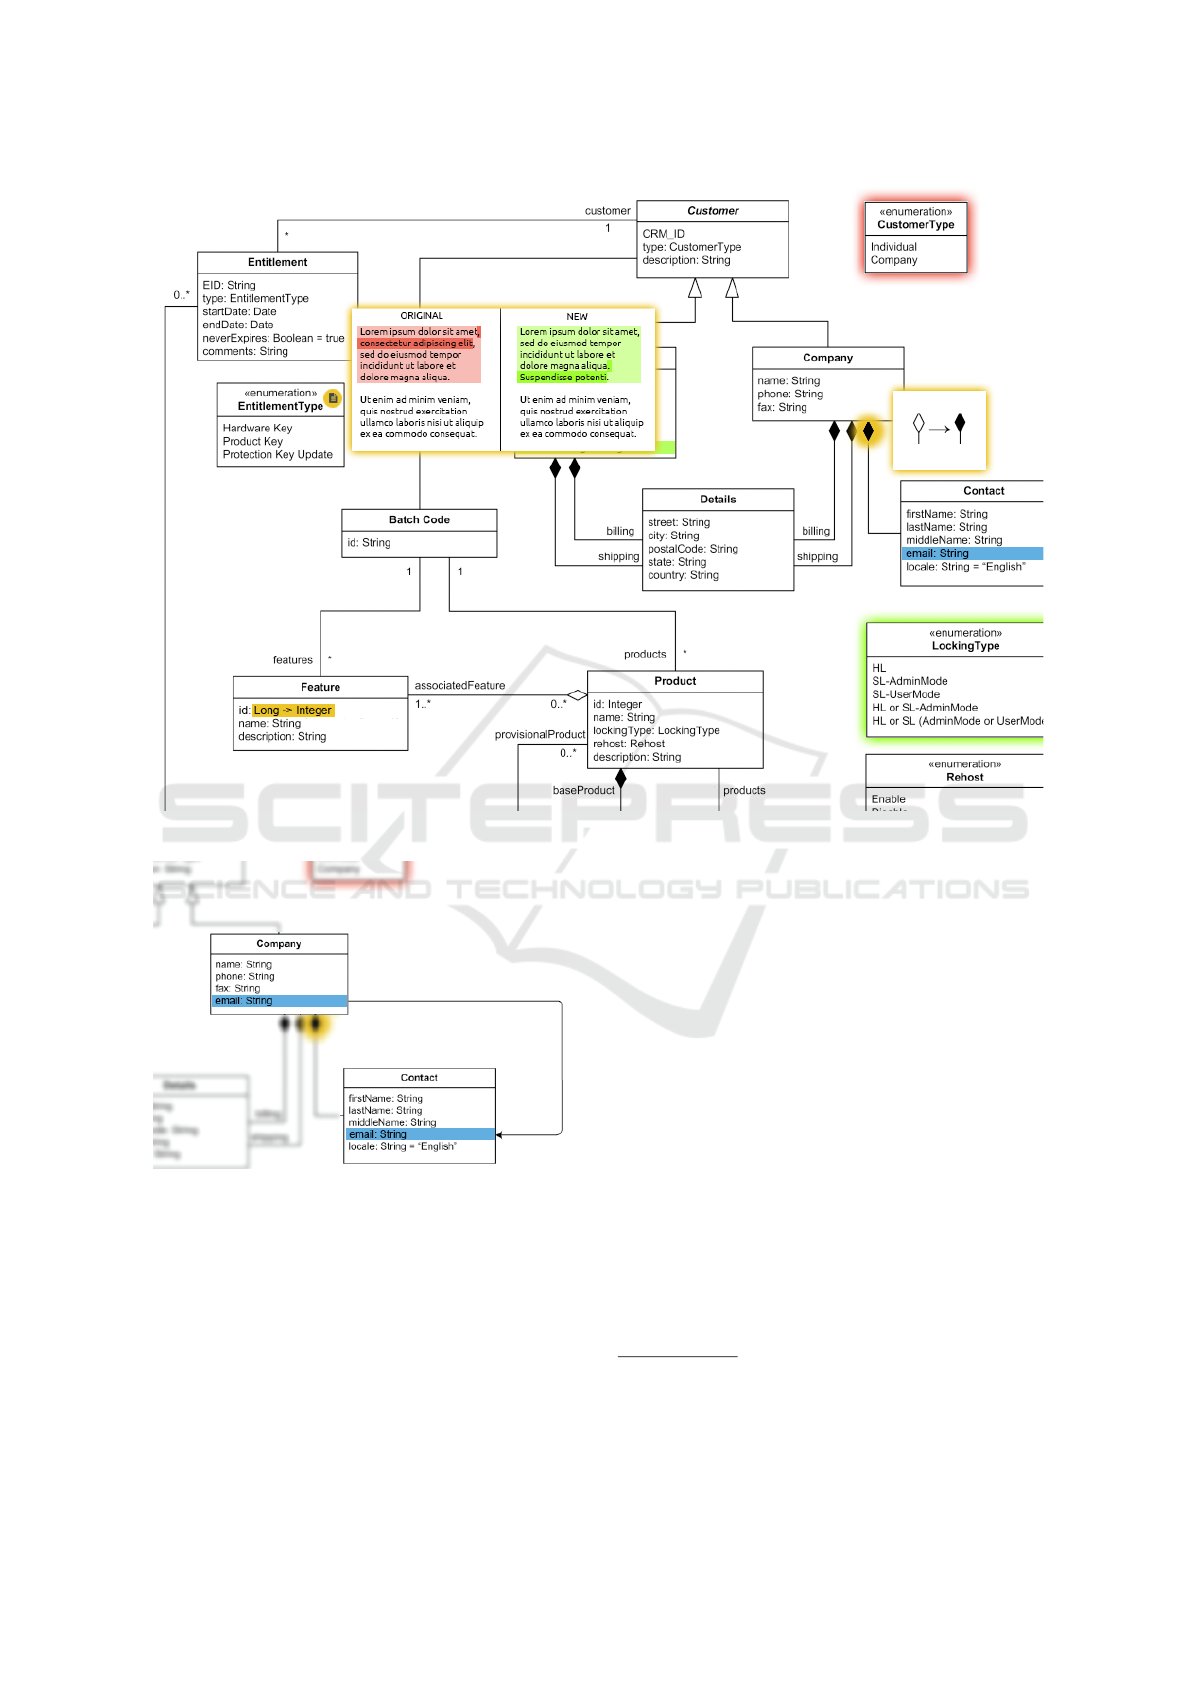
Figure 1: Detail view of the proposed visualization method.
Figure 2: Visualization of movement using semantic depth
of field.
a standard way, i.e. shows frequency of specific
type of the modification in diagram.
5 EVALUATION
To evaluate the proposed methods we firstly evaluate
difference detection method which correctness has to
be proven before the evaluation of modification vi-
sualization which uses results of difference detection
method. Both evaluations utilize common prototype,
which implements proposed algorithms and rules.
5.1 Prototype Design
Existing tools and framework aimed on software
modelling provide us only with standard and limited
features. They often do not provide the means to ex-
tend and enrich their functions. Even when they pro-
vide some kind of extension framework, they greatly
limit extensions’ access to internal representation of
software model or underlying meta-information.
One of the frameworks, that improve the means
to create various extensions, is EA Addin Frame-
work
9
suited for Sparx Systems Enterprise Archi-
tect
10
. However, this framework only encapsulates
the standard Enterprise Architect API
11
and provides
simplified access to Enterprise Architect API features.
9
https://github.com/GeertBellekens/Enterprise-
Architect-Add-in-Framework
10
http://sparxsystems.com/products/ea/
11
http://sparxsystems.com/resources/developers/autint.html
MODELSWARD 2019 - 7th International Conference on Model-Driven Engineering and Software Development
268

To deal with these shortcomings we propose an
extendible software modelling architecture evaluated
on top of Sparx Systems Enterprise Architect and we
provide a proof of concept in a form of addin featuring
difference detection between two versions of software
models. We selected Sparx Systems Enterprise Archi-
tect for familiarity of our students with the tool and
the tool’s widespread in our region companions. This
give us multiple possibilities for evaluation in differ-
ent environments.
As the basis for the our framework, we decided
to use Sparx Systems Enterprise Architect Automation
Interface
12
. This interface provides numerous means
to access and manipulate the software model. This in-
cludes means to intercept user actions, which can be
used to detect defects at the time of their creation and
to further improve skills of software designer (Ondik
et al., 2017). We decided to allow the user to manipu-
late software model via extended Enterprise Architect
interface and web interface created by us. The archi-
tecture also allows re-usability of the Addin logic in
other environments and tools by implementation of
tool specific wrappers.
5.2 Difference Detection
During the evaluation of the proposed method for dif-
ference detection in software models we mainly fo-
cused on its granularity and correctness. We observed
if the detected difference was detected on the lowest
level of element (e.g. if it did not detect difference in
name of the element as the difference of the whole el-
ement) and if the detected difference happened at all.
As the basis for the evaluation of this method we
used the most frequently used types of UML dia-
grams (Reggio et al., 2015), i.e. activity, state ma-
chine, class and sequence diagrams. As the dataset,
we used historical versions of mentioned types of di-
agrams of various sizes with additional modifications
in inner and nested elements done by us. This allowed
us to cover common types of modifications in soft-
ware models. On the mentioned dataset, we evalu-
ated the detection of additions, removals, modifica-
tions and movements of the elements along with their
nested elements according to UML metamodel, e.g.
in case of class diagrams, we evaluated the detection
of differences in their operations and attributes.
In activity, state machine and class diagrams we
did not observe any incorrectly detected difference –
the differences were detected in the exact place of
their origin. In the case of sequence diagram, we
encountered a limitation of our method in message
12
http://sparxsystems.com/resources/developers/
autint.html
movement. Sequence diagram messages in XMI form
are persisted according to their order in the diagram.
Since our method does not respect the order in the
XMI form, our method evaluated this difference as a
pair of addition and removal of said message. The
solution to this problem can be found in sequence di-
agram preprocessing, where the messages are explic-
itly given a virtual attribute order, which can be han-
dled as another attribute and therefore given a hash
value. After this preprocessing, the difference detec-
tion can work according to the presented algorithm.
5.3 Modifications Visualization
We evaluated the proposed difference visualization
method in two phases. The first phase was an user
testing and the second phase was deployment in a
company for real practice use cases. During the first
phase we provided nine participants with five dia-
grams with their original and modified version. Sizes
of the provided diagrams varied between 5 to 20 el-
ements along with textual UML note elements. Tex-
tual elements were present to compare the evaluated
indicators not only for visual structure of models,
but also for accompanying textual descriptions com-
monly found in models.
We have recorded the time it took the users to
declare that they found all the differences between
the original and modified diagram version. We also
recorded the number of undetected differences. On
the first day of testing, we provided five users with
side-by-side visualization of the two diagram versions
and four users with our visualization method. On the
second day of testing (after a week) we used same di-
agrams, but we switched visualizations for users.
During the user testing, the users did not detect
all differences in the side-by-side visualization. The
graph representing the result of undetected differ-
ences can be seen on Figure 4 along with the recorded
time for side-by-side visualization on Figure 3(a). In
case of our visualization method, users detected all
differences. The recorded time per each diagram can
be seen on Figure 3(b). According to the provided re-
sults we can conclude that our method had significant
impact on difference detection time.
For the reasons of the second evaluation phase
we deployed the implemented prototype in interna-
tional company which implements safety critical sys-
tems for automotive industry. The company uses
model driven development process, in which pro-
grammers implement requirements designed mainly
in form of activity, state machine and sequence dia-
grams. The prototype was employed in testing phase,
during which testers review modifications in a soft-
Interactive Visualization of Differences between Software Model Versions
269
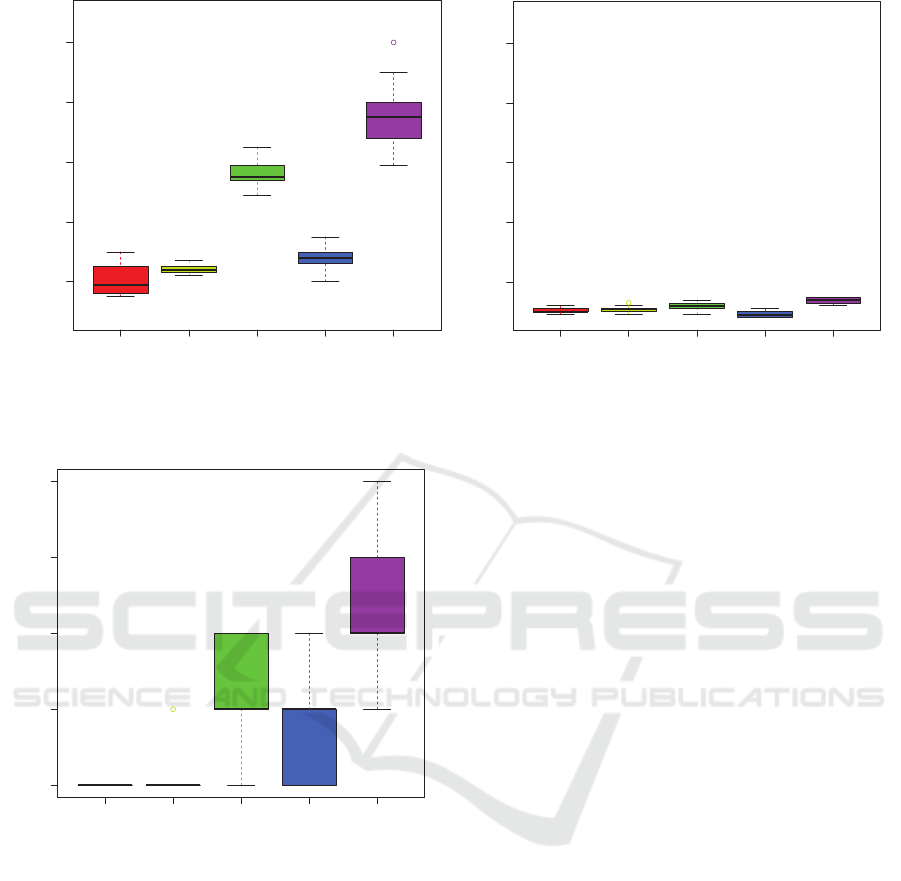
D1 D2 D3 D4 D5
20 40 60 80 100
Diagram
Time [s]
(a) Side-by-side method.
D1 D2 D3 D4 D5
20 40 60 80 100
Diagram
Time [s]
(b) The proposed method.
Figure 3: Time taken to declare all differences.
D1 D2 D3 D4 D5
01234
Diagram
Number of undetected differences
Figure 4: Number of undetected differences using side-by-
side method.
ware model and in a source code, and they implement
necessary changes in software tests.
Before deployment of the prototype, the testers
did not used any other tool for visualization of modifi-
cations. Main reasons were problems with their accu-
racy, when identifiers of elements were changed and
inappropriate visualization of modification in behav-
ioral diagrams, where ordering of elements and their
connections radically affect designed algorithms.
Seven testers were selected for the evaluation of
the prototype and feasibility study in the company.
These testers spends in average 7 hours per week by
analysis of the modifications by side-by-side visual-
ization. All seven testers were asked to use the proto-
type in parallel with their current work process to val-
idate correctness of detected modifications during 4
weeks. During this deployment phase no issue linked
with difference detection algorithm was reported. Af-
ter two weeks, three testers started to used the proto-
type as main software model visualization tool. These
three testers reported 68% reduction of the time spent
by analysis of software model modifications.
The testers were also asked to quantify main fea-
tures of the prototype. The testers consistently evalu-
ate context-base visualization features as very useful
and they used them regularly. They also find standard
tabular visualization of modifications per model ele-
ment useful, while they use it rarely to keep displayed
difference visualization for longer time (e.g., during
writing tests). These testers suggest to give possibility
to switch on and off visualization of all modifications
in a diagram visualization. This feature will be usable
to see context of all modifications in one view instead
of hovering highlighted modifications.
6 CONCLUSIONS AND FUTURE
WORK
In this paper we presented the method for visualiza-
tion of modifications in software models. We de-
scribed existing tools providing such a visualization
and we identified their shortcomings. In the further
parts of this paper, we presented our proposed method
for visualization of modifications in software models,
which solves the shortcomings of described existing
tools. We described context-based views of modifica-
MODELSWARD 2019 - 7th International Conference on Model-Driven Engineering and Software Development
270

tions and discussed the impact of large software mod-
els on our method.
As a proof of concept we created an addin, which
uses the proposed extendible software modelling ar-
chitecture. This addin provides means to detect dif-
ferences between two versions of a UML model and it
also provides users with simple difference visualiza-
tion. The addin uses modified Merkle trees to detect
differences between two versions of the model, which
allows us to compare the models more effectively as
it can compare the model sub-trees as a whole.
For the future work, this framework can be ex-
tended by providing means to warn the user of his
mistakes, which can help the learning process of new
software designers (Ondik et al., 2017). We are cur-
rently working on web-based addin for review stu-
dents projects software modelling courses.
Other utilization of the proposed software model
modifications visualization can be in an expansion of
the number of supported UML diagrams and trans-
position of the implementation into virtual or aug-
mented reality, which can increase performance of
software models presentation during review meetings,
or after integration with commonly used IDEs it can
simplify the process of difference propagation from
model to source code by parallel visualization of soft-
ware model differences above affected source code.
ACKNOWLEDGEMENTS
This work was partially supported by the Slovak Re-
search and Development Agency under the contract
No. APVV-15-0508, and by the Scientific Grant
Agency of the Slovak Republic, grant No. VG
1/0759/19.
REFERENCES
Burmester, S., Giese, H., Niere, J., Tichy, M., Wadsack,
J. P., Wagner, R., Wendehals, L., and Zndorf, A.
(2004). Tool integration at the meta-model level: the
Fujaba approach. Int. Journal on SW Tools for Tech-
nology Transfer, 6(3):203–218.
Costa, V. O., Monteiro, R., and Murta, L. G. P. (2014).
Detecting Semantic Equivalence in UML Class Dia-
grams. In The 26th Int. Conf. on SW Eng. and Knowl-
edge Eng. (SEKE), pages 318–323.
Elaasar, M., Noyrit, F., Badreddin, O., and Grard, S. (2018).
Reducing uml modeling tool complexity with archi-
tectural contexts and viewpoints. In Proc. of the 6th
Int. Conf. on Model-Driven Eng. and SW Develop-
ment, pages 129–138. INSTICC, SciTePress.
Ferenc, M., Polasek, I., and Vincur, J. (2017). Collaborative
modeling and visualization of software systems using
multidimensional uml. In 2017 IEEE Working Conf.
on SW Visualization, pages 99–103.
Girschick, M. and Darmstadt, T. (2006). Difference detec-
tion and visualization in UML class diagrams. Tech-
nical University of Darmstadt Technical Report TUD-
CS-2006-5, pages 1–15.
Kelter, U., Monecke, M., and Platz, D. (1999). Constructing
distributed sdes using an active repository. In Proc.
1st Intl. Symposium on Constructing SW Eng. Tools,
pages 17–18.
Kessentini, M., Mansoor, U., Wimmer, M., Ouni, A., and
Deb, K. (2017). Search-based detection of model level
changes. Empirical SW Eng., 22(2):670–715.
Kosara, R., Miksch, S., and Hauser, H. (2001). Semantic
depth of field. In Proc. of the IEEE Symposium on In-
formation Visualization 2001, INFOVIS ’01, page 97,
Washington, DC, USA. IEEE Computer Society.
Merkle, R. C. (1988). A digital signature based on a conven-
tional encryption function. In Pomerance, C., editor,
Advances in Cryptology — CRYPTO ’87, pages 369–
378, Berlin, Heidelberg. Springer Berlin Heidelberg.
Niere, J. (2004). Visualizing differences of UML diagrams
with Fujaba. In Proc. of the 2nd Int. Fujaba Days.
Ohst, D., Welle, M., and Kelter, U. (2003). Differences
between versions of UML diagrams. ACM SIGSOFT
SW Eng. Notes, 28(5):227.
Ondik, J., Olej
´
ar, M., R
´
asto
ˇ
cn
´
y, K., and Bielikov
´
a, M.
(2017). Activity-Based Model Synchronization and
Defects Detection for Small Teams. In 2017 IEEE Int.
Conf. on SW Quality, Reliability and Security Com-
panion, pages 8–15. IEEE.
Reggio, G., Leotta, M., Ricca, F., and Clerissi, D. (2015).
What are the used uml diagram constructs? a docu-
ment and tool analysis study covering activity and use
case diagrams. In Hammoudi, S., Pires, L. F., Filipe,
J., and das Neves, R. C., editors, Model-Driven Eng.
and SW Development, pages 66–83, Cham. Springer
International Publishing.
R
¨
othlisberger, D., Nierstrasz, O., Ducasse, S., Pollet, D.,
and Robbes, R. (2009). Supporting task-oriented nav-
igation in IDEs with configurable HeatMaps. In 2009
IEEE 17th Int. Conference on Program Comprehen-
sion, pages 253–257.
Torralba, A., Oliva, A., Castelhano, M. S., and Hender-
son, J. M. (2006). Contextual guidance of eye move-
ments and attention in real-world scenes: the role of
global features in object search. Psychological Re-
view, 113(4):766–786.
Xing, Z. and Stroulia, E. (2005). Umldiff: An algorithm
for object-oriented design differencing. In Proc. of
the 20th IEEE/ACM Int. Conf. on Automated SW Eng.,
ASE ’05, pages 54–65, New York, NY, USA. ACM.
Interactive Visualization of Differences between Software Model Versions
271
