
Can Machine Learning Predict Soccer Match Results?
Giovanni Capobianco
1
, Umberto Di Giacomo
1
, Francesco Mercaldo
2,1
, Vittoria Nardone
3
and Antonella Santone
1
1
Department of Bioscience and Territory, University of Molise, Pesche (IS), Italy
2
Institute for Informatics and Telematics, National Research Council of Italy (CNR), Pisa, Italy
3
Department of Engineering, University of Sannio, Benevento, Italy
antonella.santone@unimol.it
Keywords:
Result Prediction, Game Analysis, Sport Analytics, Soccer Match Prediction, Machine Learning.
Abstract:
Sport result prediction proposes an interesting challenge considering as popular and widespread are sport
games, for instance tennis and soccer. The outcome prediction is a difficult task because there are a lot of
factors that can afflict the final results and most of them are related to the player human behaviour. In this
paper we propose a new feature set (related to the match and to players) aimed to model a soccer match.
The set is related to characteristics obtainable not only at the end of the match, but also when the match is
in progress. We consider machine learning techniques to predict the results of the match and the number
of goals, evaluating a dataset of real-world data obtained from the Italian Serie A league in the 2017-2018
season. Using the RandomForest algorithm we obtain a precision of 0.857 and a recall of 0.750 in won match
prediction, while for the goal prediction we obtain a precision of 0.879 in the number of goal prediction less
than two, and a precision of 0.8 in the number of goal prediction equal or greater to two.
1 INTRODUCTION
The Oxford dictionary defines tactic as “an action or
strategy carefully planned to achieve a specific end”.
In case of sport matches the specific end is to win the
match. The definition of a tactic, from the coach point
of view for instance, is depending on several factors
(most of these are human behaviour-related), for in-
stance: the players, in terms of physical conditions
and/or harmony with teammates; the opposing team,
in terms of technical and resistance skills; the tactic
adopted by the coach of the opposed team; the sta-
dium where the game is played.
For these reasons, the winning of a match is not
related just to one factor (Lucey et al., 2014), but
there are several aspects that contribute to this end.
Considering how widespread are sports, there is an
increasing interest in developing methodologies and
techniques aimed to predict a match result examining
a set of indicators (Dijksterhuis et al., 2009) (gener-
ally based on statistics related to previous matches).
Typically, the main weakness of the current state-
of-the-art research is two-fold. The first one relates
to methodologies while the second one relates to the
evaluation of the proposed methods.
With regard to the methodology weakness, litera-
ture presents methods analyzing feature set available
only at the end of matches, for instance the number of
goal or the number of red cards received by the play-
ers. This is the reason why it is not possible to predict
the result of a match in progress, and this represents
a limitation because in this way the coach is not able
to change the tactic for instance, between the first and
the second time.
The second weakness is related to the evaluation
of the proposed method. Probably for the novelty
of the topic, the researchers do not have available a
dataset of real-data to analyse the proposed solution
and to compare its effectiveness with the other meth-
ods. This is an important issue, because currently it is
not possible to compare the performances of the var-
ious methodologies proposed. This problem is dis-
cussed by Rein and colleagues (Rein and Memmert,
2016): they stated that one of the main problems in
sport analytics is the lack of available and relevant
data and this is becoming an obstacle in itself for the
modelling of tactical decision making in team sports.
From the other side, big data researchers affirm
that, with the development of advanced tracking tech-
nologies, this situation will change in a while. Indeed,
458
Capobianco, G., Di Giacomo, U., Mercaldo, F., Nardone, V. and Santone, A.
Can Machine Learning Predict Soccer Match Results?.
DOI: 10.5220/0007307504580465
In Proceedings of the 11th International Conference on Agents and Artificial Intelligence (ICAART 2019), pages 458-465
ISBN: 978-989-758-350-6
Copyright
c
2019 by SCITEPRESS – Science and Technology Publications, Lda. All rights reserved

they sustain that the amount of available data related
to sport analytics is becoming increasingly difficult to
manage (Lohr, 2012; Silva et al., 2016): we will as-
sist to the opposite situation, researchers will have a
lot of data available and the difficult task will be the
extraction of knowledge from heterogeneous sources.
Starting from these considerations, in this prelim-
inary paper we propose a method trying to solve the
first weakness. In particular, we propose to analyze
real-time the game to predict match results in the con-
text of the soccer game and it is also able to deter-
mine whether the match under analysis will be win
with more or less than two goals (in order to provide
a more fine-grained prediction).
In a nutshell, exploiting super-visioned machine
learning algorithms, we build two models: the first
one to abstract the win or loss of a match, while the
second one able to model the number of goals scored
by the winning team. We consider a feature set related
to characteristics obtainable not only at the end of the
match, but also when the match is in progress.
In the evaluation, using real-world data gathered
from the Italian Serie A League from 378 different
matches related to the 2017-2018 season, we obtain a
precision and a recall greater than 0.8 outperforming
the performance of state-of-the-art methods proposed
in current literature.
The paper poses two research questions:
• RQ1: is it possible to predict soccer match results
exploiting machine learning techniques?
• RQ2: is it possible to predict the goal number
of the winning soccer team exploiting machine
learning techniques?
The paper proceeds as follows: Section 2 discusses
the current literature related to soccer result predic-
tion, Section 3 deeply describes and motivates the
proposed method; Section 4 illustrates the results of
the experiments and finally, conclusions are drawn in
Section 5.
2 RELATED WORK
Recently, machine learning techniques have been in-
troduced in sport analytics with the aim to predict
match results or to obtain an improvement of the team
performance. With regard to soccer analytics, a gen-
eral issue is that most of the work has been done using
datasets with a very limited number of predictors, due
to the lack of public data about soccer games. For
this reason, there are few studies in soccer analytics
in which the data are analyzed using machine learn-
ing techniques. Among the related works in the lit-
erature, authors in (Joseph et al., 2006) present an
approach to forecast results in which the Bayesian
Networks provide a means for representing and pre-
dicting the results of expert knowledge in a football
game. The results showed that the Bayesian networks
is generally superior to other techniques such as the
MC4, a decision tree learner, naive Bayesian learner
(NB), and k-nearest neighbor learner (KNN) for this
domain in terms of predictive accuracy. Specifically,
authors obtain accuracy of 59% which outperformed
other machine learning algorithms by 41.7% (MC4),
47.86% (NB) and 50.58% (KNN). In (Kumar, 2013),
the author has evaluated a set of machine learning al-
gorithms in order to classify the 3 label result vari-
ables i.e., win, draw and loss: authors observed the
best performance with the multilayer perceptron algo-
rithm with an accuracy equal to 69.474 % and a ROC
area equal to 0.836. In (Liti et al., 2017) it has been
considered the problem of predicting the outcome of
a soccer match finished with a draw at the end of the
first half using mainly the information stored during
the first part of the match. The dataset considered in
this study contains the results of 166 matches and, af-
ter removing the attributes containing few values dif-
ferent from zero, the final set of feature is composed
of 27 attributes. Firstly, the authors have used a fea-
ture selection method and, then a classification task
on a three label result variables - home win, away win
or draw. The RBF network is the algorithm that per-
forms better, with an accuracy equal to 45%.
In (Sathe and Satao, 2017) the authors have used mul-
tiple classification algorithms such as support vector
machine, random forest and Naive Bayes. The best
performing algorithm in that study is SVM, having
an accuracy equal to 0.599 followed by Naive Bayes
with an accuracy equal to of 0.55. Random forest is
the algorithm with worst performance, with an accu-
racy equal to 0.50. Many studies have been performed
on Premier League matches. In (Razali et al., 2017), it
has been used a Bayesian networks approach. This re-
search uses predictors as home and away team shots,
home and away team shots on target, home and away
corners, half time home and away team goals, and so
on, to predict the match outcome of a team. In partic-
ular, the study considered the English Premier League
for the seasons of 2010-2011, 2011-2012 and 2012-
2013. It has been used a 10-folds cross-validation to
perform the classification, and the results have an ac-
curacy, in average,equal to 74%. In that research, the
authors use predictors that give direct information on
the outcome of a specific match, so variables that are
strongly correlated to the predicted variable, as goals
scored in the first and second half. (Baboota and Kaur,
2018) demonstrates the building of a generalized pre-
Can Machine Learning Predict Soccer Match Results?
459

dictive model for predicting the results of the English
Premier League. Firstly, the authors have used fea-
ture engineering and exploratory data analysis to cre-
ate a feature set for determining the most important
factors for predicting the results of a football match.
Then, a highly accurate predictive system using ma-
chine learning has been created. The best model of
that study uses gradient boosting, achieving a per-
formance of 0.2156 on the ranked probability scores
(RPS) metric for game weeks 6 to 38 for the English
Premier League. A different feature set is considered
in (Gomes et al., 2015): they obtain a lower average
accuracy if compared to the method we propose (even
if they consider also the draw matches).
Differently from the discussed methods, we con-
sider types of data never explored in literature and that
are not strongly correlated with the predicted variable,
for instance, attributes related to the spatial disposi-
tion of the team in the field, as the team’s center of
gravity or the area of the convex hull created by the
disposition of the players, both in attacking and de-
fensive stage. Another novelty of our work is the
two-label classification (win or no-win) considered,
since our goal is to identify the main team aspect
of the match, which we can modify in order to im-
prove the performance to win a match. This means
that our work could be useful to create, in future, a
notational analysis system that a coach could use to
change the strategy or the organization of the team
during a match, i.e., at halftime.
3 THE METHOD
In this section we present the proposed method de-
picted in Figure 1. It is divided in two main phases:
the Model Building (i.e., Phase I in Figure 1) and the
2-step Result Prediction (i.e., Phase in Figure 1).
The Model Building phase is related to the training
aimed to build the two models to predict the match
result and the goal number and it is composed by
following modules: match reports: this module is
able to data acquisition in raw format from completed
matches using a plethora of information sources, for
instance, digital newspapers, sport websites and RSS
feed;
feature cleaning and preprocessing: the aim of this
module is to filter the raw data obtained in the pre-
vious step in order to extract the feature set for each
match that will be considered in the two models. Ba-
sically, from the raw data for the matches, the output
of this module is a well-formatted CVS file in which,
for each examined match, the considered features ap-
pear;
match model building: this module considers the fea-
ture set obtained in the previous step to build a model
using the win or lose label associated to each feature
vector (i.e., a match);
goal model building: this module considers the fea-
ture set obtained in the previous step to build a model
using the < 2 or >= 2 label associated to each fea-
ture vector (i.e., a match). The < 2 label is related
to a match won with a number of goals less than 2,
while the >= 2 label is associated to a match won
with a number of goals equal or greater than 2.
Once obtained the two models related to the main
result of the match and to the goal number, the 2-step
Result Prediction phase has the responsibility to eval-
uate the results (in terms of win/lose and number of
goals) of new matches. As a matter of fact, the fea-
tures vector evaluated in the proposed method can be
also used to evaluate match in progress, for instance
the coach, between the first and second half, could be
able to real-time predict the outcome of the match,
and then think about changing the game strategy in
order to win the game.
The 2-step Result Prediction phase is composed
by following modules:
match under analysis: the aim of this module is
the same of the first module in the Model Building
phase: in the real-world the developed method can be
also used from coaches inserting by hand the reports
related to previous match or the partial result of a
match;
feature cleaning and preprocessing: this module is
responsible to obtain the feature set from the raw
information obtained in the previous step, in addition
it is also able to parse the information inserted by the
coach using an interface provided by the system in
order to convert the information into a feature vector
to input the two models built in the Model Building
phase;
match predictor: this module represents the match
evaluator. It takes as input the feature vector and
tests it against the model built in the match model
building module of the Model Building phase (this
is the reason why the inputs of the match predictor
module are the match model building module and the
feature vector). The output of this module is a label:
win whether the prediction, considering the analysed
feature vector, is a win of the match under analysis or
lose, whether the prediction is a lose of the match;
goal predictor: this module represents the goal eval-
uator. The inputs of this module are the goal model
building module and the feature vector. Whether the
match predictor module predicts a win of the match
under analysis, the goal predictor module analyses
the feature vector in order to predict whether the
ICAART 2019 - 11th International Conference on Agents and Artificial Intelligence
460
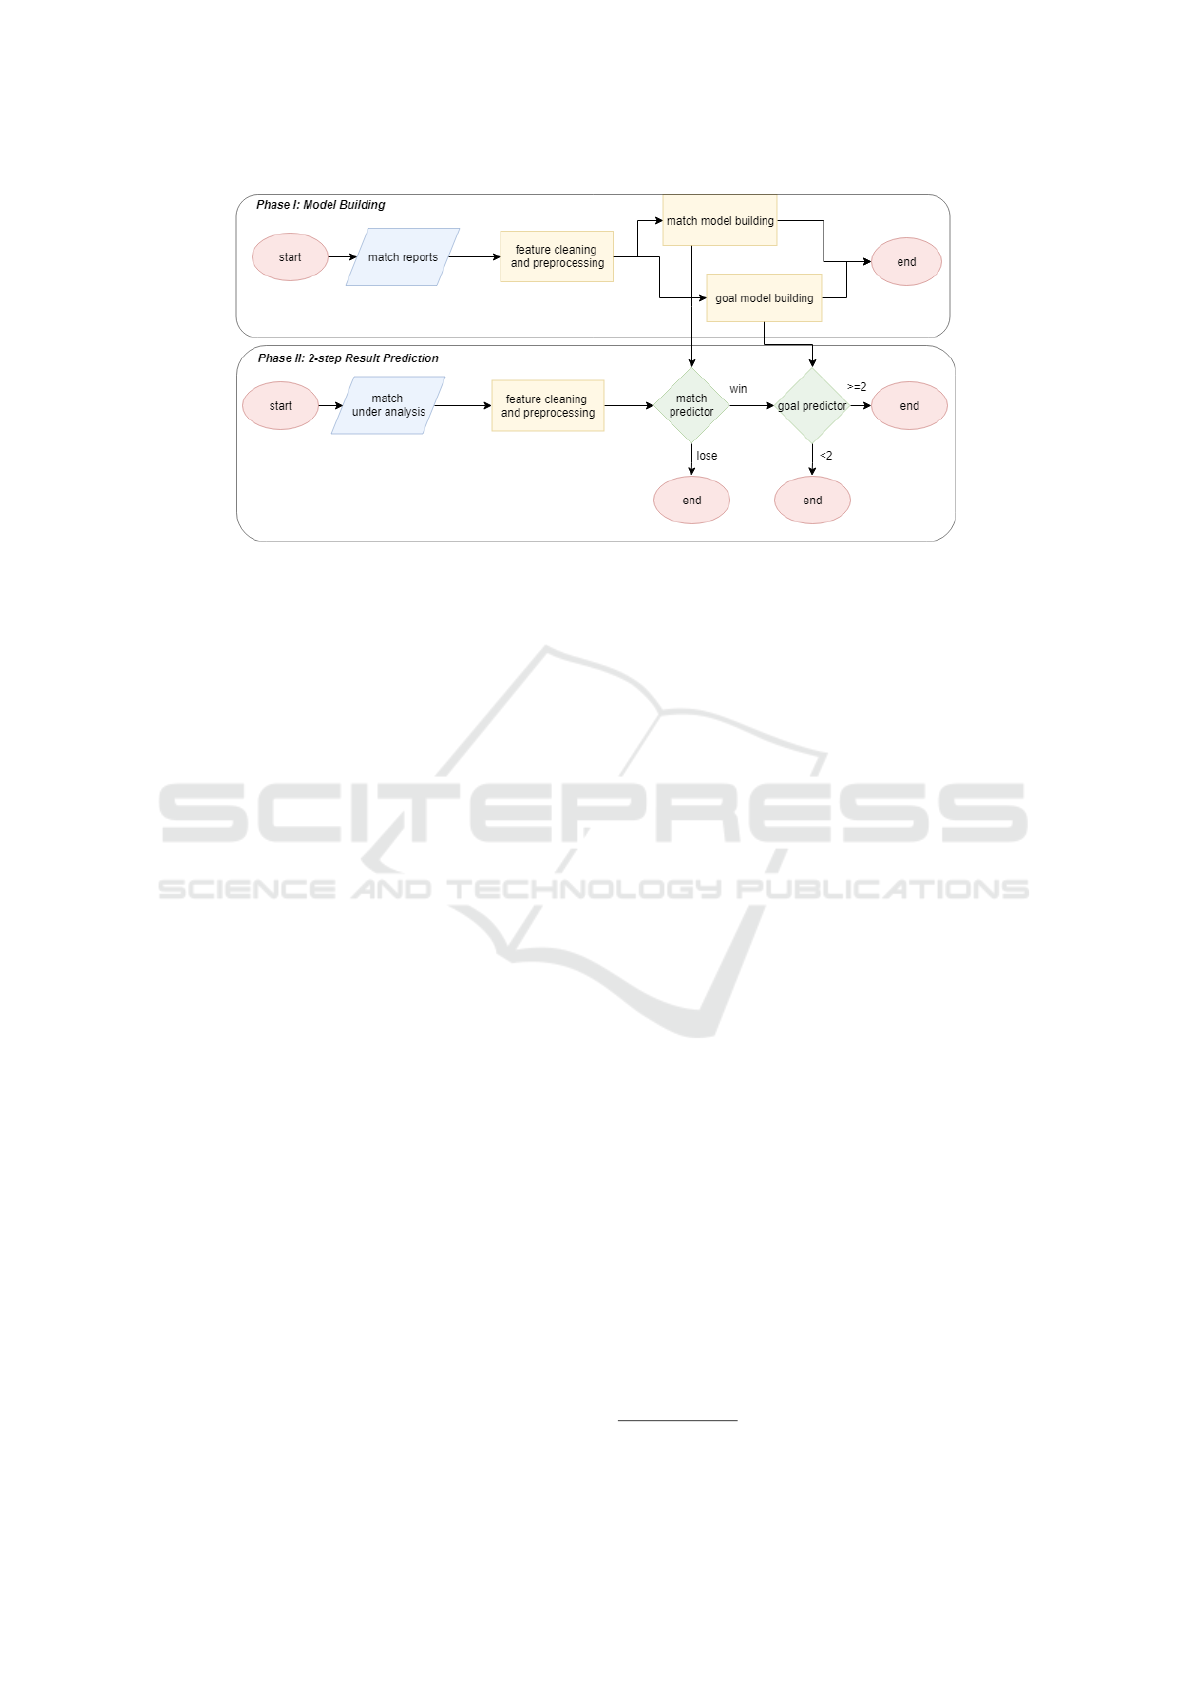
Figure 1: Flowchart of the proposed method.
analysed match will be win with a number of goals
less then two (in this case the feature vector will be
marked with the < 2 label) or with a number of goals
equal of greater than two (in this case the feature
vector will be marked with the >= 2 label).
Once depicted the high-level architecture of the
proposed method, we discuss in details the feature
vector we considered to build the two models. Table
1 shows the considered features. We consider from
the initial dataset only 20 features i.e., the best fea-
ture set obtained using the Best-first search principal
component analysis.
We designed an experiment in order to evaluate
the effectiveness of the feature vector that we propose
to detect the match results and the number of goal.
The evaluation consists of classification analysis
aimed at assessing whether the features are able to
correctly classify between won and lose matches.
In order to perform the classification task, we se-
lected six different classification algorithms (to im-
prove the conclusion validity): J48, SMO, RepTree,
RandomForest and MLP. For details about the algo-
rithmms the reader can refer to (Wu et al., 2008).
4 EXPERIMENTAL EVALUATION
In this section we present the results of the experiment
we performed to validate the effectiveness of the pro-
posed method.
Reflecting the organization of the previous sec-
tion, below we present the descriptive statistics in
order to provide statistical evidence that the consid-
ered feature set are discriminating between lose and
win matches; and the classification analysis aimed to
build model able to predict real-world match results
in terms of won and lose matches and number of goal
of the winning team.
4.1 The Dataset
The dataset has been constructed from the pdf files
match report provided by the Serie A league, for each
match of the season 2017-2018
1
. The dataset contains
98 attributes and 378 instances. Each instance repre-
sents a specific match in the league.
We have different types of attributes, for each
team of the match, as:
• attributes that give us information about posses-
sion, in each half time;
• attributes that give us information about the spa-
tial disposition of the player in the field - area,
measured in mt
2
, or the center of gravity of the
team in attacking and defensive stage;
• attributes that gives us information about the goals
scored and conceded;
• other types of information about the teams partic-
ipating to the specific match.
The data were obtained using a Java script devel-
oped by the authors able to retrieve the required infor-
mation and to create the dataset.
4.2 Classification Analysis
We considered five metrics in order to evaluate the
results of the classification: FP rate, Precision, Recall,
F-Measure and ROC Area.
The precision has been computed as the propor-
tion of the examples that truly belong to class X
among all those which were assigned to the class. It
1
http://www.legaseriea.it/it
Can Machine Learning Predict Soccer Match Results?
461

Table 1: Features involved in the study.
Feature Description Info
F1 jog distances km home path covered by the home team
at low intensity exp. in Km.
F2 sprint distance km away path covered by the away team
at a high intensity exp. in Km.
F3 average speed km home home team average speed exp. in Km/h.
F4 y center gravity medium 1T home y coordinate of the gravity center of the home team,
in the first half.
F5 y center gravity medium 1T away y coordinate of the gravity center of the away team,
in the first half.
F6 y center gravity own 1T away y coordinate of the gravity center of the away team
team during the attacking phase, in the first half.
F7 y center gravity own 2T away y coordinate of the gravity center of the away team
team during the defensive phase, in the second half.
F8 possession half away field percenptage home percentage of soccer ball possession in
the opposite half of the home team.
F9 possession percenptage home percentage of possession of the
home team, during the full match.
F10 possession half home field seconds home time of soccer ball possession, in seconds,
in their own half of the home team.
F11 possession 0 15 1T home time of home team possession, in seconds,
from 0 minute to 15 minutes, in the first half.
F12 possession 16 30 1T home time of home team possession, in seconds,
from 16 minutes to 30 minutes, in the first half.
F13 possession 31 45 1T home time of home team possession, in seconds,
from 31 minutes to 45 minutes, in the first half.
F14 possession 0 15 1T away time of away team possession, in seconds,
from 0 minute to 15 minutes, in the first half.
F15 possession 16 30 1T away time of away team possession, in seconds,
from 16 minutes to 30 minutes, in the first half.
F16 possession 31 45 1T away time of away team possession, in seconds,
from 31 minutes to 45 minutes, in the first half.
F17 possession 0 15 2T away time of away team possession, in seconds,
from 0 minute to 15 minutes, in the second half.
F18 balls recovered midfield right away number of recovered on the right
of the midfield area from the away team.
F19 attacks from center away number of away team attacks from
the center of the field.
F20 possession midfield opposing percentage away midfield possession in percentage
of away team
is the ratio of the number of relevant records retrieved
to the total number of irrelevant and relevant records
retrieved:
Precision =
t p
t p+ f p
where tp indicates the number of true positives
and fp indicates the number of false positives.
The recall has been computed as the proportion
of examples that were assigned to class X, among all
the examples that truly belong to the class, i.e., how
much part of the class was captured. It is the ratio of
the number of relevant records retrieved to the total
number of relevant records:
Recall =
t p
t p+ f n
where tp indicates the number of true positives
and fn indicates the number of false negatives.
The F-Measure is a measure of a test’s accuracy.
This score can be interpreted as a weighted average
of the precision and recall:
F-Measure = 2 ∗
Precision∗Recall
Precision+Recall
The Roc Area is defined as the probability that a
positive instance randomly chosen is classified above
a negative randomly chosen.
The classification analysis consisted of building
classifiers in order to evaluate the feature vector ac-
curacy to distinguish between win and lose matches.
For training the first classifier (the one related to
the match model building module in Figure 1), we de-
fined T as a set of labeled messages (M, l), where each
M is associated to a label l ∈ {win, lose}. For each M
we built a feature vector F ∈ R
y
, where y is the number
of the features used in training phase (y = 20). The la-
bel win is associated to a won match, while the label
ICAART 2019 - 11th International Conference on Agents and Artificial Intelligence
462
lose is related to a lose match.
To train the second classifier i.e., the goal model
building in Figure 1 we consider the a similar proce-
dure like the one followed for the match model build-
ing module. In this case we defined T as a set of la-
beled messages (M, l), where each M is associated to
a label l ∈ {< 2, >= 2} using the same feature vector
considered in the previous model. The label < 2 is
associated to a won match with a number of goal less
to 2, while the label >= 2 is related to a match won
with a number of goal equal or greater than 2.
For the learning phase, we use a k-fold cross-
validation (Arlot et al., 2010): the dataset is randomly
partitioned into k subsets. A single subset is retained
as the validation dataset in order to evaluate the ob-
tained model, while the remaining k − 1 subsets of
the original dataset are considered as training data.
We repeated the process for k = 20 times; each one
of the k subsets has been used once as the validation
dataset (Nasrabadi, 2007; Shaikh et al., 2016). To ob-
tain a single estimate, we computed the average of the
k results from the folds.
The procedure is repeated two times: for the the
match model building and the goal model building
modules.
We evaluated the effectiveness of the classification
method with the following procedure:
1. build a training set T⊂D;
2. build a testing set T
0
= D÷T;
3. run the training phase on T;
4. apply the learned classifier to each element of T
0
.
In the flowchart depicted in Figure 1 the evalua-
tion of the match model building is represented by the
match predictor module, while the evaluation of the
goal model building is represented by the goal pre-
dictor module.
Each classification was performed using 95% of
the dataset as training dataset and 5% as testing
dataset employing the full feature set.
As shown in Table 2, we obtain an average pre-
cision ranging from 0.735 (with the J48 algorithm)
to 0.843 with the RandomForest algorithm. With re-
gard to the recall, this metric in average is ranging
from 0.684 (with the RepTree algorithm) to 0.842
(obtained with the SMO and the RandomForest algo-
rithm.).
RQ1 response: the obtained results show that ma-
chine learning techniques can be able to predict soc-
cer match results. The best performances in terms of
precision and recall were obtained by the Random-
Forest algorithm, with a precision equal to 0.857 and
a recall equal to 0.750 to predict a won match.
As previously discussed, for each classification
we considered 95% of the dataset as training dataset
and 5% as testing dataset employing the full feature
set.
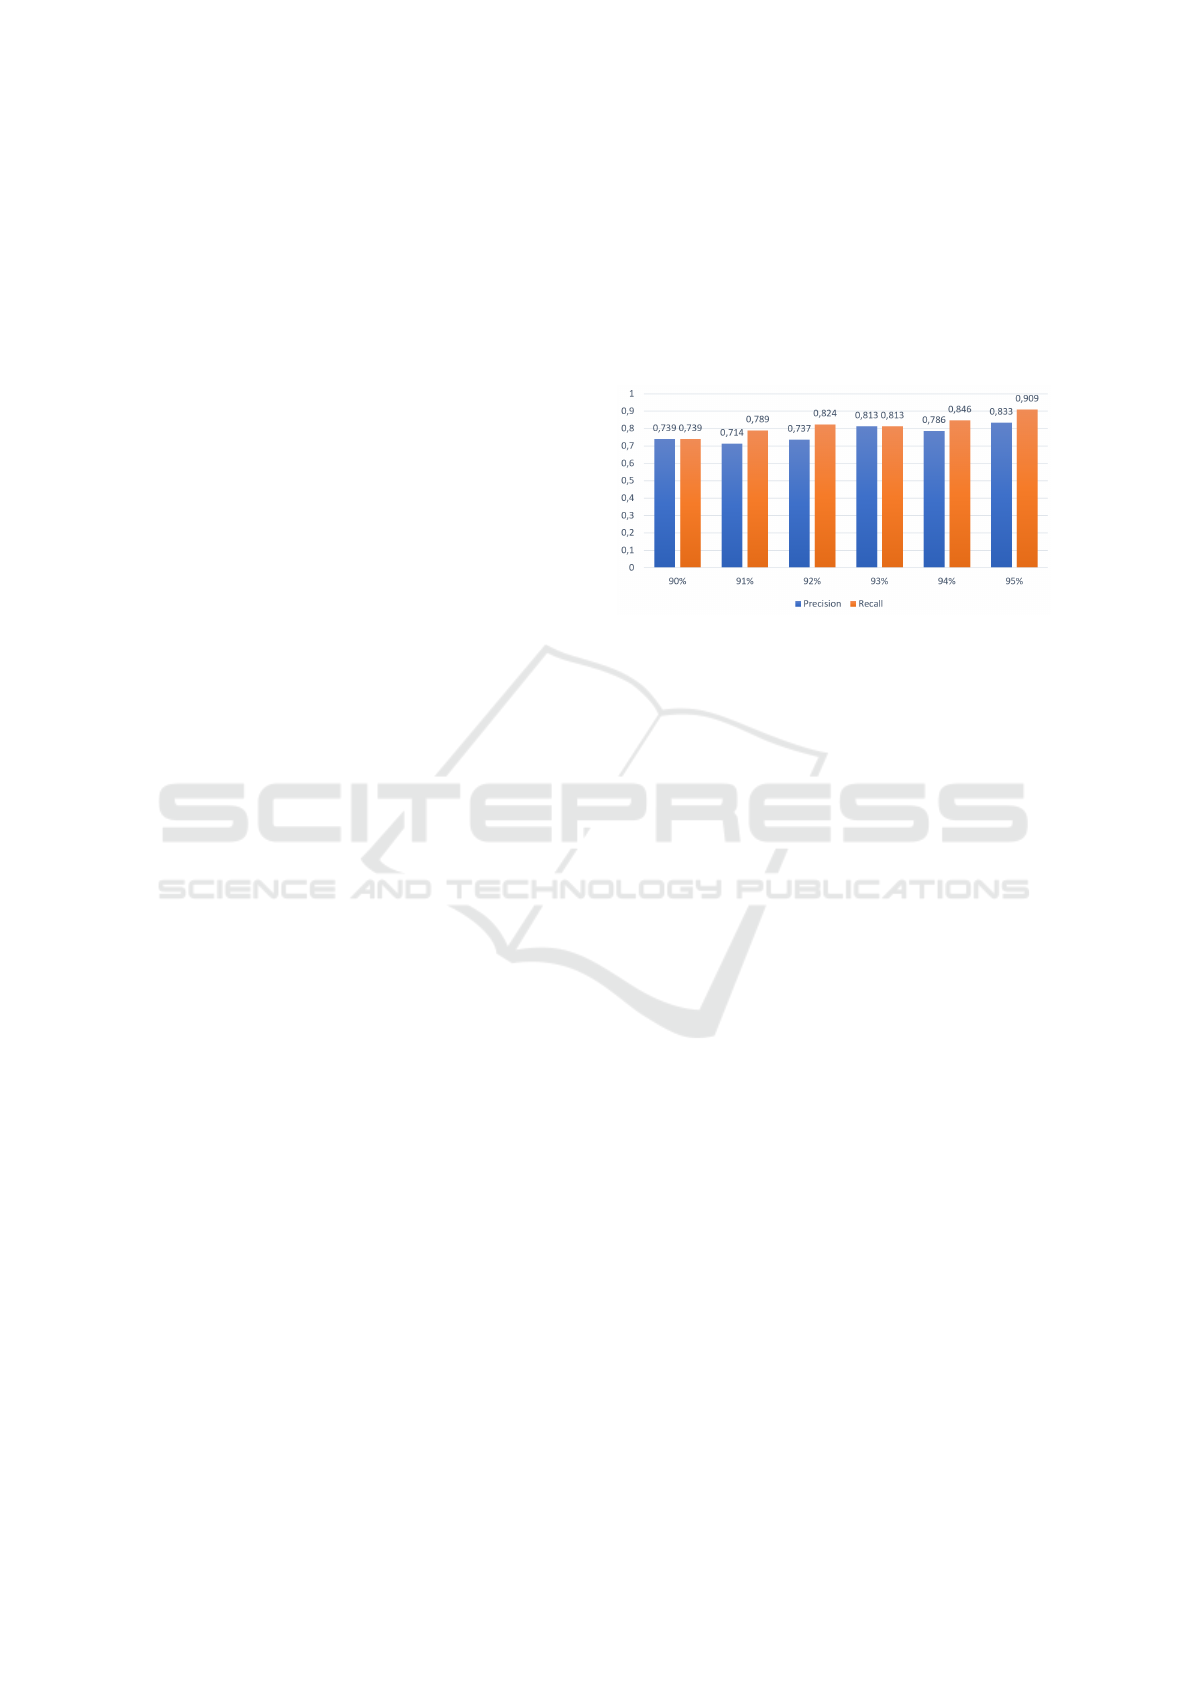
In order to show the performances when the train-
ing set is increasing, Figure 2 depicts the precision
and recall trend with training set percentages ranging
from 90% to 95%.
Figure 2: Bar charts related to precision and recall with dif-
ferent training set percentages (from 90% to 95%) using the
RandomForest algorithm.
When the model is built with the 90% of the train-
ing set, both the precision and the recall are equal
to 0.739. The best performances are obtained when
the training set is equal to 95% (obtaining a precision
equal to 0.833 and a recall equal to 0.909).
We adopted this fragmentation between training
and testing dataset considering the limited number of
instances in the dataset (with the aim to build a more
accurate model to predict match results and the goal
number) (Michalski et al., 2013; Jordan and Mitchell,
2015; Carbonell et al., 1983).
Table 3 shows the results obtained in the evalua-
tion of the goal predictor module.
The best algorithm for goal number prediction is
RandomForest, with an average precision equal to
0.862 and an average recall equal to 0.868. The
less performing algorithms is J48, with an average
precision equal to 0.749 and an average recall equal
to 0.699. RandomForest algorithm outperforms the
other algorithms since it considers a multitude of trees
differently from the other considered classification
approaches.
RQ2 response: the goal prediction analysis
demonstrate that machine learning techniques exhibit
the ability to predict the number of goals scored by the
winning team. In detail, the RandomForest algorithm
obtained a precision equal to 0.879 in the number of
goal prediction less than two, and a precision equal to
0.8 in the number of goal prediction equal or greater
to two.
Can Machine Learning Predict Soccer Match Results?
463
Table 2: Classification results for match prediction: FP rate, Precision, Recall, F-Measure and RocArea computed with J48,
SMO, RepTree, RandomTree, RandomForest and MultilayerPerceptron classification algorithms.
Algorithm FP rate Precision Recall F-Measure Roc Area Result Prediction
0.375 0.750 0.818 0.783 0.841 lose
J48 0.182 0.714 0.625 0.667 0.841 win
0.294 0.735 0.737 0.734 0.841 average
0.250 0.833 0.909 0.870 0.830 lose
SMO 0.091 0.855 0.748 0.800 0.830 win
0.183 0.843 0.839 0.840 0.830 average
0.750 0.647 1.000 0.786 0.841 lose
RepTree 0.000 1.000 0.250 0.400 0.841 win
0.434 0.796 0.684 0.623 0.841 average
0.250 0.800 0.727 0.762 0.739 lose
RandomTree 0.273 0.667 0.750 0.706 0.739 win
0.260 0.744 0.737 0.738 0.739 average
0.250 0.833 0.909 0.870 0.955 lose
RandomForest 0.091 0.857 0.750 0.800 0.955 win
0.183 0.843 0.842 0.840 0.955 average
0.375 0.786 0.769 0.880 0.830 lose
MultilayerPerceptron 0.180 0.722 0.625 0.769 0.830 win
0.292 0.754 0.697 0.833 0.830 average
Table 3: Classification results for goal prediction: FP rate, Precision, Recall, F-Measure and RocArea computed with J48,
SMO, RepTree, RandomTree, RandomForest and MultilayerPerceptron classification algorithms.
Algorithm FP rate Precision Recall F-Measure Roc Area Goal Prediction
0.643 0.749 0.799 0.756 0.721 < 2
J48 0.071 0.750 0.600 0.667 0.721 >= 2
0.678 0.749 0.699 0.711 0.721 average
0.500 0.873 0.967 0.921 0.733 < 2
SMO 0.033 0.800 0.500 0.615 0.733 >= 2
0.402 0.860 0.861 0.856 0.733 average
0.400 0.867 0.929 0.897 0.929 < 2
RepTree 0.071 0.750 0.600 0.667 0.929 >= 2
0.836 0.842 0.842 0.836 0.929 average
0.500 0.879 0.967 0.921 0.733 < 2
RandomTree 0.033 0.800 0.500 0.615 0.733 >= 2
0.402 0.862 0.868 0.856 0.733 average
0.500 0.879 0.967 0.921 0.733 < 2
RandomForest 0.033 0.800 0.500 0.615 0.733 >= 2
0.402 0.862 0.868 0.856 0.733 average
0.400 0.867 0.929 0.897 0.929 < 2
MultilayerPerceptron 0.071 0.750 0.600 0.667 0.929 >= 2
0.836 0.842 0.842 0.836 0.929 average
5 CONCLUSIONS AND FUTURE
WORK
Considering the popularity of soccer, in last year sport
analytics related to soccer is a research topic with a
growing interest.
In this paper we design a methodology aimed to
predict the result of a soccer match and the number of
goals scored by the winning team. The key point of
the proposed method is the use of features (related to
the single player but also to the group of players) that
are obtainable before the end of the match. In this
case the coach is able to real-time predict the result
of a match before the end of the match under analy-
sis. In this case he can change the tactic. The pro-
posed method exploits machine learning techniques
and models built using J48, SMO, RepTree, Random-
Forest and MultilayerPerceptron classification algo-
ICAART 2019 - 11th International Conference on Agents and Artificial Intelligence
464

rithms have been evaluated.
We obtained a precision equal to 0.857 and a re-
call equal to 0.750 in the won match prediction, while
an average precision equal to 0.862 is obtained in the
number of goal prediction.
As future work, we plan to investigate whether the
proposed method is applicable to other sports like, for
instance, basketball or tennis. Furthermore, with the
aim to increase the obtained performances, we plan to
evaluate whether emerging deep learning algorithms
can be useful in order to detect match results with bet-
ter performances. Moreover, we plan to apply formal
methods (De Francesco et al., 2016; Santone et al.,
2013; Avvenuti et al., 2012) which have been already
been demonstrated to be effective in other domains,
like for example in biology (Ruvo et al., 2015).
REFERENCES
Arlot, S., Celisse, A., et al. (2010). A survey of cross-
validation procedures for model selection. Statistics
surveys, 4:40–79.
Avvenuti, M., Bernardeschi, C., De Francesco, N., and
Masci, P. (2012). JCSI: A tool for checking secure
information flow in java card applications. Journal of
Systems and Software, 85(11):2479–2493.
Baboota, R. and Kaur, H. (2018). Predictive analysis and
modelling football results using machine learning ap-
proach for english premier league. International Jour-
nal of Forecasting.
Carbonell, J. G., Michalski, R. S., and Mitchell, T. M.
(1983). An overview of machine learning. In Machine
Learning, Volume I, pages 3–23. Elsevier.
De Francesco, N., Lettieri, G., Santone, A., and Vaglini,
G. (2016). Heuristic search for equivalence checking.
Software and Systems Modeling, 15(2):513–530.
Dijksterhuis, A., Bos, M. W., Van der Leij, A., and
Van Baaren, R. B. (2009). Predicting soccer matches
after unconscious and conscious thought as a function
of expertise. Psychological Science, 20(11):1381–
1387.
Gomes, J., Portela, F., and Santos, M. F. (2015). Deci-
sion support system for predicting football game re-
sult. In Computers-19th International Conference on
Circuits, Systems, Communications and Computers-
Intelligent Systems and Applications Special Sessions.
Series, volume 32, pages 348–353.
Jordan, M. I. and Mitchell, T. M. (2015). Machine learn-
ing: Trends, perspectives, and prospects. Science,
349(6245):255–260.
Joseph, A., Fenton, N. E., and Neil, M. (2006). Predict-
ing football results using bayesian nets and other ma-
chine learning techniques. Knowledge-Based Systems,
19(7):544–553.
Kumar, G. (2013). Machine learning for soccer analytics.
Liti, C., Piccialli, V., and Sciandrone, M. (2017). Predict-
ing soccer match outcome using machine learning al-
gorithms. In Proceedings of MathSport International
2017 Conference, page 229.
Lohr, S. (2012). The age of big data. New York Times,
11(2012).
Lucey, P., Bialkowski, A., Monfort, M., Carr, P., and
Matthews, I. (2014). quality vs quantity: Improved
shot prediction in soccer using strategic features from
spatiotemporal data. In Proc. 8th annual mit sloan
sports analytics conference, pages 1–9.
Michalski, R. S., Carbonell, J. G., and Mitchell, T. M.
(2013). Machine learning: An artificial intelligence
approach. Springer Science & Business Media.
Nasrabadi, N. M. (2007). Pattern recognition and ma-
chine learning. Journal of electronic imaging,
16(4):049901.
Razali, M., Yatim, and Aziz, A. (2017). Predicting football
matches results using bayesian networks for english
premier league (epl). International Research and In-
novation Summit.
Rein, R. and Memmert, D. (2016). Big data and tactical
analysis in elite soccer: future challenges and oppor-
tunities for sports science. SpringerPlus, 5(1):1410.
Ruvo, G., Nardone, V., Santone, A., Ceccarelli, M., and
Cerulo, L. (2015). Infer gene regulatory networks
from time series data with probabilistic model check-
ing. pages 26–32.
Santone, A., Vaglini, G., and Villani, M. (2013). Incremen-
tal construction of systems: An efficient characteriza-
tion of the lacking sub-system. Science of Computer
Programming, 78(9):1346–1367.
Sathe, Kasat, K. and Satao (2017). Predictive analysis
of premier league using machine learning. Interna-
tional Journal of Innovative Research in Computer
and Communication Engineering.
Shaikh, Z. A., Khan, U. A., Rajput, M. A., and Memon,
A. W. (2016). Machine learning based number
plate detection and recognition. In Proceedings of
the 5th International Conference on Pattern Recog-
nition Applications and Methods, pages 327–333.
SCITEPRESS-Science and Technology Publications,
Lda.
Silva, D., Aidos, H., and Fred, A. L. (2016). Efficient ev-
idence accumulation clustering for large datasets. In
ICPRAM, pages 367–374.
Wu, X., Kumar, V., Quinlan, J. R., Ghosh, J., Yang, Q.,
Motoda, H., McLachlan, G. J., Ng, A., Liu, B., Philip,
S. Y., et al. (2008). Top 10 algorithms in data mining.
Knowledge and information systems, 14(1):1–37.
Can Machine Learning Predict Soccer Match Results?
465
