
Algorithms for Reorganizing Branches within Enterprise Network
Milan Dordevic and Hiba Tabbara
College of Engineering and Technology, American University of the Middle East, Kuwait
Keywords: Enterprise Network Reorganization, Finding Centres of Sections, Genetic Algorithms, Heuristic Algorithms,
Graph Decomposition.
Abstract: The problem of reorganizing branches in an enterprise network is based on a weighted graph problem
formulation. The suboptimal solution to this problem is obtained by applying a two-phase algorithm. The
first is to decompose the graph into different sections in such a way that those sections are equally balanced.
The second phase is to find a service centre for each section. In this paper, we propose an improvement of a
hybrid genetic algorithm for decomposing the graph into different sections. We also propose new algorithms
for finding centres of sections and we compare them on an illustrated examples.
1 INTRODUCTION
Enterprises with various offices or service branches,
which are ranged over many towns or countries, are
concerned in consolidating corporation properties by
reorganizing them. Restructuring denotes to replace a
number of service branches with a smaller number of
existing ones, which are referred to as centres. Each
centre will serve the county that used to be served by
the replaced service branches. The enterprise
branches can be company’s offices, warehouses,
logistics centres, etc. A good example of regrouping
is a decision of educational authorities to regroup
public schools into a smaller number of existing
schools (Mansour, 1998). The aims of reorganization
are usually to consolidate human resources, improve
service quality, reduce the cost of services, or
centralize company branches. In order to fulfil these
objectives, application-dependent criteria/constraints
can be established for selecting a centre to replace or
serve a group of nearby service sites.
Very important condition is to find the centre of a
section so that the total travel distance between
service sites and their centre is minimized. Additional
important condition is to have balanced distribution
of services over the different sections. Therefore, not
only the distances from the sites to their respective
centres are considered, but also the service demand
distribution is used to determine the sections (of sites)
that should be served by centres.
After decomposing a graph into the required
number of sections, a site/vertex within each
section/subgraph needs to be selected to become the
centre into which the other sites in the section should
be regrouped. The objective of centre selection is to
minimize the maximum distance (edge cost) within
the section from the service branches to the centre.
This paper is organized as follows. Section 2
provides a literature review. Section 3 describes the
reorganization of enterprise network problem and its
objective function. In Section 4, we present the
Hybrid Iterative Genetic Algorithm (HIGA) for graph
decomposition. Section 5 includes study about
different proposed algorithms for finding the centre
of section. Section 6 explains the experimental
results. Section 7 contains conclusions and future
work.
2 LITERATURE REVIEW
The problem addressed in this paper relates to a
problem described in (Mansour, 2004), where a two-
phase algorithm was presented to regroup service
sites and find centres of regions. In earlier research,
(Tabbara, 2000) authors presented a graph problem
such that given a graph, a subset of the vertices of
are selected to represent the other vertices in the
graph; subject to some application-dependent criteria.
This is done by a two-phase approach where, first, the
graph was decomposed into regions, and, second, a
centre, that represents the other vertices in the region,
is selected for each region.
The problem of reorganization of enterprise net-
Dordevic, M. and Tabbara, H.
Algorithms for Reorganizing Branches within Enterprise Network.
DOI: 10.5220/0007254700370044
In Proceedings of the 8th International Conference on Operations Research and Enterprise Systems (ICORES 2019), pages 37-44
ISBN: 978-989-758-352-0
Copyright
c
2019 by SCITEPRESS – Science and Technology Publications, Lda. All rights reserved
37

work was addressed in its exact problem definition by
Seo et al (Seo, 2005). Seo et al. tackled the problem
in a geometric setting. They decompose the 2D plane
using Voronoi diagram. They also use a genetic
approach to balance the sums of weights of different
sub graphs.
The reorganization of enterprise network problem
is similar to k-center problem which is a classical
problem in facility location. It is stated as follows:
Given n cities and the distances between them, select
k of these cities as centers so that the maximum
distance of a city from its closest center is minimized
(Hauchbaum, 1995). Two fixed parameter
approximations were given for graphs with bounded
highway dimension. This is a k-center problem
which occurs naturally in transportation networks
(Abraham, 2011), (Feldmann, 2015).
Some graph problems such as facility location,
and p-median problem (Ahmadian, 2017) can be
related to our problem too.
In (Farahani, 2010), authors reviewed literature of
facility location problems that uses multi-criteria
decision making tools as solution techniques. Some
of the problems studied have been applied to real-
world problems, which was the main target of their
paper.
In a recent PhD thesis (Ahmadian, 2017), author
considered some sophisticated facility-location
problems that well abstract some real-world sceneries
than the basic facility location problems like un-
capacitated and capacitated facility location problems
and k-median. The author developed techniques for
approaching these problems by leveraging
understanding of basic facility location problems and
their techniques produce some approximation
guarantees for these problems.
In (Wang, 2012), authors studied a facility
location model with fuzzy random parameters and its
swarm intelligence approach. The numerical
experiments from their research showed that the
hybrid algorithm is robust to the parameter settings
and exhibits better performance than the particle
swarm optimization and genetic algorithm
approaches.
The nearest neighbour algorithm is one of the
simplest learning methods known (Cost, 1993) and
we used it as motivation for one of suggested
algorithms for finding centres of sections.
The problem studied in this paper, reorganization
of enterprise network, is different compared to those
studied in (Farahani, 2010), (Ahmadian, 2017),
(Wang, 2012) since it requires a balanced distribution
centres over the diverse regions and that any city can
be a centre. Further, unlike the facility location
problem, reorganization of enterprise network define
the number of to-be-selected centres. Unlike the p-
median problem, regrouping sites requires an exact
number of selected centres and not an upper bound.
Another similar problem is graph partitioning
where a graph is partitioned into sub graphs which
sizes are nearly balanced and the sum of the weights
of the cut edges between sub graphs is minimized.
The difference between this problem and the
reorganization of enterprise network problem is
mainly that the weights of the edges between the sub
graphs are of no importance to the reorganization of
enterprise network problem. Several heuristics have
been proposed for this problem (Battiti, 1999),
(Echbarthi, 2014).
(Chen, 2011) proposed a genetic algorithm for
solving the m-way graph partitioning problem and
showed it is more efficient than some other
algorithms in terms of computation time and solution
quality.
Genetic algorithms have been applied in different
problems to find good approximate solutions.
Examples are given in (Fernandez, 2018),
(Azadzadeh, 2011), (Wang, 2017) and (Morell,
2017).
In (Djordjevic, 2011), authors showed
quantitative analysis of separate and combined
performance of local searcher and genetic algorithm.
Even when both components have serious drawbacks,
their hybridized combinations combine good
qualities from both methods applied, significantly
outperforming each of them.
(Karout, 2007) used a hybrid genetic algorithm
(HGA) to solve two-dimensional phase unwrapping
problem. They employed both local and global search
methods. The HGA was compared to three well-
known branch-cut phase unwrapping algorithms and
was found to be more robust and fast.
3 PROBLEM STATEMENT AND
OBJECTIVE FUNCTION
The reorganization of enterprise network problem is
formulated as follows:
, where is the set of
service sites.
V; is a vertex of G that has
weight
derived from the user-defined site’s
attributes whether related to economic, social or
demographic factors.
(
) E, , i ,
denotes an edge with cost
representing the
ICORES 2019 - 8th International Conference on Operations Research and Enterprise Systems
38

geographical distance and the quality of the connection
between
and
.
Find subset, size, of to be designated as centres
to serve the vertices, given
and
for all vertices
and
An example is when a number of public schools
need to be regrouped into a smaller number of schools
that are better-equipped in terms of human and
physical resources. This may also reduce the overall
cost (Mansour, 1998).
In (Mansour, 2004), the authors divided the
problem into two sub problems:
1. Graph decomposition problem: Partition the set of
vertices into subsets where the total vertices
weights in the subsets are balanced and the total
inner edge cost within each subset is minimized.
2. Centre selection problem: Select a centre for each
of the subsets (sub graphs) so that the maximum
edge cost within a region is minimized and biased
by the weights of vertices.
Regrouping allows the total services demanded by
the clients in each of the sections to be provided by one
of the service centres. In other words, for each subset
of vertices of (called section), there will be a
representative centre that the subset’s vertices will map
to.
An objective function for the graph decomposition
problem is formulated as follows:
(1)
Where:
(2)
Is the weight of a section ,
|
| - |
(3)
Is the deviation of the total vertices weights in a sub
graph , and
|
|
(4)
Is the total sum of the inner edge costs within a sub
graph
The objective function needs to be minimized
meaning that both
and
are to be minimized in
all sections. We want minimal deviation from the
average of vertices weights and low values for the sum
of edge weights among sections.
4 HYBRID ITERATIVE GENETIC
ALGORITHM
Genetic Algorithms (GA) are nature inspired
algorithms that uses some logic acquired from biology
(Holland, 1992). Each individual in a population
represents one of the feasible solutions in the search
space. Each individual in the population is assigned a
value called fitness. A genetic search is done to evolve
a population of initial solutions into a near-optimal
solution (Chambers, 1995).
Fitness represents a relative indicator of quality of
an individual compared to other individuals in the
population. By a successive application of selection,
crossover, and mutation the diversity of genetic
material can be decreased, which leads to a premature
convergence in a local optimum, which may be far
from a global one. That is the reason why heuristic
algorithms are added to the canonical genetic
algorithm to improve the quality of solutions as was
described in (Djordjevic, 2009), (Djordjevic, 2012).
An outline of the Hybrid Iterative Genetic Algorithm
(HIGA) is given in Listing 1.
Listing 1: Hybrid Iterative Genetic Algorithm (HIGA).
Input: graph G and sub graphs
1: Randomly generate initial
population, size
2: Evaluate fitness of individuals;
3: while (not converge)
4: Rank individuals and allocate
reproduction trials;
5: for to
6: Randomly select two parents
from list of reproduction
trials;
7: Apply recombination and
mutation;
8: Apply hill-climbing;
9: Evaluate fitness of offspring;
10: Save the Fittest to
11: Visit all vertices and mark them
Type A, Type B, Type C, or Type D;
12: Remap all vertices of ‘Type C’;
13: Remap all vertices of ‘Type D’;
14: if some vertices become of ‘Type C’
then remap these vertices.
15: Save the Fittest to
16: if then
17: else
18: return
In line 1 of Listing 1, the population of
chromosomes is represented by a two-dimensional
array of integers of size .
Algorithms for Reorganizing Branches within Enterprise Network
39

An individual in the population is encoded as -
element row
, where a gene,
takes a value that corresponds to a sub graph
(section) and its position, corresponds to the vertex
(branch) assigned to this sub graph.
The fitness function to be minimized is equal to.
The reproduction scheme involves elitist ranking,
followed by random selection of mates from the list of
reproduction trials assigned to ranked individuals. In
the ranking scheme, the individuals in the population
are sorted by fitness values in line 4 of Listing 1.
The probability of recombination used in line 7 is
0.7 and the mutation rate is set to be 0.1. The
recombination operator used is multi-point crossover,
which is applied to a randomly selected pair of
individuals. Mutation is performed on randomly
selected vertices by reassigning them to other
randomly selected sub graphs.
The genetic algorithm is hybridized for speeding
up the evolution and improving its solution quality by
adding a hill-climbing procedure that is applied to all
individuals in the population after recombination and
mutation. In line 8, every vertex, mapped to a sub graph
that has a neighbouring vertex mapped to a different
sub graph is considered. It will reassign such a vertex
to another randomly selected sub graph.
If the fitness of the respective candidate solution
increases, then the proposed assignment is accepted,
else the vertex is kept in the initial sub graph. When the
best-so-far candidate solution does not improve its
fitness value for 20 consecutive generations, it will
converge and exit the loop at line 9. The fittest solution
is saved as value in line 10.
In Line 11, the algorithm visits all the vertices of
the graph and determines the type of each vertex
according to the following alternatives: ‘Type A’ for
‘inner’ vertices, ‘Type B’ for ‘boundary’ vertices,
‘Type C’ for ‘misplaced within one section’ vertices,
and ‘Type D’ for ‘misplaced within more than one
section’ vertices.
An ‘inner’ node is a site mapped to a section such
that all its adjacent sites are mapped to the same
section. A ‘boundary’ node is a site mapped to a section
such that some of its adjacent sites are inner sites of the
same section, while other adjacent sites belong to other
sections. A ‘misplaced within one section’ node is a
location mapped to a section such that none of its
adjacent nodes are ‘inner’ to section and all of these
adjacent nodes that do not belong to are mapped to
section, where
A ‘misplaced within more than one section’ node
is a branch mapped to a section such that none of its
adjacent sites are ‘inner’ to section and all of these
adjacent sites that do not belong to are mapped to
more than one different section. Then the remap of
different types of vertices occurs as shown in lines 12
till 14. Now the fittest solution is saved as value. In
line 16 we compare obtained solutions and and
select the minimum value as final solution. In this way
our algorithm guarantees that if there is no
improvement after tuning steps (lines 12-14), the
original solution of the hybrid genetic algorithm is
kept.
Note that the result of HIGA algorithm is used as
input for second part of a problem which is selection of
a section centre. In this part of research we are not
interested in absolute performance of HIGA algorithm
but rather to produce a feasible solution to be used as
input to algorithms suggested in the following section.
5 ALGORITHMS FOR FINDING
CENTRE OF SECTION
After applying the HIGA for decomposing a graph into
the required number of sections, we need to select a
location/vertex within each section/sub graph to
become the centre into which the other branches in the
section should be regrouped.
The objective of centre selection is to maximize the
weight of vertices as a candidate for centre of section
and to minimize the distance (length) within the section
from the sites to the centre. For each sub graph, a
centre–vertex should be selected to replace or serve all
the vertices of.
In addition to the geographical constraint of short
vertex-to-centre distances, centre selection should
favour heavily weighted vertices. Since vertex weights
are determined based on economic and social factors
for branches/vertices, higher weight indicates that a
branch/vertex is fitter to be a centre and/or is more
suitable for the customers within the location itself.
In this section, first we present an improved
algorithm for centre selection in Listing 2 named
Degree Selection Algorithm (DSA).
Listing 2: Degree Selection Algorithm.
Input: sub graph
;
1: for all sub graphs
2: if
is fully connected then
3: return
with
4: for all
5: calculate value
6: select maximum
7: if
then
8: return
ICORES 2019 - 8th International Conference on Operations Research and Enterprise Systems
40

For each sub graph, a centre–vertex will be
selected to replace or serve all the vertices of. Each
service branch is represented by a vertex in a
weighted undirected graph with .
Each vertex
has a weight
derived from the
user defined site’s attributes.
The value
of vertex
is computed by using
equation
(line 3 in Listing 2), where
stands for weight of vertex
and
represents
degree of vertex
. The degree or valence of vertex
is the number of edges that vertex
contains.
The vertex with maximum
is selected as centre
of the section. If there are more candidates for centre
of the section, meaning that few of
`s are equal, then
centre of the section is vertex with minimum
where
stands for length of edges from
vertex
to all neighbour sites. Kindly note, that in
line code 2 of Listing 2 we check if sub graph
is
fully connected. The fully connected sub graph
is
the one where all branches have a direct connection
to each other. If this is true, then the new centre of
section is vertex
with maximum weight
because
the degree of all vertices
is the same. In that case
the computational time will be saved. In the enterprise
regrouping problem the fully connected network can
mean there is a direct connection between two
branches.
The second proposed algorithm is a Greedy
Selection Algorithm (GSA) presented in Listing 3.
Every vertex
in every section
will vote for his
nearest neighbour (the direct connected vertex with
minimal length edge). The vertex
with the most
votes,
will be selected for the centre of
the section
. If there are more than one vertex with
the same number of votes, then the new centre of
section is vertex
with the maximum weight
.
Listing 3: Greedy Selection Algorithm.
Input: sections
;
1: for all sections
2: for every
3: vote to nearest neighbour
4: save unique
5: if
then
6: return
with
The greedy centre selection algorithm favours
the shortest connections in a graph. This is in a line
with objectives of Enterprises to minimize the
travelling from centre of sections to other service
branches. By giving a priority on the connectivity of
particular location the proposed greedy algorithm is
taking into account the weight of branches only if the
voting for the nearest neighbour is undecided.
The third proposed algorithm is Shortest-path
Selection Algorithm (SSA) described in Listing 4.
Listing 4: Shortest-path Algorithm.
Input: sections
;
1: for all sections
2: for every
3: run Dijkstra`s n time
4: save unique min
5: if
then
6: return
with
In line 3 of Listing 4 we run Dijkstra algoritm
times, where stands for a number of vertices in a
section. The Dijkstra Algorithm is an effective
algorithm to find a shortest path between the pair of
vertices in graph (Cormen, 2009). The goal is to find
the sums of all shortest paths from each vertex to
every other vertex in a section and select the unique
one with minimum sum to be new centre of section.
If there are more than one vertex with the same sum
of shortest paths, then the new centre of section is
vertex
with the maximum weight
.
Note that on fully connected graph the shortest
path algorithm gives the same result as Greedy
Selection Algorithm, because the shortest path for
every pair of vertices is a direct edge between them.
Note that this is true for planar graphs.
6 EXPERIMENTAL RESULTS
In this section, we consider the algorithms for finding
the centre of section presented in the previous part in
Listing 2, Listing 3 and Listing 4.
Figure 1, Figure 2 and Figure 3 show examples of
the problem, where two criteria need to be satisfied.
First criterion is to maximize the weight of vertices
while selecting a candidate for centre of section and
second one is to minimize the distance (length) within
the section from branches to the centre.
Each service branch is represented by a vertex in
a planar weighted undirected graph
with . Each vertex
has a weight
derived from the user defined site’s attributes -
integer inside vertex which also stands as its label.
Also,
denotes an edge with a cost
representing the distance and the quality of the
connection between the branches associated with
and
- integers on edges.
Algorithms for Reorganizing Branches within Enterprise Network
41
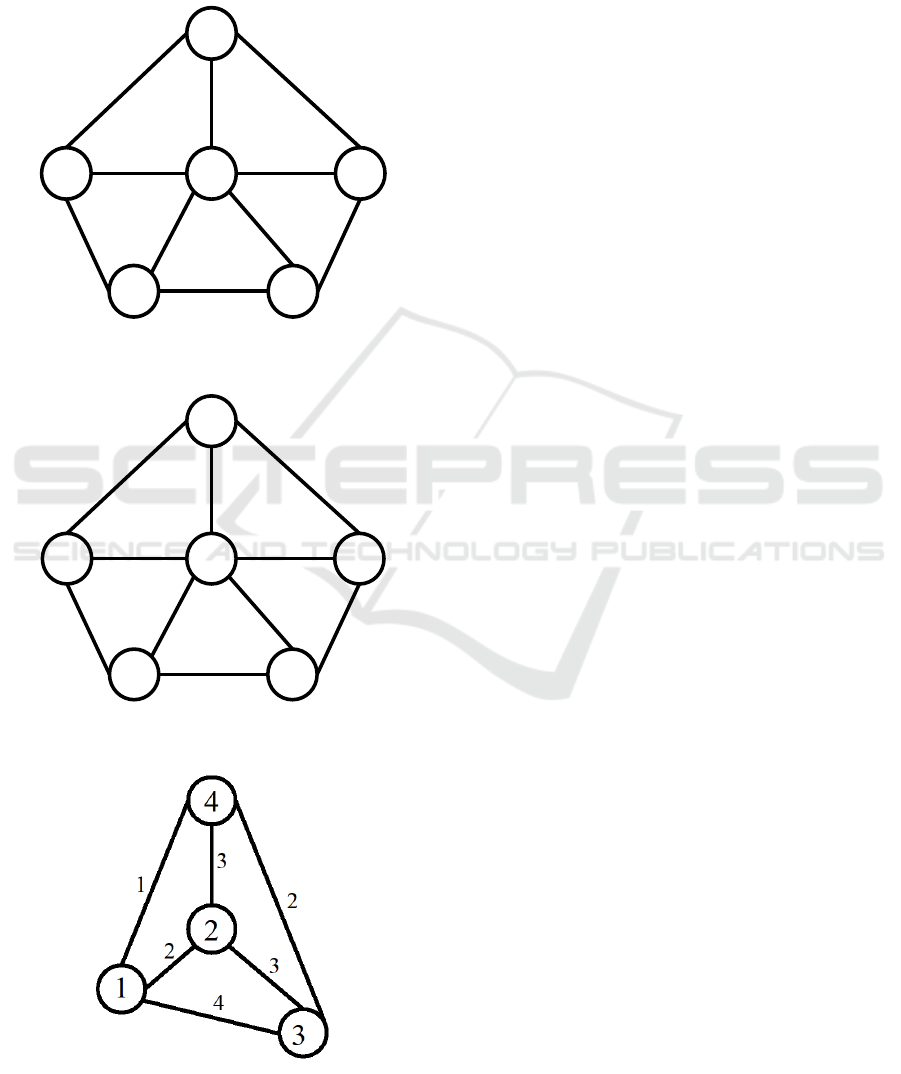
The degree of a vertex
, represented as
, is the
number of edges that contain it. So, in examples from
Figure 1 and Figure 2,
for all vertices except
middle vertex whose degree equal 5. The difference
in the first two examples is swapped places of vertices
and
.
2
46 3
51
3 3
3
33
4 4
22
2
Figure 1: Instance 1 of finding the centre of sections.
2
36 4
51
3 3
3
33
4 4
22
2
Figure 2: Instance 2 of finding the centre of sections.
Figure 3: Instance 3 of finding the centre of sections.
Using Listing 2 and equation
, the
value
of vertex
is computed. The following
results are obtained. On the graph
in Figure 1, after
comparing
and
, we get
, therefore,
is selected as centre of the section. In the graph
in Figure 2, after comparing
and
, the selected
centre is
, since .
Both
and
values are important in choosing
the centre. In
so
is double of
even though
. This example is used to show
behaviour of our algorithm on similar instances where
both criteria are equally important in finding solution.
Now, let us apply the algorithm in Listing 2 to
graph
in Figure 3. Since
is fully connected, the
algorithm returns the vertex with maximum weight.
Hence, the algorithm returns vertex
.
Running the Greedy Selection Algorithm on the
three instances, we need to find the votes for different
vertices in the graphs. We will designate
to mean
votes for
,
, …
- Instance 1:
,
,
,
,
,
,
Vertices
and
got the most votes. According
to the algorithm, in this case where we have equal
votes, the vertex with the highest weight will be
selected. Hence, vertex
is selected to be the centre
of section.
- Instance 2:
,
,
,
,
,
,
Vertices
and
got the most votes. Also,
vertex
is selected to be the centre of section.
- Instance 3:
Vertices
and
got the most votes. In this case,
the vertex with the highest weight will be selected.
Hence, vertex
is selected to be the centre of
section. Applying the Shortest-path algorithm
presented in Listing 4, the three examples give the
results given below, taking into consideration the
overall distances between different vertices. The tables
ICORES 2019 - 8th International Conference on Operations Research and Enterprise Systems
42
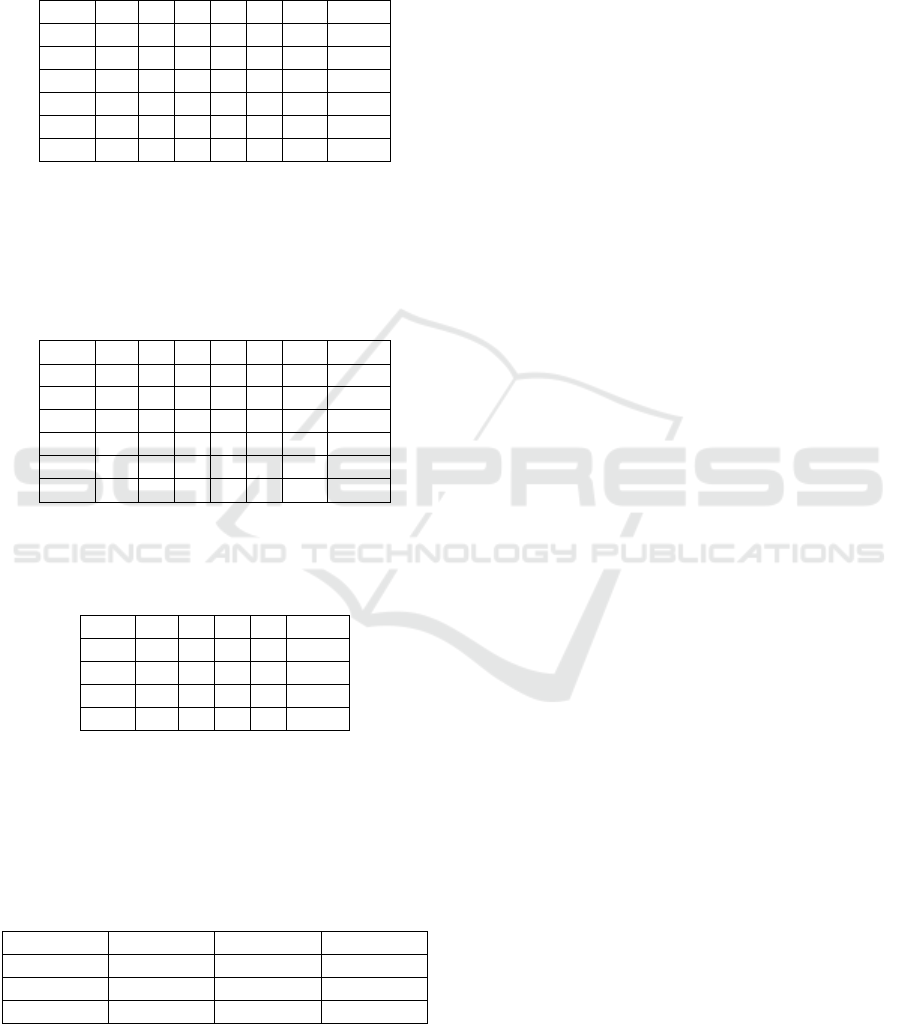
show the shortest distances between vertices, with the
last column being the sum of the shortest distances for
each vertex. Note that the table is symmetric with
respect to the diagonal.
Table 1: Shortest-path algorithm result for Instance 1.
total
0
6
4
3
2
2
17
6
0
4
3
6
4
23
4
4
0
3
2
6
19
3
3
3
0
3
3
15
2
6
2
3
0
4
17
2
4
6
3
4
0
19
Vertices
and
got the total shortest distances.
According to the algorithm, in this case where we
have equality of results, the vertex with the highest
weight will be selected. Hence, vertex
is selected
to be the centre of section.
Table 2: Shortest-path algorithm result for Instance 2.
total
0
6
3
4
2
2
17
6
0
3
4
6
4
23
3
3
0
3
3
3
15
4
4
3
0
2
6
19
2
6
3
2
0
4
17
2
4
3
6
4
0
19
Vertex
got the total shortest distances. Hence,
vertex
is selected to be the centre of section.
Table 3: Shortest-path algorithm result for Instance 3.
total
0
2
4
1
7
2
0
3
3
8
4
3
0
2
9
1
3
2
0
6
Vertex
got the total shortest distances. Hence,
vertex
is selected to be the centre of section. Table
4 shows the comparison of results of the three centre
selection algorithms, namely DSA, GSA and SSA on
the graphs given in this section.
Table 4: Comparison of results of the three centre selection
algorithms on the three graphs.
DSA
GSA
SSA
Instance 1
Instance 2
Instance 3
7 CONCLUSIONS
We have proposed an improved algorithm for graph
decomposition problem called Hybrid Iterative
Genetic Algorithm (HIGA) that uses the results of the
HGA and Tuned HGA. HIGA presents an
improvement over the two algorithms as was shown
by experimental results. We have also demonstrated
3 different approaches for finding centres of sections
that maximizes the weight of vertices and minimizes
the distance (length) within the section from branches
to the centre.
Future work includes to compare HIGA with
other meta-heuristic algorithms available in literature
such as simulated annealing and tabu-search. We are
also interested in fine tuning of existing and
proposing new algorithms for centre selection
problem.
REFERENCES
Farahani, R. Z., SteadieSeifi, M., and Asgari, N. Multiple
criteria facility location problems: A survey. Applied
Mathematical Modelling, 34(7), 2010: 1689-1709.
Ahmadian, S. Approximation Algorithms for Clustering
and Facility Location Problems; 2017.
Wang, S., and Watada, J. A hybrid modified PSO approach
to VaR-based facility location problems with variable
capacity in fuzzy random uncertainty. Information
Sciences, 192, 2012: 3-18.
M. Djordjevic, M. Tuba and B. Djordjevic. Impact of
grafting a 2-opt algorithm based local searcher into the
genetic algorithm. In Proceedings of the 9th WSEAS
international conference on applied informatics and
communications. Stevens Point, WSEAS, Moscow,
2009: 485–490
M. Djordjevic, M. Grgurovic and A. Brodnik. (2012).
Performance Analysis of Partial Use of Local
Optimization Operator on Genetic Algorithm for
Traveling Salesman Problem. In Business Systems
Research, Print ISSN 1847-8344; Online ISSN 1847-
9375, 3 (1): 14–22.
M. Djordjevic and A. Brodnik. Quantitative analysis of
separate and combined performance of local searcher
and genetic algorithm. In Proceedings of the 33rd
International Conference on Information Technology
Interfaces, ITI 2011, SRCE, Zagreb, 2011: 515–520.
Mansour N, Rishani G. A decision support system for
regrouping public schools. Proceedings of the IASTED
International Conference Computer Systems and
Applications, Acta Press, March 30–April 2 1998. 71–
73.
Seo J-Y, Park S-M, Lee S-S, Kim D-S. Regrouping service
sites: a genetic approach using a voronoi diagram.
Proceedings of 2005 conference on Computational
Science and its Applications. 2005; 4: 652-661.
Algorithms for Reorganizing Branches within Enterprise Network
43

Chen Z-Q, Wang R-L. Solving the m-way graph partitioning
problem using a genetic algorithm. IEEJ Transactions on
Electrical and Electronic Engineering. 2011; 5 (6): 483-
489.
Mansour N., Tabbara, H. Dana T. A genetic algorithm
approach for regrouping service sites. Computers &
Operations Research. 2004; 31: 1317-1333.
Tabbara H., Dana T., Mansour N. Heuristics for graph
decomposition. The 7th IEEE International Conference
on Electronics, Circuits and Systems. ICECS 2000. 2000;
Vol. 2: 650 – 653.
Holland, J. H. Adaptation in natural and artificial systems: an
introductory analysis with applications to biology,
control, and artificial intelligence. MIT press, 1992.
Chambers, LD. Practical handbook of genetic algorithms,
Vol. I, II, Boca Raton, FL: CRC press, 1995.
Fernandez R.A., Lozano A. Fuel optimization strategy for
hydrogen fuel cell range extender vehicles applying
genetic algorithms. Renewable and sustainable energy
reviews. 2018, 81 (1): 655-668.
Azadzadeh V., Golkar M.A., Moghaddas-Tafreshi S.M.,
Economics-based transmission expansion planning in
restructured power systems using decimal codification
genetic algorithm. 2011 IEEE Jordan conference on
applied electrical engineering (AEECT), 2011.
Wang S., Zhao F., Liu Z., Hao H., Heuristic method for
automakers’ technological strategy making towards fuel
economy regulations based on genetic algorithm: A
China’s case under corporate average fuel consumption
regulation. Applied Energy. Elsevier. Vol. 204, 2017:
544-559.
Morell J.A., Alba E., Distributed genetic algorithms on
portable devices for smart cities. International
conference on smart cities, part of the lecture notes in
computer science book series (LNCS, Vol 10268),
Springer, 2017: 51-62.
Karout S. A., Gdeisat M. A., Burton D. R., Lalor M. J., Two-
dimensional phase unwrapping using a hybrid genetic
algorithm. Applied Optics. 46(5), 2007: 730-743.
Battiti R., Bertossi A.A. Greedy, prohibition, and reactive
heuristics for graph partitioning. IEEE transactions on
computers. 4 (48), 1999: 361-385.
Echbarthi G., Kheddouci H. Fractional greedy and partial
restreaming partitioning: New methods for massive
graph partitioning. 2014 IEEE international conference
on Big Data. 2014.
Cost, S. and Salzberg, S. A weighted nearest neighbor
algorithm for learning with symbolic features. Machine
learning, 10(1), 1993: 57-78.
Cormen, T.H., Leiserson, C.E., Rivest, R.L. and Stein, C.,.
Introduction to algorithms. MIT press, 2009.
Hochbaum D. and Shmoys D., A best possible heuristic for
the k-center problem, Math of Operations research, Vol.
10, No. 2, 180-184, 1995.
Abraham I, Delling D., Fiat A., Goldberg A.V, Werneck R.
F., VC-Dimension and Shortest path Algorithms.
ICALP 2011, Part I. LNCS, Vol. 6755, pp 690-699.
Springer, Heidelberg, 2011.
Feldmann A E, Fixed Parameter Approximations for k-
Center Problems in Low Highway Dimension Graphs,
Automata, Languages, and Programming, ICALP 2015,
Lecture Notes in Computer Science, Vol. 9135, Springer,
Berlin, Heidelberg, 2015.
APPENDIX
Table 5: Comparison of results of HIGA to other algorithms.
Test case
N
s
Random
HGA
Tuned HGA
HIGA
I1
50
3
443.0
201.9
197.1
197.1
I2
50
4
492.6
172.0
172.2
172.0
I3
50
5
387.4
149.5
184.0
149.5
I4
50
7
417.9
117.4
117.4
117.4
I5
50
8
353.7
120.5
118.9
118.9
I6
100
5
800.8
328.2
330.8
328.2
I7
100
10
676.3
214.7
213.9
213.9
I8
100
15
655.0
171.7
174.4
171.7
I9
100
20
601.3
144.3
144.1
144.1
ICORES 2019 - 8th International Conference on Operations Research and Enterprise Systems
44
