
The Effect of Salinity on the Biomass of AVICENNIA MARINA and
RHIZOPHORA MUCRONATE Grown at Reed Bed System Reactor
with Continuous Flow
Tri Cahyo Puspaningrum
1,a
and Harmin Sulistiyaning Titah
1
Department of Environmental Engineering, Faculty of Civil, Planning and Geo Engineering
Institut Teknologi Sepuluh Nopember, Indonesia
Keywords: Growth, Mangrove, Reed Bed System.
Abstract: Salinity is one of the environmental factors having an important role in controlling mangrove growth. Each
type of mangrove has different adaptability. This condition causes the differences of structure and
composition of mangrove with distinctive boundaries, ranging from zones close to land to zones close to the
ocean. This research was aimed to examine the ability to grow mangrove (Avicennia marina and Rhizophora
mucronata) at various levels of salinity, using reed bed system reactor with continuous flow and the addition
of the bacteria Vibrio alginolyticus. The reactors were arranged in series system, namely reactor with
Avicennia marina (AM), reactor with Rhizophora mucronata (RM), reactor with Avicennia marina and
bacteria of Vibrio alginolyticus (AMVA), and reactor with Rhizophora mucronataand Vibrio
alginolyticus(RMVA). The artificial salinity that was used i.e 20 ‰ and 25 ‰. Physical observation of the
mangrove growth indicators was conducted during the exposure time. The fresh weight (FW) and dry weight
(DW) were measured at day 0 and the last day of experiment. The monitoring parameters such as pH and
temperature were also measured. The results showed the FW and DW increased in all reactors. Avicennia
marina with added bacteria had the greatest growth at the salinity concentration of 25‰ with 69,27 g of DW.
Salinity of 25‰ showed a greater growth result than salinity with a concentration of 20‰.
1 INTRODUCTION
Salinity is the level of salinity or dissolved salt
contained in water in grams per litre of seawater
(Chimayati and Titah, 2019). Salinity is one of the
defining environmental features of mangrove habitats
and ranges from seasonally freshwater to hypersaline
conditions (Flowers and Colmer, 2008). Salinity can
be interpreted as a condition where salt dissolves
excessively and causes bad conditions for plant
growth (Syakir et al., 2008). According to Bengen
(2003) salinity greatly determines the development of
mangrove area, this can occur because of the
influence of salinity which can divide mangrove
growth areas into several zones, from the nearest
zonation or bordering the sea (proximal zone) to the
farthest zonation from the sea (distal zone).
According to Purwanti et al. (2006), classification of
the sample water for salinity parameters is divided
into freshwater with a value of <0.5‰, brine water
with the salinity ranging from 0,5–30‰, salty water
30–50‰ and very salty water or sea water, which has
a salinity of more than 50‰. Mangrove has the ability
to tolerate the sea salinity and grow at above average
levels (Ananthakrishnan, 1982; Flowers et al.,1977).
Mangrove forest ecosystems are often called brackish
forests because they are located in brackish areas,
which are areas with salinity or salinity between
0,5‰ and 30‰. Another name is the tidal ecosystem
because it is located in areas affected by tides
(Indriyanto, 2006). They adapt themselves to
fluctuating environment in several ways such as salt
exclusion from roots (Hegemayer, 1997), salt
secretion (Fitzgerald et al., 1992) and accumulating
organic acids as osmotica to counter toxic effects of
salinity (Popp, 1984). Mangrove plants comprise a
heterogeneous group of independently derived
lineages that are defined ecologically by their location
in upper intertidal zones of tropical and sub-tropical
climates and physiologically by their ability to
withstand high concentrations of salt or low levels of
soil aeration (Basyuni et al., 2007).
30
Puspaningrum, T. and Titah, H.
The Effect of Salinity on the Biomass of AVICENNIA MARINA and RHIZOPHORA MUCRONATE Grown at Reed Bed System Reactor with Continuous Flow.
DOI: 10.5220/0010864200003261
In Proceedings of the 4th International Conference on Marine Technology (senta 2019) - Transforming Maritime Technology for Fair and Sustainable Development in the Era of Industrial
Revolution 4.0, pages 30-37
ISBN: 978-989-758-557-9; ISSN: 2795-4579
Copyright
c
2022 by SCITEPRESS – Science and Technology Publications, Lda. All rights reserved

The flora community found in mangrove forests
has undergone adaptation and specialization as a
mechanism for living in an environment with high
levels of salt (Kustanti, 2011). Mangrove can adapt to
low oxygen levels, tolerate high salt levels and can
adapt to unstable soils and the influence of tides
(Bengen, 2003). According to Saparinto (2007),
mangroves depend on seawater (tides), freshwater,
and sediment as a source of nutrients. In high salt
conditions, plants will face two problems: obtaining
water from negative potential groundwater and
overcoming the high ion concentration of sodium,
carbonate, and chloride which may be toxic
(Salisbury and Ross, 1995). One indicator of
mangrove growth is it is physically influenced by the
sediment where it lives, which contains macro and
micronutrients, oxygen, and fresh water to maintain a
balanced salt content (Chrisyariati et al., 2014).
Limiting factors for mangrove production and growth
include temperature and sunlight, salinity, anoxia and
tides, bioturbation, and nutrient availability (Alongi,
1998). The growth and physiological mechanisms of
mangroves differ in nature due to their complexity of
structure and differences flooding regime, tidal
inundation, a rapid influx of extra nutrients as well as
the type of soil (Naidoo, 1987).
Avicennia has the ability to tolerate a wide range
of salinity. The species is able to grow well in salinity
up to 90 ‰ but at extreme salinity, the tree grows
stunted and the ability to produce fruit is lost (Noor et
al., 2006). Avicennia marina collects the highest ion
concentration from Rhizophora mucronata
(Scholander et al., 1962), which means that the ability
of Rhizophora mucronata to accumulate inorganic
ions is lower than that of Avicennia marina (Titah et
al., 2019).
The influence of salinity on mangrove growth was
reported by Clough (1984) who stated that the highest
number of Avicennia marina and Rhizophora stylosa
dry weight was obtained when grown at 25‰
seawater content. He also reported that CI- and Na+
ion levels were greater than K+, Ca2+, and Mg2+
ions in mangrove plant roots, stems and leaves which
grown in five different concentrations of seawater
that he tried. Stem and Voigt (1959) in Tomlinson
(1986) argue that it was better to use low level of
seawater for breeding Rhizophora. Connor (1969) in
Tomlinson (1986) found the optimum conditions for
Avicennia marina growth was in a solution containing
50‰ Na+ ions and Na from seawater.
Bacteria can increase plant tolerance to
environmental conditions that might reduce plant
growth or development (Sulastri, 2018). Vibrio
alginolyticus, a helobacterium bacteria, can live in
areas with high salt levels and are resistant to
radiation and live in salt crystals. It functions in the
process of the nutrition cycle and supports the life
buffer of the ecosystem environment (Thompson et
al., 2004). Vibrio alginolyticus bacteria is indeed
found in saline water. These bacteria can grow and
live in the area of plant roots which were in water that
has a high level of salinity. Vibrio bacteria grows at
pH 4–9 and optimally at pH 6,5–8,5 or under alkaline
conditions with pH 9,0 (Chimayati and Titah, 2019).
Vibrio bacteria could die under the acidic conditions.
Kurniawan et al., (2018) reported that Vibrio
alginolyticus needed 2 h at pH 8 to grow, meanwhile
it needed 48 h at pH 5. He indicated that the bacteria
did not develop at pH below 5, shown by an Optical
Density (OD) value of 0.
Plant growth can be defined as the enhancement
size process and number of plant cells followed by the
growth of plant dry weight, while the development of
plants can be interpreted as a process towards
achieving maturity (Kolinug et al., 2014). Plant
growth and development is divided into two phases:
vegetative growth phase and the generative growth
phase (Prayunita, 2012). According to Popp (1994),
mangroves collect high concentrations of inorganic
ions like most other salt tolerant plants that function
in leaf and other tissue osmoregulation. This form of
osmoregulation involves the synthesis and
accumulation of organic compounds sufficient to
decrease the osmotic potential of cells and increase
turgor pressure (Kusumiyati et al., 2017). Flowers et
al. (1977) argue that in the early stages of adaptation
to high salinity or the increase of salinity when the
salt concentration in the liquid was increasing, the
rate of ionic absorption was related to the growth rate
of the plant. Mangrove plants take salt as nutrients for
their growth needs.
The aim of this study was to determine the effect
of salinity on the growth of mangrove Avicennia
marina and
Rhizophora mucronata with artificial
salinity variation of 20‰ and 25‰ in a reed bed
system reactor combined with Vibrio alginolyticus
bacteria.
2 MATERIALSAND METHODS
2.1 Location of Research
This research was conducted at the greenhouse of the
Department of Environmental Engineering, Institut
Teknologi Sepuluh Nopember, ITS, for the
implementation of the reed bed system reactor and at
the Environmental Remediation Laboratory in same
The Effect of Salinity on the Biomass of AVICENNIA MARINA and RHIZOPHORA MUCRONATE Grown at Reed Bed System Reactor
with Continuous Flow
31

department for bacterial propagation and analysis of
the growth parameters.
2.2 Material and Method
2.2.1 Bacterial Preparation
The inoculation stage used NA (Nutrient Agar)
(Merck, USA) and TCBS (Thiosulfate Citrate Bile
Salt Sucrose) (Merck, USA) for selective media. NA
media was used as the initial inoculation media.
TCBS media is a special selective media for Vibrio
alginolyticus bacteria. The selective media was used
for the breeding of bacteria. This stage was conducted
to confirm that the growing bacteria on the media was
Vibrio alginolyticus. In this study, the addition of the
inoculum Vibrio alginolyticus was 5% (v/v) in each
reactors or it reached 300 mL/reactor. The
preparation of TCBS media was conducted by
dissolving of 22,.25 g of TCBS media in 250 mL of
sterile aquadest and then it was put in a 250 mL of
erlenmeyer. Around 8 g of NB was used for
preparation media. Before the media was dissolved
with the aquadest, the aquadest must be sterilized
using a autoclave (Hirayama, Japan). The media
dissolving was conducted using a stirring rod on a
heating stove until the media boiled. After that, the
media was poured into an aseptic sterile petri dish.
After the media thickened, the petri dish was turned,
then the media was stored in the refrigerator. The
regrowth of Vibrio alginolyticus was conducted by
inoculating those bacteria on a new TCBS media
using ose. All inoculation activities must be sterile by
working near the Bunsen and ose needles must also
always be sterile. After that, the inoculating media
was put in an incubator for 24 h at 37oC. After the
growing process, the bacteria was transferred into a
sterilized NB (Nutrient Broth) media (Merck, USA)
and put in the orbital shaker KIA Japan for 2 days to
get the OD value of 1. OD measurements were carried
out using a spectrophotometer GENESYSTM 30
Visible Thermo Scientific USA. Bacteria with an OD
value of 1 meant that it was ready to be poured into
the reactor.
2.2.2 Plant Preparation
This research used two species of mangrove:
Avicennia marina and Rhizophora mucronata. All
plants were collected from the mangrove nursery in
Wonorejo, Surabaya. The age of the plants was about
3 months old. The second stage was to prepare
mangrove plants by separating each type of mangrove
and then cleaning it by washing the sludge on the
roots. Before all plants were used for research, the
plants were acclimatized for 2 weeks to determine the
ability of plants to grow on the concentrate of saline
water to be used.
2.2.3 The Artificial Saline Preparation
This research was carried out by an experimental
method and by the observation of the mangrove
condition during the operation of reactor. The saline
water used in this study had an artificial salinity. The
artificial salinity was made using distillation water
and pro-analysis NaCl powder (Merck, USA). The
pro-analysis NaCl was dissolved in distilled water.
Around 5,370 g of pro-analysis NaCl was needed to
make a salinity of 20‰, and it needed 6,712.5 g to
make a salinity of 25 ‰.
2.2.4 Reactor Preparation
The reed bed reactors in this study was constructed
from fiberglass, measuring 70 x 50 x 40 cm.
Fiberglass is a strong and anti-rust material (Sunyoto
et al., 2016). There were 12 reactors: 4 reactors with
the addition of bacteria, 4 reactors without bacteria
and 4 reactors without plants as the control. The reed
bed system reactors were then arranged in a series
arrangement with a continuous water debit of 18
mL/minute. Preparation of reed bed system reactors
in series was carried out based on the zoning of
mangrove species growth ecosystems in nature.
Figure 1 and 2 describe the reed bed system reactor.
The code of each reactor:
- AMVA 25-RMVA 25:
Avicennia marina + Vibrio alginolyticus 25‰-
Rhizophora mucronata + Vibrio alginolyticus
25‰
- AM 25-RM 25:
Avicennia marina 25‰ - Rhizophora mucronata
25‰
- BK1 25 - BK2 25:
Control Reactor 1 25‰ - Control Reactor 2 25‰
- AMVA 20 - RMVA 20:
Avicennia marina + Vibrio alginolyticus20‰ -
Rhizophora mucronata + Vibrio alginolyticus
20‰
- AM 20 - RM 20:
Avicennia marina 20‰ - Rhizophora mucronata
20‰
- BK1 20 - BK2 20:
Control Reactor 120‰ - Control Reactor 2 20‰
senta 2019 - The International Conference on Marine Technology (SENTA)
32
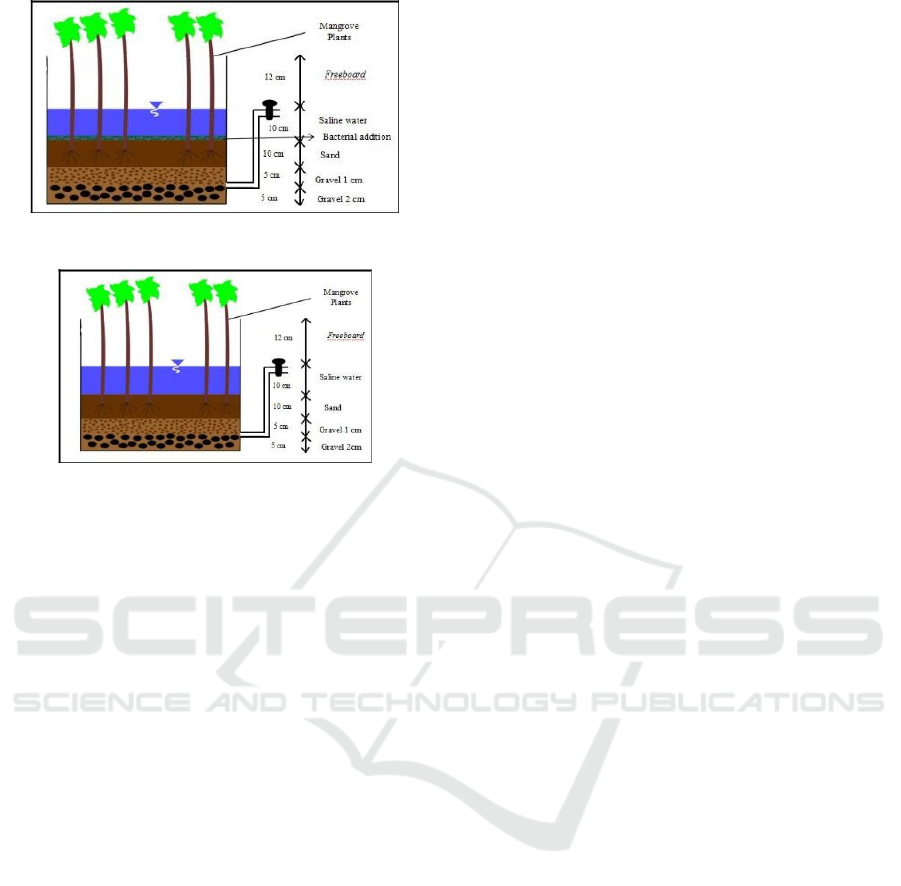
Figure 1: Reed bed system reactor with bacterial addition.
Figure 2: Reed bed system reactor without bacterial
addition.
The media composition of each reactor was as
follows: layer of gravel with a diameter of 2 cm and
a height of 5 cm. The second layer of gravel with a
diameter of 1 cm and a height 5 cm. The third layer
was fine sand with a height of 10 cm and artificial
saline water was put on the top of the filter media. The
height of the artificial saline water was 10 cm and
each reactor needed 33,5 L of the water.
Monitoring parameters also were measured.
Those parameters were pH and temperature. The pH
measurement was carried out using a portable pH
meter digital Senz pH Singapore. Temperature
measurement was conducted using OHAUS Starter
3100C Conductivity Bench USA.
The fresh weights (FW) and dry weights (DW)
were measured for each part of the sampled plants
(roots, stems, and leaves). The FW was conducted as
soon as possible after plants were cleaned using
tissue. All plant parts were put in an oven at 105°C
for 24 hours for the dry weight measurement. After
that, the total DW of all plants could be calculated.
The calculation of Plant Water Concentration
(PWC) was conducted by formula based on Penuelas
et al. (1997).
PW
C
= ((
F
W – DW) / DW) 100 (1)
Preliminary research conducted by acclimatizing
the test biota used in this study revealed that
mangroves were able to adapt to the conditions or
environmental media of the actual experiment and
that the plants were able to adjust to the conditions of
the media used in the study.
Physical observations of mangrove plants were
carried out during the acclimatization of mangrove
plants at salinity concentrations of 20‰ and 25‰.
Acclimatization was also aimed at making plants able
to adjust to the growing environment in the treatment
(Cahyani et al., 2016). Acclimatization results
obtained showed that Avicennia marina and
Rhizophora mucronata were able to grow well at
salinity concentrations of 20‰ and 25‰.
Based on observations made for 2 weeks, there
were no significant changes on Avicennia marina
plants. The leaves and the stems of plants showed
good conditions. This indicated that Avicennia marina
plants can survive at salinity concentrations of 20‰
and 25‰. The plant did not wilt during
acclimatization, however some leaves of Avicennia
marina showed discoloration at a concentration of
25‰ without bacteria addition.
Rhizophora mucronata plants were able to
survive in concentrations of 20‰ and 25‰, although
some withering leaves occurred. Accordint to Titah et
al (2018), the salinity concentration of 30‰ can be
toxic to Rhizophora mucronata.
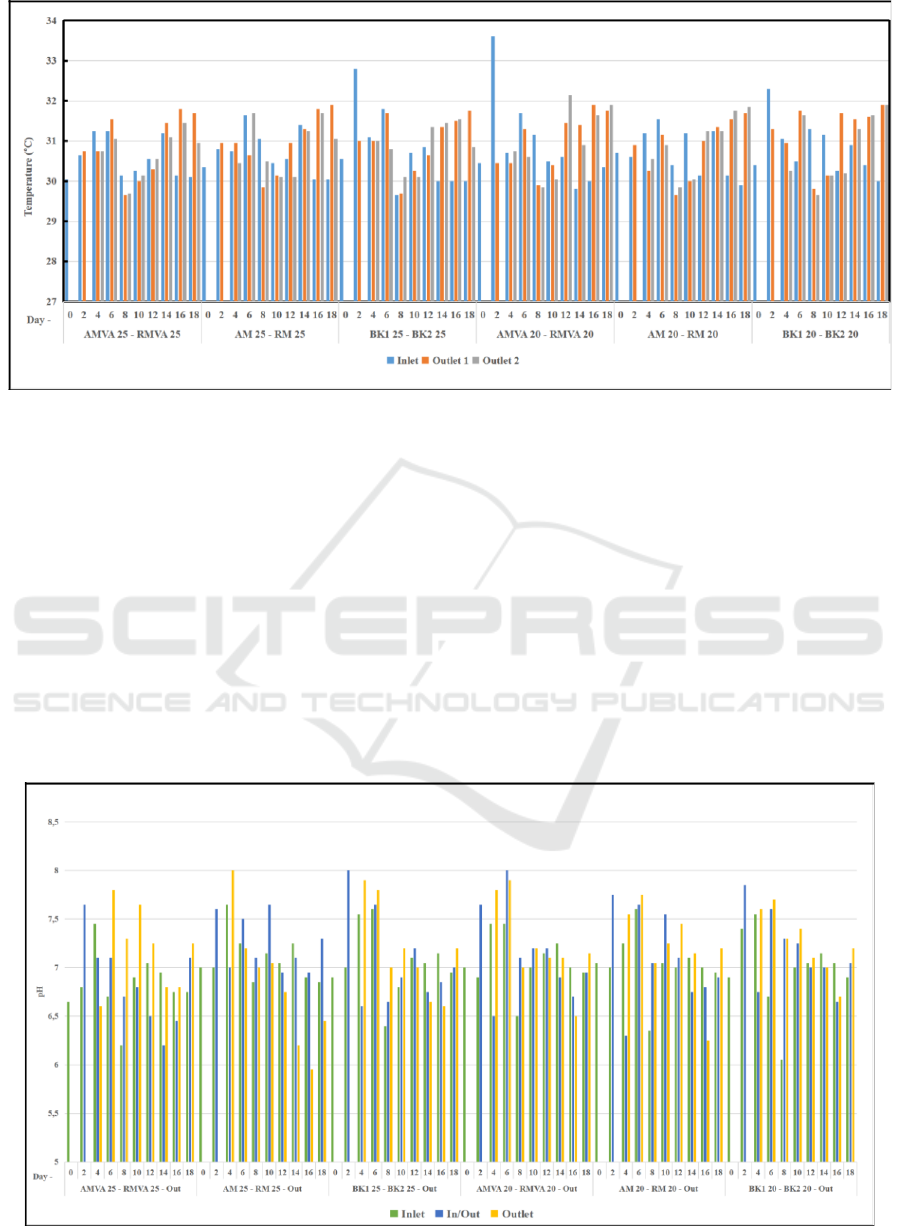
The range of saline temperature was 29
o
C - 32
o
C
(Figure 3). Mangrove and bacteria can live in this
range of temperature. Bacteria can survive, grow and
develop at certain temperature limits. Vibrio
alginolyticus can survive at optimum temperatures
between 30-35
o
C, while the bacteria cannot grow
below 4
o
C and above 45
o
C: Vibrio alginolyticus will
die at 55
o
C (Prajitno, 2005). During the experiment,
the temperatures of several reactors were similar
because the reactors were placed in same area and
sunlight reached all reactors. Measurement showed
that the water temperature was suitable for the growth
of the planted mangroves, especially for Rhizophora
sp. According to Saparinto (2007), mangrove species
Avicennia sp. grows well at temperatures between 18-
20ºC, Rhizophora sp., Ceriops sp., Excoecaria sp.,
Lumnitzera sp. at 26- 28ºC, and Bruguiera sp. at a
temperature 27ºC.
The Effect of Salinity on the Biomass of AVICENNIA MARINA and RHIZOPHORA MUCRONATE Grown at Reed Bed System Reactor
with Continuous Flow
33
3 RESULTS AND DISCUSSION
The parameter of pH is a measure of acidity or
basicity of a liquid. A normal pH is represented by the
value range of 6-8. The pH of water depends on the
type of the discharge of water (Fardiaz, 1993). The
value of pH at all reactors showed a neutral pH when
the reed bed reactor was run. Based on the data, the
average pH range was 5.8-8.1 (Figure 4). The pH
affected the growth rate of the bacteria. Each
organism has a different optimum pH ranges:
mangroves can survive at pH levels of 6-8.
Mangroves aged 36 months are more resistive to large
water pH range: older mangroves are known to have
greater tolerance for pH and salinity ranges because
they have a stronger root
system compared to younger
mangroves (Chrisyariati et al., 2014). The average pH
value range of this experiment was 6 to 8. This showed
that the pH level of the water was still in an acceptable
range for both the mangrove and the aquatic biota
growth. According to Koch (2001), pH level is closely
related to decomposer activity: the more acidic the
environment is for the decomposer, the slower the
decomposing process of inorganics. The slow process of
decomposition could greatly inhibit vegetation growth
Figure 3: Temperature measurement.
Fi
g
ure 4:
p
H measurement.
senta 2019 - The International Conference on Marine Technology (SENTA)
34
due to a lack of nutrient and mineral supply. In addition,
a pH value range of 6.0 to 6.5 can reduce the diversity
of plankton and benthic species (Effendi 2003).
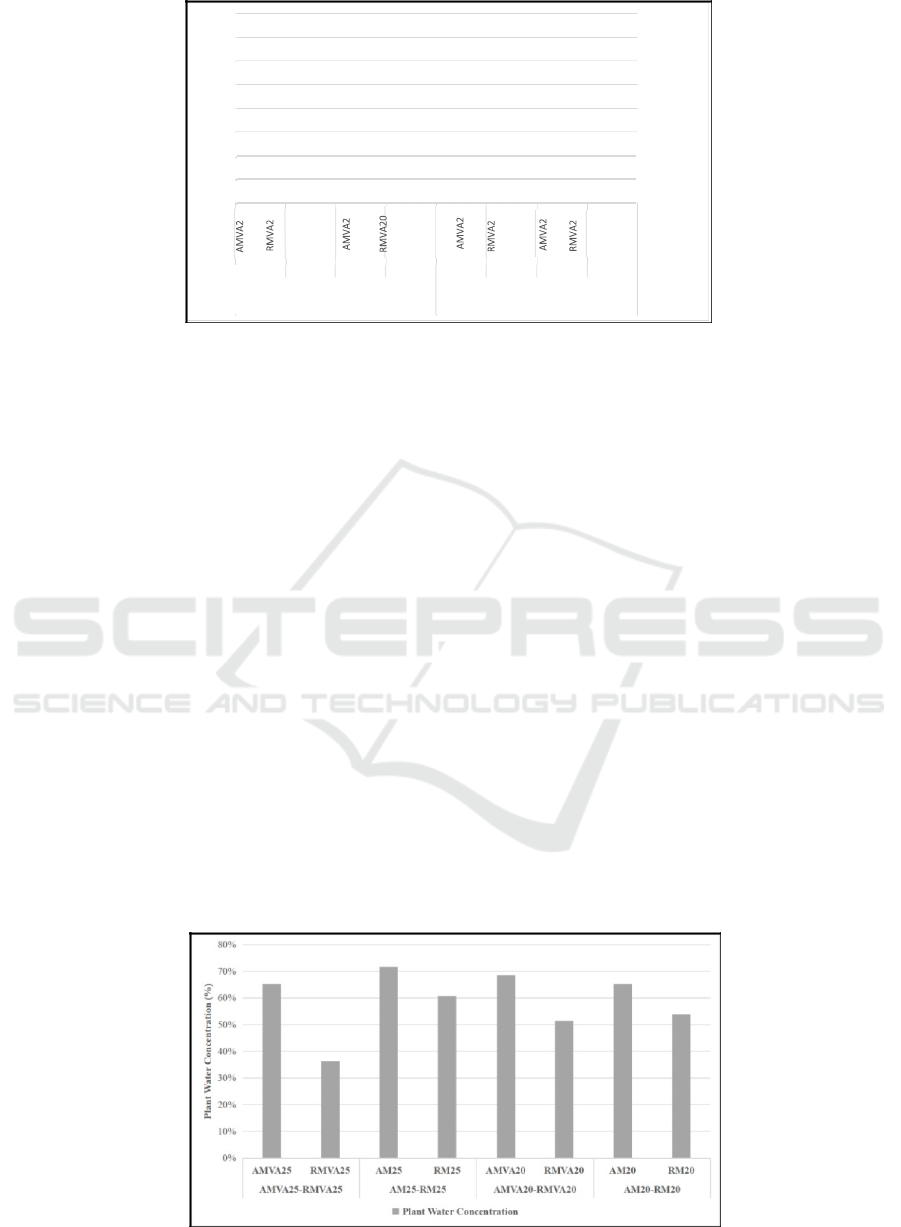
The results of the growth and development
process can be observed from the fresh weight and
dry weight. Plant fresh weight is the result of the
measurement of the fresh weight of plant biomass and
the total accumulation of material produced during
the growth. Therefore, the observation of fresh plant
weight and fresh weight is needed to determine the
plant biomass (Buntoro et al., 2014). Whereas dry
weight, according to Gardner et al (1991), is the result
of the net hoarding of CO
2
assimilation throughout the
growing season which reflects the accumulation of
organic compounds plants have successfully
synthesized from inorganic compounds, especially
water and CO
2
.
Figure 5 shows the FW and DW of Avicennia
marina and Rhizophora mucronata during the
operation of the reed bed reactor for 18 days in
salinity of 20‰ and 25‰. Based on the figure, the
FW and DW of Avicennia marina and Rhizophora
mucronata increased. It indicated that Avicennia
marina and Rhizophora mucronata can grow
normally during the operation of a reed bed reactor.
Avicennia marina plants with the addition of
Vibrio alginolyticus at a salinity concentration of
25‰ showed the highest of FW compared to other
plants on the last day of the experiment. The FW of
Avicennia marina was 69.26 g, and the DW was
24.03 g. This DW value of Avicennia marina is the
lowest of all plants used in this experiment:
Rhizophora mucronata plants, in the same conditions,
had the highest DW value of all plants with 34.16 g
of DW and an FW value of 53.8 g. The addition of
Vibrio alginolyticus is suspected to play a role in the
uptake of nutrients such as Na dan Cl ions. According
to Westrich et al. (2016), Vibrio bacteria does play a
key role in the cycling of the essential micronutrient
Fe.
This indicates that the absorption of salinity by
Rhizophora mucronata with the addition of Vibrio
alginolyticus bacteria is very good
.
Based on the
results of the FW and DW calculations, the rather
stable value of FW and DW would produce a stable
water content. Figure 6 shows that the FW and DW
Figure 5: FW and DW measurement.
Fi
g
ure 6: Plant wate
r
concentration.
80
70
60
50
Day‐ 0
0
AMVA25‐AM25‐AMVA20‐ AM20‐ AMVA25‐ AM25‐ AMVA20‐ AM20‐ RMVA25
RM25RMVA20 RM20RMVA25 RM25RMVA20 RM20
RM20
5
5
AM25
RM25
0
AM20
RM20
5
5
RM25
0
0
AM20
Weight(gram)
The Effect of Salinity on the Biomass of AVICENNIA MARINA and RHIZOPHORA MUCRONATE Grown at Reed Bed System Reactor
with Continuous Flow
35

values of Rhizophora mucronata plant with the
addition of Vibrio algionolyticus bacteria were not
different. It indicates that the water content in the
Rhizophora mucronata plant with the addition of
Vibrio algionolyticus bacteria were stable.
Based on the calculation of water plant
concentration (WTP), on the Figure 6 and Table 1, the
value of WTP in some reactors were in that range.
However, in the reactor with Rhizophora mucronata
and Vibrio alginolyticus at a salinity of 25‰, the
WTP value was 36%.
These results are in accordance with the best WTP
value for plants (50-70%). Based on the prior
definitions of plant growth, it can be considered that
there was growth as there was an increase in FW and
accumulation of DW. A good growth of mangrove
plants is shown by the increase in DW values
(Nurdin, 2008).
The difference in DW can be caused by the
number of leaves. The leaves are a place for the
accumulation of plant photosynthesis. An increase in
the process of photosynthesis can also increase the
result of photosynthesis. The increase of
photosynthesis activity can increase the amount of
organic compounds in plant. The organic compound
could then be transported to all plant organs and affect
the dry weight of plants.
4 CONCLUSIONS
Based on the results, the level of salinity affects the
growth rate of mangrove plants. Based on the
calculation of FW and DW values, the FW of
Avicennia marina with the addition of Vibrio
alginolyticus bacteria in a salinity concentration level
of 25‰ was 69.27 g, which is highest FW value of all
other plants. The highest value of DW was obtained
in the Rhizophora mucronata plant with the addition
of Vibrio alginolyticus in a salinity concentration of
25‰, reaching 34.16 g. The Rhizophora mucronata
plant with the addition of Vibrio alginolyticus bacteria
in a salinity concentration of 25‰ had the most stable
water content value with an FW value of 53.8 g and
DW of 34.16 g, resulting in a water content value of
57.46%. In conclusion, concentration of salinity and
the addition of Vibrio alginolyticus can affect the
FW and DW of mangrove plants in a reed bed system
reactor with continous flow.
The results showed that all two mangrove
species are highly salt tolerant and can survive in
brackish water and perhaps even higher salinity
although all the studied species were under
rehabilitation condition in a mangrove conservation
center. Avicennia marina had the best tolerance to
highly saline conditions since this species maintains
very negative water potential under saline conditions.
We hope that our research will provide the
necessary groundwork for further researches, for
example in the are of bio desalination with mangrove
in reed bed system reactor with or without bacterial
addition with continuous flow.
ACKNOWLEDGEMENTS
The author would like to thank Kemenristek DIKTI
(Ministry of Research, Technology and Higher
Education, Republic of Indonesia) for the funding of
this research through the Penelitian Dasar Unggulan
Perguruan Tinggi – second year research, PDUPT
2019 scheme (Contract 5/ E1/KP.PTNBH/2019 and
No. 920/PKS/ITS/2019).
REFERENCES
Alongi, D.M.,2011. Early Growth Responses of Mangroves
to Different Rates of Nitrogen and Phosphorus Supply.
Journal of Experimental Marine Biology and Ecology.
397(2):85-93.
Anantluikrishnan, T.N., 1982. Bioresources
Ecology.Oxford & IBH, New Delhi.
Basyuni, M., Oku, H., Tsujimoto, E., Kinjo, K., Baba, S.
and Takara, K., 2007. Triterpene synthases from the
Table 1: Plant water concentration calculation (Day – 18).
Fresh Weight Dry Weight
Plant Water
Concentration
AMVA25- AMVA25 69.27 24.03 65%
RMVA25 RMVA25 53.8 34.17 36%
AM25-RM25
AM25 44.1 12.53 72%
RM25 52.7 20.67 61%
AMVA20- AMVA20 55.57 17.4 69%
RMVA20 RMVA20 53.9 26.17 51%
AM20-RM20
AM20 39.23 13.6 65%
RM20 52.07 24.02 54%
senta 2019 - The International Conference on Marine Technology (SENTA)
36

Okinawan mangrove tribe,Rhizophoraceae. FEBS
Journal. 274:5028–5042.
Bengen, D. G., 2003. Pedoman Teknis Pengenalan dan
Pengelolaan Ekosistem Mangrove. Pusat Kajian
Pesisir dan Lautan, Institut Pertanian Bogor. Bogor.
Buntoro, B. H., Rogomulyo, R. dan Trisnowati, S., 2014.
Pengaruh Takaran Pupuk Kandang dan Intensitas
Cahaya Terhadap Pertumbuhan dan Hasil Temu Putih
(Curcuma zedoaria L.). Vegetalika 3(4):29-39.
Cahyani, M., Andarani, P. and Zaman, B., 2016. Penurunan
Konsentrasi Nikel (Ni) Total dan COD Menggunakan
Tumbuhan Kayu Apu (Pistia stratiotes L.) Pada Limbah
Cair Elektroplating. 5(4):1-9.
Chimayati, R.L. and Titah, H.S., 2019. Removal of Salinity
using Interaction Mangrove Plants and Bacteria in
Batch Reed Bed System Reactor. Journal of Ecological
Engineering, 20(4):84–93.
Chrisyariati, I., Hendrarto, B and Suryanti, 2014.
Kandungan Nitorgen Total dan Fosfat Sedimen
Mangrove Pada Umur yang Berbeda di Lingkungan
Pertambakan Mangunharjo, Semarang. Diponegoro
Journal of Maquares Management of Aquatic
Resources. 3(3):65-72.
Clough, B. F., 1984. Growth and salt balance of the
mangroves Avicennia marina (Forsk) Vierh. And
Rhizophora sty/osa Griff. in relation to salinitity. Aust.
J. Plant Physiol., 11:419–430.
Effendi, H., 2003. Telaah kualitas air.
Kanisius.
Yogyakarta.
Fardiaz, S., 1992. Polusi Air Dan Udara. PT Kanisius.
Yogjakarta.
Fitzgerald, M. A., Orlovich, D. A. and Allaway, W. G.,
1992. Evidence that abaxial leaf glands are the sites of
salt secretion inleaves of the mangrove Avicennia
marina (Forsk.) Vierh. New Phytol. 120:1–7.
Flowers, T. J.and Colmer T. D., 2008.Salinitytolerancein
halophytes.NewPhytologist. 179:945–963.
Flowers, T. J., Troke, P. F. and Yeo, A. R., 1977. The
mechanism of salt tolerance in halophytes. Ann. Rev.
Plant Physiol., 28:89–121.
Gardner, F. P., Pearce, R. B. and Mitchell, R. L., 1991.
Physiology of Crop Plants (Fisiologi Tanaman
Budidaya, alih bahasa Herawati Susilo). UI Press.
Jakarta.
Hegemeyer, J., 1997. Salt.In:Prasad, Plant Eco physiology.
John Wiley & Sons Inc. New York.
Indriyanto, 2006. Ekologi Hutan. Bumi Aksara. Jakarta.
Kolinug, K. H., Langi, M. A., Ratag, S. P. and
Nurmawan, W., 2014. Zonasi Tumbuhan Utama
Penyusun Mangrove Berdasarkan Tingkat Salinitas Air
Laut di Desa Teling Kecamatan Tombariri. Peronema
Forestry Science Journal. 5(4):1-9.
Kurniawan, S. B., Purwanti, I. F. Titah, H. S., 2018. The
Effect of pH and Aluminium to Bacteria Isolated from
Aluminium Recycling Industry. Journal of Ecological
Engineering. 19(3):154–161.
Kustanti, A., 2011. Manajemen Hutan Mangrove. IPB
Press. Bogor.
Kusumiyati, Onggo, T. M. and Habibah, F. A., 2017.
Pengaruh Konsentrasi Larutan Garam NaCl Terhadap
Pertumbuhan dan Kualitas Bibit Lima Kultivar
Asparagus. J. Hort. 27(1):79-86.
Marsha, N. D., Aini, N. and Sumarni, T., 2014. Pengaruh
Frekuensi dan Volume Pemberian Air Pada
Pertumbuhan Tanaman Crotalaria mucronataDesv..
Jurnal Produksi Tanaman, 2(8):673 –678.
Naidoo, G., 1987. Effects of salinity and nitrogen on growth
and plant water relations in the mangrove Avicennia
marina (Forssk.) Vierh. New Phytol. 107:317–32.
Noor, R. Y. M., Khazali, I. N. N. and Suryodiputro, 2006.
Panduan pengenalan mangrove di Indonesia. PKA/WI-
IP. Bogor.
Nurdin, Maspeke, P., Ilahude, Z., Zakaria, F., 2008.
Pertumbuhan dan Hasil Jagung yang Dipupuk N, P dan
K pada Tanah Vertisol Isimu Utara Kabupaten
Gorontalo. J Tanah Trop. 14(1):49- 56.
Popp, M., 1984. Chemical composition of Australian
mangroves. Pflanzenphysiol. 113:395–409.
Popp, M., 1994. Salt resistance in herbaceous halophytes
and mangroves. In: Dietmar, H., Luttge, U., Esser, K.,
Kaderelt, J.W. and Runge, M. (eds.), Progress in
Botany. Springer Verlag. Berlin.
Prajitno, A., 2005. The Sensitivity Test Of Flavonoid, of
Eucheuma cottoni With Different Concentration as
Vibrio harveyi. By In. Jurnal Protein.
Prayunita, Basyuni, M. and Agustina, L., 2012. Respon
Pertumbuhan dan Biomassa Semai Rhizopora apiculata
BI Terhadap Salinitas dan Kandungan Lipidanya pada
Tingkat Pohon. Peronema Forestry Science Journal.
1(1):7-16.
Purwanti, I, F., Anjasmara I, R. and Suharmadi, 2006.
Groundwater salinity modeling in East Surabaya.
Proceedings of the National Seminar on Technology
Management III. Department of Environmental
Engineering, ITS, Surabaya.
Salisbury, F.B and Ross, C. W., 1995 Fisiologi Tumbuhan.
Jilid I. ITB. Bandung.
Saparinto, C., 2007. Pendayagunaan Ekosistem mangrove.
Dahara Prize. Semarang.
Scholander, P. F., H.T. Hammel, Hemmingsen, E. and
Carey, 1962. Salt balance in mangroves. Plant Physiol.
37:722–729.
Sulastri, 2018. Induksi Toleransi Sistemik terhadap
Cekaman Salinitas oleh Bakteri Asal Tumbuhan
Pesisir Jawa pada Tanaman Padi. Institut Pertanian
Bogor. Bogor.
Syakir, M., Maslahah, N. and Januwati, M., 2008. Pengaruh
Salinitas Terhadap Pertumbuhan, Produksi da Mutu
Sambiloto (Andrographis paniculata Nees). Bul. Littro.
19(2):129-137.
The Effect of Salinity on the Biomass of AVICENNIA MARINA and RHIZOPHORA MUCRONATE Grown at Reed Bed System Reactor
with Continuous Flow
37
