
Lane Meters Correlation Analysis towards the Main Dimensions of
Ro-ro Ships under 2000 GT
Bagus Gelis Pratama Putra
1,a
, Wasis Dwi Aryawan and Aries Sulisetyono
1
Department of Naval Architecture, Institut Teknologi Sepuluh Nopember, Indonesia
Keywords: Ferry Ro-Ro, Gross Tonnage, Lane Meter, Pearson Correlation, Regression.
Abstract: The size of ro-ro ships in Indonesia was clustered based on Gross Tonnage (GT). Other units, Lane Meter
(LM) can better describe the possible condition of vehicle loads on ships. LM naturally represents the
combined length of the entire lane in meters that can be used to load vehicles. This study aims to discover the
correlation between the value of LM and GT on ro-ro ships' main dimensions. It proposes mathematical
models that can properly estimate the LOA, LPP, and B of the ro-ro ship using LM as an input value. To
measure the value of LM, this study used 94 ro-ro ships with sizes below 2000 GT and 90 m length.
Correlation test was done through Pearson correlation method by performing several linear regression and
ANOVA tests. LM provides a better correlation than GT on LOA, LPP, and B with a correlation value (r) ≥
0.75. Visible results of the linear regression of LM properly showed strong determinant value, with value of
R Square ≥ 0.75. Meanwhile standard ANOVA tests of LM performed on LOA, LPP, and B positively have
significance values (sig. ≤ 0.05).
1 INTRODUCTION
Size of Ro-ro ships in Indonesia was clustered with
Gross Tonnage or GT. Gross tonnage is the
calculation of the volume of all space located below
the deck of the ship. It includes the volume of the
enclosed space located above the deck with the
contents of the room along with all the enclosed
spaces located above the top deck (superstructure). In
fact, there is other unit better describe the condition
of vehicle loads on ro-ro vessels rarely used in
Indonesia, namely, Lane Meter. Lane Meter (LM) is
a unit deck area for ro-ro ships in which one lane is
represented by a width of 2 meters and a length of 1
meter (ibiblio, 2008). Moreover, lane meter describes
the deck areas on a particular ship used for vehicle
placement. Therefore, it is important to estimate the
loading capacity of the ship, particularly in initial
stage.
In ship design process, the initial stage is very
critical because the design of a particular ship has to
meet certain requirements. Ordinarily, the ship design
process is carried out to follow in a spiral design
process consisting of several stages, namely, Concept
Design, Preliminary Design, Contract Design, and
Detail Design (Watson, 1998). At Concept Design
stage, the main ship size components like length
between two perpendiculars (LPP), breadth (B),
draught (T), and height (H) are determined. In the
process of determining the ship particular, ship owner
requirements are used to identify load specifications.
Besides GT, a measurement in LM can be used to
start the design process. In this study, Lane Meter
measurements will be based on ships operating in
Indonesian waters and will be correlated with the
particular of the ship. This will shorten the spiral
design process.
2 RESEARCH DESCRIPTION
This study aims to determine the correlation between
the value of GT and LM on ro-ro ships to ship main
dimensions in order to obtain mathematical models
that correlates with the value of LM. The theoretical
benefit of this research is to give an alternative
mathematical model for determining the size of ro-ro
ships under 2000 GT and 90 m. The practical benefit
of this research for naval architects is to shorten the
design process in determining the main size the ships
under study.
Putra, B., Aryawan, W. and Sulisetyono, A.
Lane Meters Correlation Analysis towards the Main Dimensions of Ro-ro Ships under 2000 GT.
DOI: 10.5220/0010864100003261
In Proceedings of the 4th International Conference on Marine Technology (senta 2019) - Transforming Maritime Technology for Fair and Sustainable Development in the Era of Industrial
Revolution 4.0, pages 141-147
ISBN: 978-989-758-557-9; ISSN: 2795-4579
Copyright
c
2022 by SCITEPRESS – Science and Technology Publications, Lda. All rights reserved
141

This research was carried out under the following
procedures:
2.1 Literature Review
2.1.1 Cargo Mass Unit
At the beginning of the design process, a ship is
always delivered about the original purpose of
shipbuilding. As a means of transportation, ships are
intended to transport several goods frequently
referred to as cargo. In most cases, cargo can be
defined as goods transported by a means of
transportation for commercial purposes. There are
many forms of cargo, ranging from bulk, dry bulk,
containers, or even something in units. In addition,
the cargo itself is divided into several units that have
been agreed globally. The cargo mass units
commonly used on ships can be stated as follows
(Marine Environment Protection Committee, 2009):
• For dry cargo carriers, liquid tankers, gas tankers,
ro-ro cargo ships and general cargo ships, the
units of cargo transported are using metric tons (t);
• For container ships that only handle containers,
they must use the number of containers (TEU) or
metric tons (t) of the combined mass of the cargo
and containers;
• For ships carrying a combination of containers
and other loads, a 10 t TEU mass can be used to
load TEUs with payloads and 2 t for TEUs with
empty loads; and
• For passenger ships, including ro-ro passenger
ships, must employ the number of passengers or
gross tonnage of the ship (GT);
In some cases, the mass unit of cargo used can be
stated as follows:
• For car ferries and car carriers, must employ the
number of car units or lane meters occupied;
• For containers, total TEU (empty or full.); and
• For railroad carriers and ro-ro vessels, the number
of carriages and vehicles carried, or lane meters
occupied.
2.1.2 Gross Tonnage
Gross tonnage is the calculation of the volume of all
space located below the deck of the ship plus the
volume of the enclosed space located above the deck
with the contents of the room along with all the
enclosed spaces located above the top deck
(superstructure). Gross tonnage is expressed in tons,
which represent a unit volume of 100 cubic feet,
which is equivalent to 2.83 cubic meters (IMO, 1969).
In its application to the Ro-Ro Ferry, the GT is
used to express the unit size of the Ro-Ro ship.
Following KM 53 of 2002 (Menteri Perhubungan
R.I., 2002), the Ferry port classification is divided
into 3 (three) classes based on the vessel GT capacity.
At Class-I Ferry Port, the dock used to accommodate
ships with a size above 1000 GT. Class-II Ferry Port,
the pier used to accommodate ships with capacities
ranging from 500 GT to 1000 GT. Whereas at Class-
III Ferry Port, the dock used to accommodate ships
with a capacity of under 500 GT.
As part of the size of the Ro-Ro ferry, the value of
the gross tonnage of the ship does not represent the
exact dimensions of the ship. Based on data obtained
in 2012 in previous studies (Asri, 2016), several ships
with larger main sizes have smaller gross tonnage
than other smaller vessels. And also explained that
there are some ships with the same main dimensions
but have different tonnage. It is because the value of
gross tonnage itself is a function of closed space.
Whereas every ship with the same main dimensions
could have various enclosed spaces so that might
produce different gross tonnage calculations. On the
other hand, gross tonnage more represents the
capacity of the loaded passenger space.
2.1.3 Lane Meter
In addition to using the gross tonnage units (GT) the
vehicle carrier equally has other capacity units. Ro-
Ro cargo ships are usually measured using lane
meters (Wathne, 2012). Lane meter represents a
method of measuring Ro-Ro ship space capacity
where each unit of space (linear meter) represented by
a deck area with a length of 1.0-meter and width of
2.0 meters (IFA, 2006).
Typically, ro-ro ships occupied a loading space to
transport vehicle which typically arranged lengthwise
on the deck. The placement of vehicles on this ship was
divided into several loading lanes. As explained
before, the Lane Meter (LM) unit is described as a deck
area of one lane with a width of two meters and one
meter long, or the equivalent of 2 square meters
(21,528 square feet). Practically, the LM unit
represents the combined length of the entire lane in
meters that can use to load vehicles on ro-ro ships. In
its application, the size of a conventional car in Europe
will require an area of six LM, and for European semi-
trailer trucks require an area of 18 LM.
The strength of the lane meter is it typically
reflects the number of vehicles that can be properly
loaded on the car deck. By using a lane meter,
whatever the length of the vehicle can be equalized
by managing this unit. Which represents the overall
length of the lane on the ship that can accommodate
vehicles on the deck. When synchronized, it can
properly explains that by using functional capacity of
senta 2019 - The International Conference on Marine Technology (SENTA)
142

100 LM, the ship can transport a possible total of 20
operational units of Gol IV vehicles with a length of
5 meters . It can transport 10 Gol V Trucks with a
length of 7 meters and 6 privates Gol IV vehicles.
Compared to the Gross Tonnage unit with a value of
300 GT, the number of vehicles that can be loaded by
the ship could not be precisely ascertained. So far, the
practitioners only have predicted based on their
intuition by comparing with the size of the ship they
knew.
Disadvantages of lane meter unit is that the
remaining unit of weight is unable to represent the
payload directly. The definition of this unit,
nevertheless, followed by some debates in practice.
Although by definition it is known that the width of
the lane referred to in the lane meter is two meters,
but in practice, some vehicle types occupy a width of
more than two meters.
In terms of loading on ships in Indonesia, the
loading of vehicles on ships has been regulated in the
Technical Guidelines for Minimum Service
Requirements for River, Lake, and Crossing Vessels
(Direktorat Jenderal Perhubungan Darat, 1994). The
regulation stipulates that the distance between
vehicles when loading on board is 0.6 m (600 mm).
While the distance of the vehicle to the ship's wall is
0.6 m (600 mm). Concerning the description of the
LM unit, which occupies a width of two meters and
the ministerial regulation. It can be equalized that one
lane of vehicles on a ship provides a width of 2.6 m
with an additional 0.3 m per side. So that the
arrangement of vehicle lanes by implementing these
requirements represents the preparation of LM values
on the deck of the vehicle and accommodate
variations in the width of the vehicle that is on the
ship.
2.1.4 Present Ship Sizing by Lane Meter
Determination of the main dimensions of a ro-ro ferry
boat using input lane meter values has been done
before (Kristensen, 2006). This study utilized data
from ro-ro vessels of 500 to 3500 LM. Using
statistical analysis, a mathematical model was
obtained. It shows the correlation between LPP and
LM that is defined by the equation:
Lpp = 110 + (LM −1000) / 25
(1)
Where:
Lpp : Length between perpendicular
LM : Lane meter
The subsequent research was conducted again
(Kristensen, Analysis of technical data of Ro-Ro
ships, 2016), with discussions focused on Ro-Ro
ships. The data in the study were widely analysed
based on various parameters that have been collected
and examined to develop a formula for the systematic
calculation of technical data on Ro-Ro cargo ships.
So we obtain 2 (two) conditions stated in the
following equation:
𝐿𝑝𝑝 20.4𝐿𝑀
.
for LM < 1.402
(2)
and
𝐿𝑝𝑝 11.18𝐿𝑀
.
, LM ≥ 1.402
(3)
The other variables can be obtained using the
followings:
𝐵 5.49𝐿𝑀
.
(4)
𝑇 1.9𝐿𝑀
.
, LM < 2.000
(5)
𝑇 5.81 0.0003𝐿𝑀, LM ≥ 2.000
(6)
𝐷 0.00172𝐿𝑀 11.42 (7)
Based on data displayed by (Kristensen, 2016),
the length of the ship shown has an average LPP size
above 100 m. The determination of the equation for
ships with LPP size below 100 m needs to be
reviewed mathematically.
Based on data showed in Table 1, the
mathematical model presented, has a relatively
significant deviation compared to the initial value.
With an average difference of 97% and 68% of the
genuine value. Typically, there is an improvement
that occurs between the equations defined by
Kristensen from equation (1) to equation (2), where
the difference gets closer. For this reason, it is
necessary to make adjustments to ships in Indonesian
waters.
Table 1: Comparison of Krinstensen's LPP calculations with the reality.
Ro-Ro GT LM LPP (Real) LPP (2-1) Dev (2-1) LPP (2-2) Dev (2-2)
A
288 50 33,50 72,00 215% 56,19 168%
B
560 90 40,15 73,60 183% 65,43 163%
C
634 126 41,35 75,04 181% 71,39 173%
D
1120 137 50,50 75,48 149% 72,95 144%
E
284 44 28,32 71,76 253% 54,36 192%
197% 168%
Lane Meters Correlation Analysis towards the Main Dimensions of Ro-ro Ships under 2000 GT
143
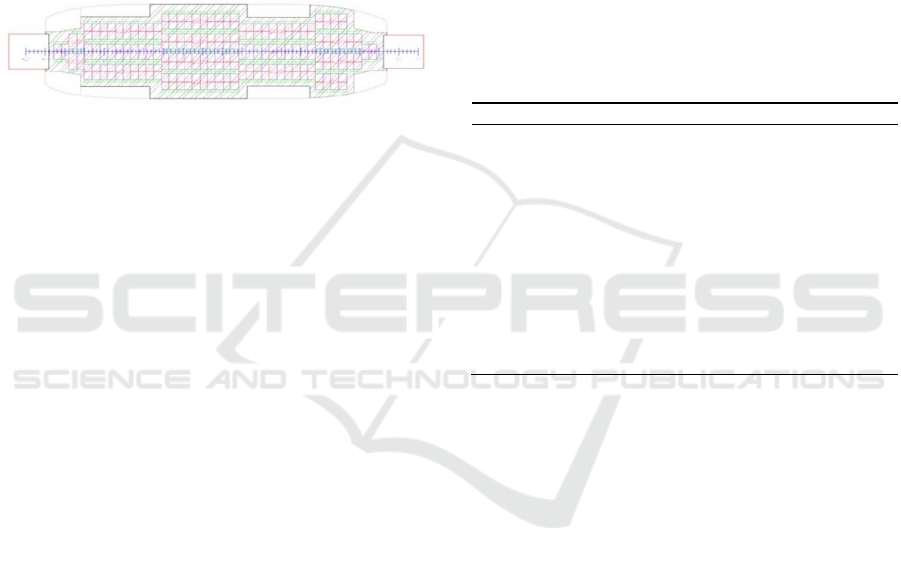
2.2 Lane Meter Variable Measurement
At the beginning of this study, the value of LM was
unknown. Therefore, it is necessary to measure it
first. To measure the value of LM, this study used 94
ro- ro ships with sizes below 2000 GT and 90 m
length. Lane Meter (LM) measurements are obtained
by re- sketching the car deck arrangement based on
the general arrangement drawings or similar that have
been collected previously. LM measurements are
adjusted according to the description in 2.1.3. In the
shown one of the LM measurement values that will
be used as variables in this study.
Figure 1: KMP Kormomolin 884 GT 77 LM.
2.3 Correlation Test
Correlation coefficient is a statistical measurement of
covariance or association between two variables. The
value of the correlation coefficient has a range
between +1 and -1. The correlation coefficient shows
the strength of the linear relationship and the direction
of the relationship of two random variables. If the
correlation coefficient is positive, then the two
variables has a direct relationship.
2.4 Linear Regression Analysis
Regression analysis explores the relationship
between one or more variables/independent variables
(X) with one dependent variable (Y). A form of
relationship related to response (Y) and regressor (X)
represents a linear relationship, which can be written
as follows (Walpole, 2012):
𝑌ab𝑥
(8)
Here, (a) is called intercept and (b) is the direction
coefficient or beta coefficient.
3 DATA ANALYSIS
3.1 LM and GT Correlation Test
In this study, the correlation value (r) was obtained
using Pearson's Correlation theory. Correlation
calculations performed on LM as an independent
variable on many dependent variables included in the
main dimensions of the ship. The dependent variable
considered to be determined in this study. The value
is GT, LOA, LPP, B, T, H, L/B, L/T, B/T, and
Payload. Several correlation tests were also carried
out on the dependent variables. There are LM, LOA,
LPP, B, T, H, L/B, L/T, B/T, and Payload, using GT
as an independent variable. From this process, we will
determine which variables are correlated with LM
values. Correlation value has a range starting from the
value of "zero" which means there is no correlation at
all. The correlation value of "one" means it has a
perfect correlation value. Performed by statistical
correlation calculations, the correlation results
obtained were shown in Table 2.
Table 2 explains that the Lane Meter variable
provides a direct correlation to the variables GT,
LOA, LPP and B on ro-ro ships, compared between
the dependent variables between LM and GT. It could
be concluded that LM provides a more exact
correlation than GT on LOA, LPP, B, L/B and
Payload values. The T and H values better correlated
to the GT variable than LM.
3.3 Regression Modeling
3.3.1 Regression Model of GT
Linear regression analysis is used to find out how
much effect the gross tonnage value (GT) has on Lane
Mater (LM) and obtain its mathematical model.
Based on the model, it is recognized that the value of
the coefficient of determination R square = 0.825. It
shows that the effect of the Lane Meter (LM) on gross
tonnage (GT) is 82.5%. Based on the ANOVA test,
results obtained showed significance value of 0.000
(< 0.05), thus resulting regression model can be used
to predict the variable GT. The coefficient calculation
Table 2: Correlation Test Results.
Correlation LM GT
LM
-
0,884
GT 0,884
-
LOA 0,912 0,845
LPP 0,914 0,847
B 0,874 0,817
T 0,726 0,737
H 0,713 0,723
L/B 0,525 0,487
L/T 0,416 0,297
T/H 0,392 0,393
B/T -0,051 -0,139
Pa
y
load (ton) 0,651 0,624
senta 2019 - The International Conference on Marine Technology (SENTA)
144

results explained a constant value of -31,382 while
the Lane Meter value (regression coefficient) of 6,034
so that the regression equation can be written with:
𝐺𝑇 31,382 6,034 𝐿𝑀
(9)
Based on the results of tests conducted, it can be
concluded that Lane Mater (LM) affects GT value.
The resulting regression equation can described by
following Figure 2.
Figure 2: Regression of LM – GT.
3.3.2 Regression Model of LOA
Linear regression analysis is used to find out how the
value of the overall length of the ship (LOA) has a
significance effect towards the lane meter (LM) in
order to obtain the mathematical model. Based on the
model performed, it was recognized that the value of
the coefficient of determination R square = 0.832,
which shows that the effect of the Lane Meter (LM)
on the overall length of the ship (LOA) of 83.2%.
Based on the ANOVA test, results obtained a
significance value of 0,000 (< 0.05), then the resulting
regression model can be used to predict LOA
variables. The coefficient calculation results
indicated a constant value of 22,632 while the lane
meter value (regression coefficient) of 0.223 so that
the regression equation can written by:
𝐿𝑂𝐴 22,632 0.223 𝐿𝑀
(10)
Based on the results of tests conducted, it can be
concluded that Lane Meter (LM) affects the LOA.
The following regression equation can be described
by Figure 3.
Figure 3: Regression of LM – LOA.
3.3.3 Regression Model of LPP
Linear regression analysis was used to find out how
much effect the length of the ship's vertical line (LPP)
on the lane meter (LM) and obtain the mathematical
model. Based on the model performed, it could be
recognized that the value of the coefficient of
determination R Square = 0.835. It shows the effect
of LM on LPP is 83.5%. Based on the ANOVA test,
results obtained a significance value of 0.000 (<
0.05), therefore the resulting regression model can be
used to predict LPP variables. The result of the
coefficient calculation shows the constant value is at
20,039 while the Lane Meter value (regression
coefficient) is at 0.197 so that the regression equation
can be written with:
𝐿𝑃𝑃 20,039 0.197 𝐿𝑀
(11)
Based on the results of tests conducted, it
concluded that Lane Mater (LM) affects LPP. The
resulting regression equation can be described with
the following by Figure 4.
Figure 4: Regression of LM – LPP.
3.3.4 Regression Model of B
Linear regression analysis was also used to find out
how much effect the value of the width of the ship (B)
Lane Meters Correlation Analysis towards the Main Dimensions of Ro-ro Ships under 2000 GT
145

on the lane meter (LM) and obtain a mathematical
model. Based on the model, it could be recognized
that the value of the coefficient of determination R
Square = 0.764. It shows that the effect of the
independent variable in the form of lane meter (LM)
to the dependent variable (B) attends 76.4%. Based
on the ANOVA test results obtained a significance
value of 0,000 (< 0.05), therefore resulting regression
model can be used to predict B variables. The
coefficient calculation result shows the constant's
value of 7,698 while the lane meter value (regression
coefficient) of 0.038 so that the regression equation
can written by:
𝐵 7,698 0.038 𝐿𝑀
(12)
Based on the results of the tests conducted, it can
be inferred that Lane Mater (LM) affects B. The
resulting regression equation can be described by the
following Figure 5.
Figure 5: Regression of LM-B.
3.4 Model Comparison
In order to find out the accuracy of mathematical
models, a comparison must be performed between the
real LPP variable values and the LPP calculations.
LPP calculations was obtained by using the equation
(11). Using the compared result in Table 2, it was
inferred that the LPP value produced provided quite a
considerable accuracy with a difference of 3% for the
sample ship. When compared with the equations (1)
and (2) in Table 1 the value is already more
representative of the initial value.
The variable B was also compared between the
value of the real variable B and the B calculation. The
B calculations are obtained by using the equation (4)
and the equation (12). From the results in Table 3. It
could be seen that the value of B produced provided
quite a precise accuracy with a difference of 1% for
the sample ship. When compared to the equation (4)
with a difference of 15%, the value produced by (12)
is much closer to the initial value.
4 CONCLUSION
1. Based on the results of the correlation test, Lane
Meter provides a very strong correlation to the
variables GT, LOA, LPP and B on ro-ro ships.
Where the value of each of these variables is GT:
0.884, LOA: 0.912, LPP: 0.914, B: 0.874.
2. Based on the results of the correlation test, LM
values provide a more exact correlation than GT
on LOA, LPP, B, L/B and Payload variables on
the main size of ro-ro vessels.
3. For a very strong correlation, a mathematical
model is adopted to estimate the ferry ro-ro with a
size below 2000 GT and a length below 90 m:
LM against GT
𝐺𝑇 31,382 6,034 𝐿𝑀, R
2
0.825
LM against LOA
𝐿𝑂𝐴 22,632 0.223 𝐿𝑀, R
2
0.832
LM to LPP
𝐿𝑃𝑃 20,039 0.197 𝐿𝑀, R
2
0.835
LM against LPP
𝐵 7,698 0.038 𝐿𝑀, R
2
0.764
Table 2: Comparison model (11) to real LPP.
Ro-Ro GT LM LPP (Real) LPP (11) Dev (11)
A
288 50 33,50 29,89 89%
B 560 91 40,15 37,97 95%
C 634 126 41,35 44,86 108%
D
1.120 137 50,50 47,03 93%
E 284 44 28,32 28,71 101%
97%
Table 3: Comparison model (4) and (12) to real B.
Ro-ro GT LM
B
(Real) B (4) Dev(4) B (12) Dev (12)
A
288 50 9,50 11,64 122% 9,60 101%
B
560 91 12,00 13,05 109% 11,16 93%
C
634 126 12,00 13,89 116% 12,49 104%
D
1120 137 14,00 14,12 101% 12,90 92%
E
284 44 9,00 11,35 126% 9,37 104%
115% 99%
senta 2019 - The International Conference on Marine Technology (SENTA)
146

4. Based on model comparison, this model
representation was closer to the initial value of ro-
ro ships than the present model.
5. In determining T and H values, another approach
which is more correlated than the Lane Meter was
needed.
As stated above, this research is in accordance
with the results of this study. The result equations in
this study represents more about the size of ro-ro
ships in Indonesia compared to previous studies.
For upcoming studies, the correlation between the
LM and the main dimensions of the ro-ro ship above
2000 GT could be more analysed. After obtaining the
main dimensions of the ro-ro ship, further analysis on
the relationship between the LM and the weight of the
ship can be carried out. This is considered very
helpful for the ship design process. After obtaining
the main size and the weight of the ro-ro ship, the
construction costs can be estimated.
ACKNOWLEDGEMENT
The authors would like to thank PT. ASDP Indonesia
Ferry (Persero), PT. Flobamor, PD. Panca Karya,
Daya Radar Utama Shipyard, and Adiluhung
Shipyard, and Biro Klasifikasi Indonesia as well for
assisting and enabling the Authors to collect primary
data for this research.
REFERENCES
Asri, S. (2016). Klaster Tonase Kapal Ferry Ro-Ro dan
Pengaruhnya Terhadap Kebutuhan Lahan Perairan
Pelabuhan Penyeberangan (in Bahasa). Jurnal Riset
Teknologi Kelautan, 49- 60.
Direktorat Jenderal Perhubungan Darat. (1994). Petunjuk
Teknis Persyaratan Pelayanan Minimal Kapal Sungai,
Danau dan Penyeberangan (in Bahasa). Jakarta:
Departemen Perhubungan.
ibiblio. (2008, Desember 18). units:L. Retrieved from
Ibiblioc: The Public's Library and Digital Archive:
http://www.ibiblio.org/units/dictL.html
IFA. (2006, 06 20). Glossary - Lane Meter. Retrieved from
IFA - International Forwarding Agent s.r.l.:
http://www.ifaitaly.com/en/links/glossary/603- lane-
meter.html
IMO. (1969). The International Convention on Tonnage
Measurement of Ships. London: International Maritime
Organization.
Kristensen, H. O. (2006). Cargo Transport by Sea and Road
— Technical and Economical Environmental Factors.
Naval Engineers Journal, 115-129.
Kristensen, H. O. (2016). Analysis of technical data of Ro-
Ro ships. Kongens Lyngby: HOK Marineconsult ApS.
Marine Environment Protection Committee. (2009).
Guidelines for Voluntary Use of the Ship Energy
Efficiency Operational Indicator (EEOI) - 3
Definitions. London: International Maritime
Organization.
Menteri Perhubungan R.I. (2002). Tatanan Kepelabuhanan
Nasional - Keputusan Menteri Perhubungan No KM 53
Tahun 2002 (in Bahasa). Jakarta: Kementerian
Perhubungan Republik Indonesia.
Walpole, R. E. (2012). Probability & Statistics for
Engineers & Scientists : Ninth Edition. Boston:
Prentice Hall.
Wathne, E. (2012). Cargo Stowage Planning in RoRo
Shipping : Optimisation Based Naval Architecture.
Trondheim: Norwegian University of Science and
Technology.
Watson, D. G. (1998). Practical Ship Design. Oxford:
Butterworth Heinemann.
Lane Meters Correlation Analysis towards the Main Dimensions of Ro-ro Ships under 2000 GT
147
