Analysis of Necessity for Container Domestic Transhipment Services
Inter-terminals: Case Study of Tanjung Perak Port Region
Achmad Mustakim
1,a
, Firmanto Hadi
b
and Septia Ratna Sari
c
1
Department of Marine Transportation Engineering, Institut Teknologi Sepuluh Nopember, Indonesia
Keywords: Benefit Cost Ratio, Container, Relocation Inter Terminals, Transhipment.
Abstract: Inter-terminal container domestic transhipment service in Port of Tanjung Perak has the additional stacking
yard in Terminal of Mirah, inter-terminal relocation service, and 35% tariff reduction are provided. This
service will indirectly impact shipping industry, which provides its own facilities such as depot and trucks for
the relocation activities. The objectives of this research are (i) to analyse whether the service of domestic
transhipment containers inter-terminals is needed or not in Perak port region, (ii) to evaluate the
appropriateness of the existing location of container domestic transhipment stacking yard in Terminal of
Mirah, and (iii) to identify the impact of implementing inter-terminal container domestic transhipment service
to its fee at Port of Tanjung Perak. The results show that Inter-terminal container domestic transhipment
service is only needed for discharged container transhipment in Terminal of Nilam and Berlian with YOR
value of 61.9 % and 63.3 % respectively. The placement scenario of Transhipment CY shows that Terminal
of Mirah has a faster service time up to 4.6 boxes/hour. BCR value in the perspective of ports is for about
1.67 while BCR value in total is up to 1.45 in which 35 % are relocated from transhipment CY of discharged
containers. This service reduces the costs for container domestic transhipment up to 33 % in Port of Tanjung
Perak.
1 INTRODUCTION
Pelabuhan Indonesia III has the potential to drive the
national economy which has handled 72 domestic
container shipping lines (Basuki et al., 2015). The
flow of domestic transhipment containers at the Port
of Tanjung Perak in 2016 was recorded at 33,374
TEUs, in 2017 it grew to 35,131 TEUs and in 2018 it
reached 36,980 TEUs (Wijaya, 2019). Starting 15
January 2019, inter-terminal domestic transhipment
container service in the Tanjung Perak Port area
applies. Based on the survey result, there is an
increase in container yard (CY) facilities for domestic
transhipment containers and a 35% reduction in
domestic transhipment container service tariffs.
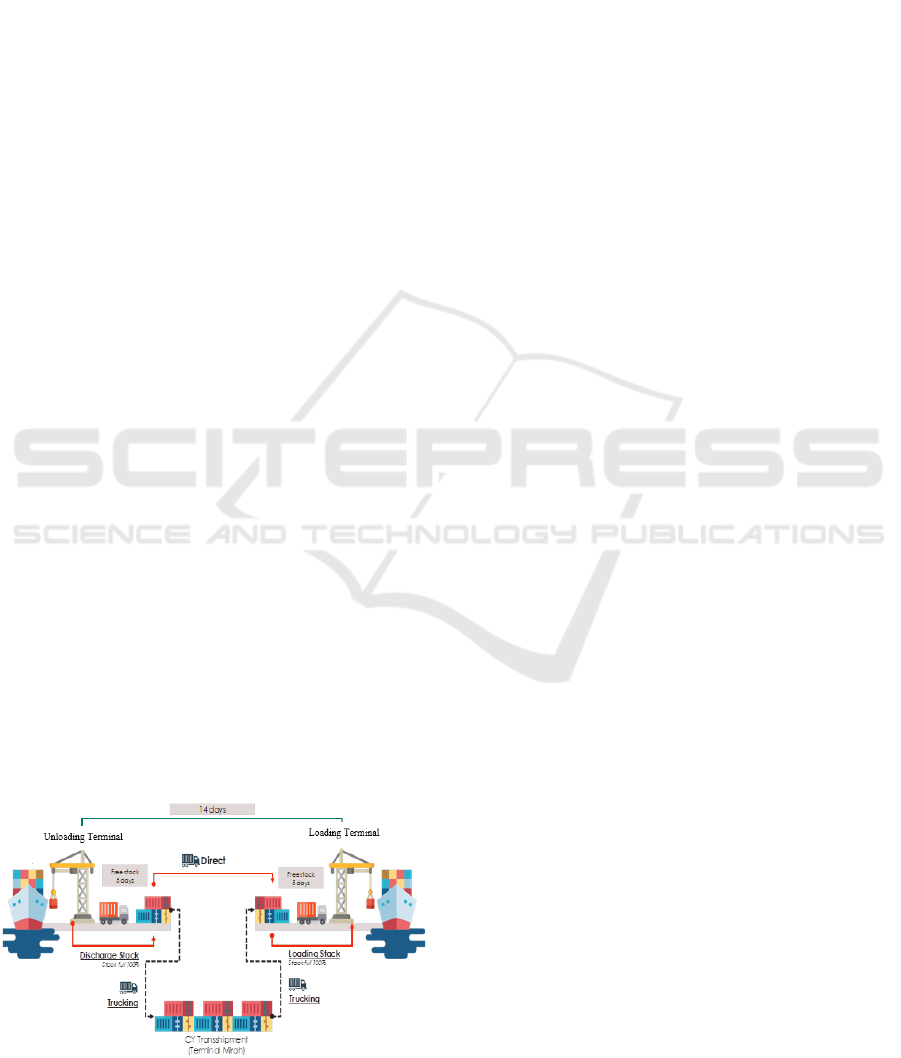
There are two types of inter-terminal domestic
container transhipment services, through domestic
transhipment CY and without going through domestic
transhipment CY or direct terminal unloading to the
loading terminal. The types of service are differentiated
based on the location of the unloading terminal and the
time of the transhipment container (Wijaya, 2019).
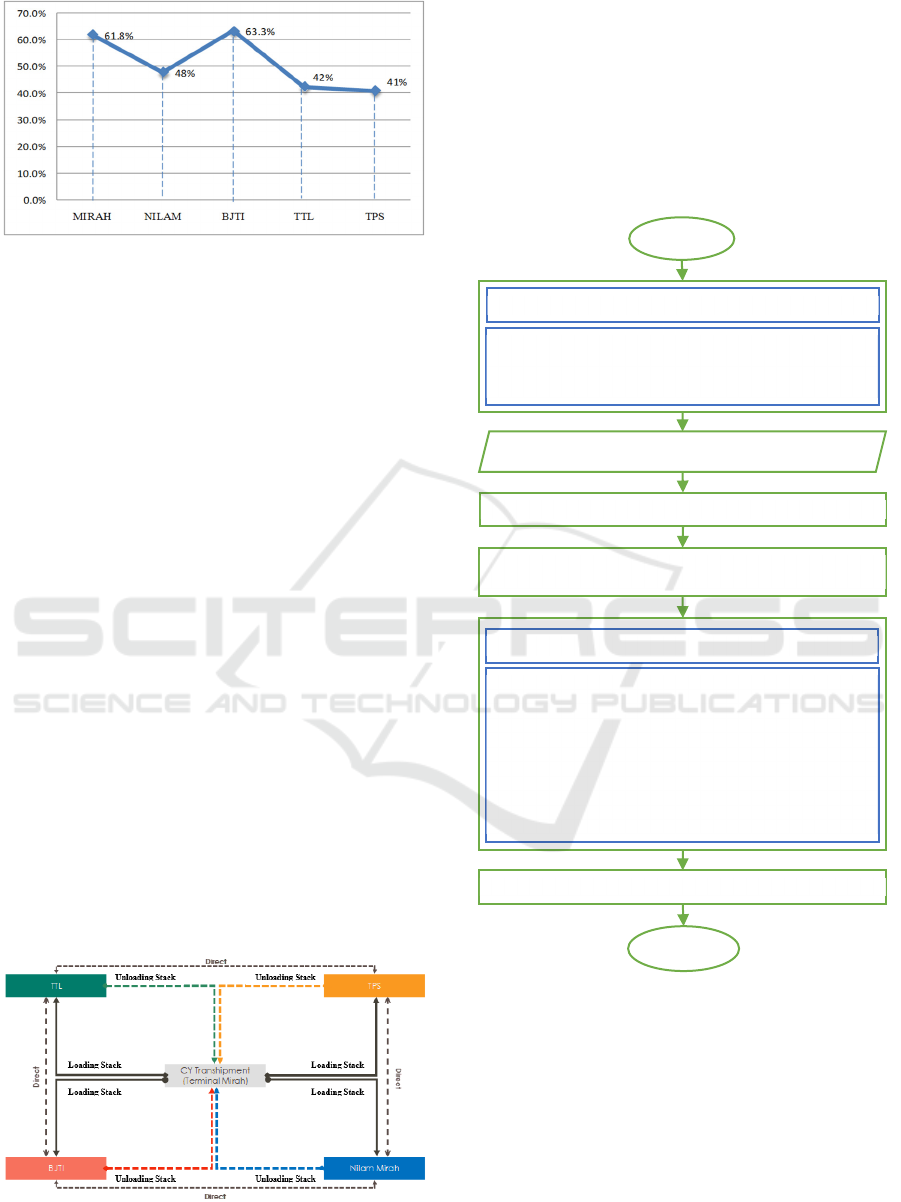
The working area in this study includes the
Tanjung Perak Port region. The area includes
container terminals that serve domestic transhipment
containers, namely Terminal of Mirah, Terminal of
Berlian, Terminal of Nilam, Surabaya Container
Terminal, and Terminal of Teluk Lamong. The
Transhipment CY location is located in the stacking
yard of Mirah Terminal, Jalan Prapat Kurung Selatan
with a capacity of 55,955 TEUs / year. Figure 2 shows
YOR for each terminal involved in domestic
transhipment container service.
Fi
g
ure 1: Service flow of domestic container transhi
p
ment.
Mustakim, A., Hadi, F. and Sari, S.
Analysis of Necessity for Container Domestic Transhipment Services Inter-terminals: Case Study of Tanjung Perak Port Region.
DOI: 10.5220/0010864000003261
In Proceedings of the 4th International Conference on Marine Technology (senta 2019) - Transforming Maritime Technology for Fair and Sustainable Development in the Era of Industrial
Revolution 4.0, pages 77-85
ISBN: 978-989-758-557-9; ISSN: 2795-4579
Copyright
c
2022 by SCITEPRESS – Science and Technology Publications, Lda. All rights reserved
77
This service can reduce the use of depots and
shipping trucks from the number of containers
transhipment domestic between terminals (Nur & Hadi,
2013). In addition to the imposition of new tariffs set at
each unloading terminal and loading terminal, based on
field survey, service users must pay for container
relocation services operated by PT Berkah Multi Cargo
with package rates that have been set. This will have an
impact on the cost and time of service for containers
(Triatmodjo, 2009). In this regard, this study was
prepared to analyse whether the service of domestic
transhipment containers inter-terminals is needed or not
in Perak port region. So that later it is expected that this
research can be used as a reference in determining
strategies/policies related to domestic transhipment
container services in the Tanjung Perak Port area. The
results of this study can be used to determine whether
inter-terminal domestic transhipment container services
are needed in the Tanjung Perak Port area based on cost
and time service analysis.
2 RESEARCH METHODOLOGY
The concept of the research to be carried out is to
compare the distribution services of inter-terminal
transhipment containers, namely the service of
existing (relocation container through transhipment
CY in Terminal of Mirah) and the absence of
transhipment CY services (relocation container
through depot). For the terminals reviewed, 5 (five)
terminals are involved in domestic transhipment
container service with 3 types of container
distribution for each service. The existing service are
(i) Unloading Stack-Transhipment CY-Load Stack,
(ii) Unloading Truck Losing-Transhipment CY-Load
Stack, and (iii) Unloading Stack-Load Stack for
services there are Transhipment CY. The service of
relocation container through depot without
Transhipment CY in Mirah, namely: (i) Unloading
Stack-Depot Shipping-Load stack, (ii) Unloading
Truck Losing-Depot Shipping-Load stack, and (iii)
Figure 3: Container distribution services.
Figure 2: Yard Occupancy Ratio at Tanjung Perak Por
t
Region, 2018.
Figure 4: Tool design flow chart.
Start
Identification of problems
In 2019, container yard transhipment domestic at
Mirah Terminal applies to Domestic Container
Transhipment. There are five Container Terminals
involved in the service.
literature stud
y
and field surve
y
Data collection and processing
Data analysis (optimization method)
and discussion
Analysis results
There will be one alternative chosen among these
three alternatives:
1. The container yard transhipment domestic is
needed at Mirah Terminal with impact analysis on
container time and service.
2. The optimal location for the Container Yard
Transhipment Domestic among the five terminals
involved.
3. The container yard transhipment domestic is not
needed in Tan
j
un
g
Perak Port Re
g
ion.
Conclusions
En
d
senta 2019 - The International Conference on Marine Technology (SENTA)
78
Unloading Stack-Load Stack. This research will be
conducted using the flow depicting in Figure 4.
3 STUDY AND ANALYSIS
In this study and analysis, a simulation will be
conducted to obtain the right service analysis results
with the final BCR value from the side of the service
provider and service user.
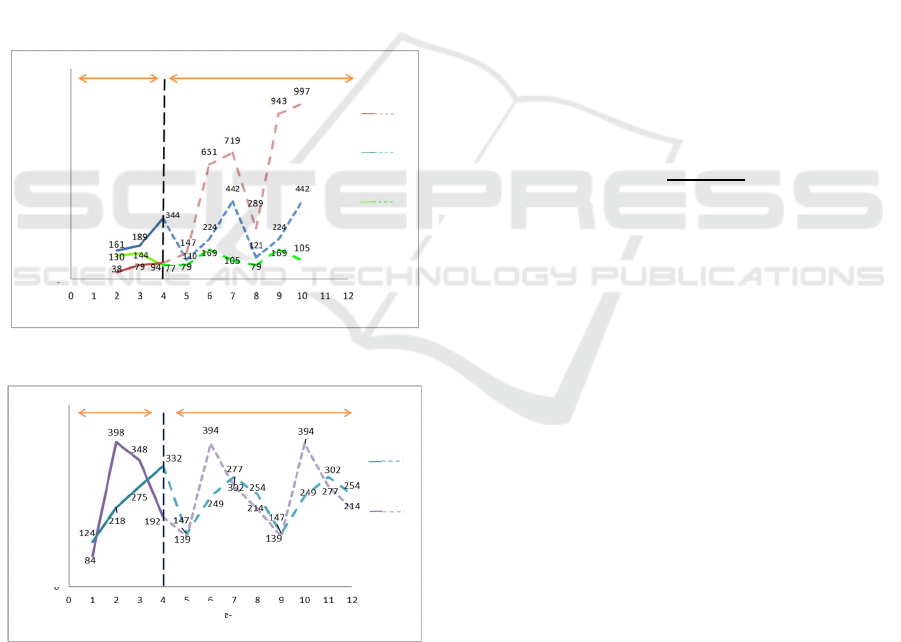
3.1 Simulation Model for
Transhipment Container Service
Demand in Unloading Terminal
Container service requests are analysed using moving
average method because the number of containers
unloaded at each terminal from January to April 2019
has a dynamic data pattern (See Figure 5 and 6).
Figure 5. Number of container projection (TPS, Nilam, Mirah).
Figure 6. Number of container projection (Teluk Lamong,
Berlian).
Input model simulation is the number of containers
unloaded by taking into account the percentage of
container size and the loading terminal probability
(Putra, 2016). This study using probability theory to
determine the loading terminal which is the priority
destination for container relocation from the
unloading terminal (Carlo et al., 2014). The result of
the probability calculation is the number of containers
relocating to the loading terminal, calculated using
the following procedure.
a. Number of relocation containers
The number of relocated containers is obtained
using Equation 1 below.
Pr = Pbi
i
j
.
k
i
j
(1)
Pr = Number of containers relocated (Box/
Month)
i = Unloading Terminal
j = Load Terminal
k = Percentage of Relocation
b. YOR analysis in the unloading terminal
Calculations for the stacking field utility uses
the following equation (Directorate General of
Sea Transportation, 2017):
𝑌𝑂𝑅′
𝑇𝐺 𝑇𝐺′
𝑇𝑌
(2)
YOR = YOR after there is a transhipment
container
TG = Capacity reached (Box)
TG' = Capacity reached after container
transhipment (Box)
TY = Installed capacity (m
2
)
c. Cost calculation through transhipment CY
Fares between terminals to the loading terminal
(Nilam, Mirah, Berlian) are consecutively
calculated using Equation 3, 4, and 5.
B
a = Tb
1
+ ((Prt . M
1
) . (((Lp
1
-5) . T
2
) +
(5 .
T
1
)) + ((Prt .
M
2
) . Lp
1
.
T
1
)) + Tm
(3)
B
a = Tb
2
+ ((Prt . M
1
) . ((( Lp
1
-5) . T
2
) +
(5 .
T
1
)) + ((Pr
t
.
M
2
) . Lp
1
.
T
1
)) + Tm
(4)
B
a = Tb
3
+ ((Prt . M
1
) . ((( Lp
1
-5) . T
2
) +
(5 .
T
1
)) + ((Prt .
M
2
) .
L
p
1
.
T
1
)) + Tm
(5)
Ba = Cost through domestic transhipment CY
Prt = Number of container relocation
through transhipment CY (Box)
Pro
j
ectiHisto
TPS
Nilam
Mirah
Month
Number of unloading containers (Box)
Number of unloading containers
Pro
j
ectioHisto
r
Berlian
Month
TTL
Analysis of Necessity for Container Domestic Transhipment Services Inter-terminals: Case Study of Tanjung Perak Port Region
79

Tb
1
= Rates at the unloading terminal
(Nilam, Mirah, Berlian)
Tb
2
= Tariff at the unloading terminal (Teluk
Lamong)
Tb
3
= Rates at the unloading terminal (TPS)
Lp
1
= Stacking time in transhipment CY
T
1
= Stacking Period 1 (1-5 days)
T
2
= Stacking Period 2 (6-10 days)
M
1
= Percentage Period 1 (Lt> 10 days)
M
2
= Percentage Period 2 (6 <Lt ≤ 10 days)
M
3
= Percentage Period 3 (Lt <5 days)
Tm
1
= Rates at the loading terminal (Nilam,
Mirah, Berlian)
Tm
2
= Rates at the loading terminal (Teluk
Lamong)
Tm
3
= Rates at the loading terminal (TPS)
d. Cost calculation through depot
B
d = (((Prd .M
1
) + (Prd .M
2
)) . (2 .(Tb +
Th + TL) + Tm + (
T
1
.( Lp
2
) + Td))
(6)
Prd = Number of container relocation
through shipping depot (Box)
Tm = Loading rate
LP
2
= Stacking time in shipping depot
Td = Shipping depot rates
e. Time Services Calculation through
Transhipment CY
PT
= (Prt . M
1
) + (Prt . M
2
) + (Prt . M
3
)
(7)
Wt
1
= PT . (Wbm + Wb + Wt + Wm + Hb
+
H
m + Tb
t
+ Ttm)
(8)
𝑊𝑏𝑚 𝑃𝑟𝑡
𝑀
𝑀
𝑀
𝑃𝑏𝑚
(9)
PT = Number of containers through
transhipment CY
Wt
1
= Time of container transhipment
through unloading container yard at
Teluk Lamong Terminal and TPS
Wbm = Time of unloading activities
Wb = Activity time in unloading terminal
Wt = Activity time in Domestic
transhipment CY
Wm = Activity time at the loading terminal
Hb = Haulage time of quay - unloading CY
Hm = Haulage time of load CY - quay
Tbt = Relocation time of unloading CY –
domestic transhipment CY
Ttm = Relocation time of domestic
transhipment CY – loading CY
Pbm = Productivity of loading and unloading
Times for containers through Transhipment CY
unloaded at Terminal of Nilam, Terminal of Mirah,
and Terminal of Berlian, are as follows:
Wt
2
= PT . (Wbm + Wt + Wm + Hm +
Tdt + Ttm
)
(10)
Wt
2
= Unloading container transhipment time
at Terminal of Nilam, Terminal of
Mirah, and Terminal of Berlian
Tdt = Dock trucking time - domestic
transhipment CY
To find out the duration of haulage and relocation use
the following equation:
𝑊
2
𝑆𝑡
𝑣
𝑇
(11)
𝑓
𝑊
Dail
y
operatin
g
time
(12)
𝑇𝑐
𝑓
.𝑛𝑇
(13)
𝐻𝑇 24.𝑃𝑟𝑡
𝑀
𝑀
𝑀
𝑛
𝑇
(14)
W
0
= Time of haulage/relocation (hours)
St = Distance (Km)
Vt = Speed (Km / hr)
f = Frequency
Tc = Truck visits (units / day)
nT = Number of trucks (units)
HT =Duration of haulage/relocation (hour)
f. Time Services Calculation through Depot
W
d1
= PT . (Wbm + Wb + Wm + Hb + Hm +
Tbd + Tdm)
(15)
Wd
1
= Container transhipment time through
depot (unloading container at Terminal
of Teluk Lamong)
Tbd = CY relocation time unloading - depo
Tdm = Shipping depot relocation time - CY
Load
W
d2
= PT . (Wbm + Wm + Hm + Tdd + Tdm)
(16)
Wd
2
= Container transhipment time through
depot (unloading container at Terminal
of Nilam, Terminal of Mirah, Terminal
of Berlian, and TPS)
senta 2019 - The International Conference on Marine Technology (SENTA)
80
Tdd = Trucking time from quay to depot
Tdm = Relocation time from depot to loading
CY
3.2 Analysis of Yard Occupancy Ratio
(YOR) in Unloading Terminals
The number of containers transhipment will affect the
value of YOR at each unloading terminal. This can be
seen from the number of containers relocating
between terminals and the time of transhipment
containers which indicate that the containers must
stack before the loading terminal issues the open
stack status. Terminals involved in these services
have the loading capacity varies, so there is a
difference in the value of YOR (Velsink &
Ligteringen, 2012).
After knowing the YOR at each unloading
terminal, it can be seen that containers unloaded at
terminals that have a YOR value exceed the port
operational standards (Directorate General of Sea
Transportation, 2018), require Transhipment CY /
Depo to stack containers. The number of containers
that are relocating to Transhipment CY / Depo is as
many as containers that cannot be piled up in the
terminal stacking yard. From the number of relocated
containers, the duration of each transhipment
container is seen, to find out the distribution of inter-
terminal transhipment container services through CY
Transhipment/Depo. The following are YOR
unloading terminals in the Tanjung Perak Port area.
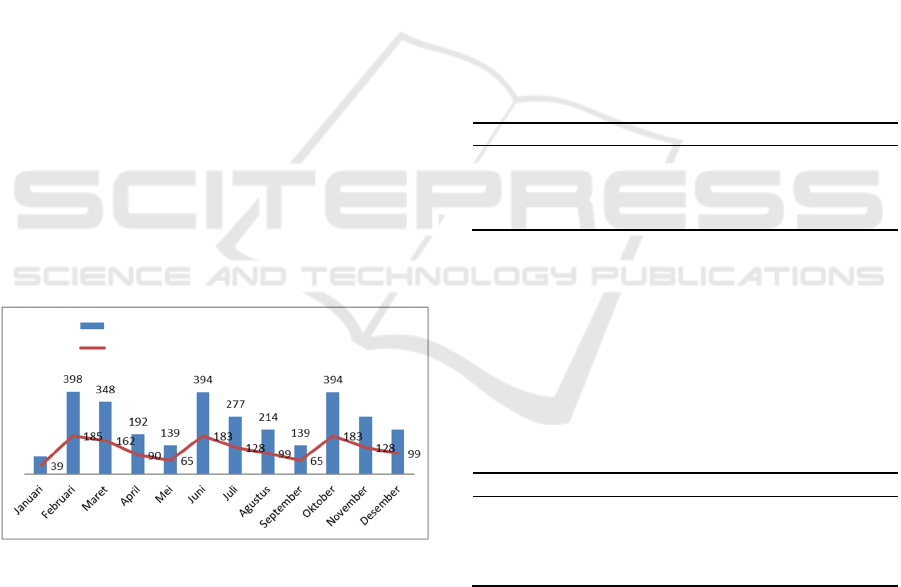
Figure 9. Containers unloading in Terminal of Berlia
n
through domestic transhipment CY/depot.
YOR calculation results show that Terminal of
Nilam and Terminal of Berlian have YOR values that
exceed port operating performance standards. So,
containers cannot be stacked in the Terminal of Nilam
and Terminal of Berlian. The container must go
through Domestic Transhipment CY at Terminal of
Mirah/Depot according to the time of transhipment.
The following is a graph of the number of containers
going through Transhipment CY / Depot within 1
year for transhipment containers unloading at
Terminal of Nilam. The number of domestic
transhipment containers through Domestic
Transhipment CY and Depot is 32% of the total
containers unloaded.
3.3 Analysis of Cost Services
The results of the simulation of service fees for existing
services Domestic Transhipment CY can be divided into
2 (two), namely service costs when transhipment
containers are realized and when containers are canceled
transhipment. The container is said to be the realization
of the transhipment if the time of the transhipment
container does not exceed 14 days and there is a 35%
service fee discount. The container is said to be canceled
if the time of the transhipment container exceeds 14 days
and the service fee is 100% of the applicable tariff. Table
1 shows increase and decrease in the cost of domestic
transhipment container services between terminals in
2019.
Table 1: Cost of unloading container services in Terminal
of Nilam.
Loadin
g
Terminal Increase/Decrease Costs
Mirah -35%
Berlian -35%
Teluk Lamon
g
-29%
TPS -34%
For cost analysis the author does not only analyses
containers that are unloaded at one terminal, but also
analyses containers that are unloaded at all terminals
involved. Next is the difference in the cost of
domestic transhipment container services between
terminals, where containers are unloaded at Berlian
Terminal.
Table 2. Cost of unloading container services in Terminal
of Berlian.
Loading Terminal Increase and Decrease Costs
Nilam -36%
Mirah -34%
Teluk Lamong 24%
TPS -33%
There was a 24% increase in fees on containers
loaded at the Terminal of Teluk Lamong. This is
influenced by the location of the Terminal of Teluk
Lamong which is far from the Terminal of Berlian
and the number of containers relocating to the Teluk
Lamong Terminal is more than the containers
relocating to other terminals. From the total cost of
container services through transhipment CY and
Depot, it can be seen that containers through Depo are
Number of unloading container in Berlian (Box/month)
Through Domestic Transhipment CY/Depot
Analysis of Necessity for Container Domestic Transhipment Services Inter-terminals: Case Study of Tanjung Perak Port Region
81
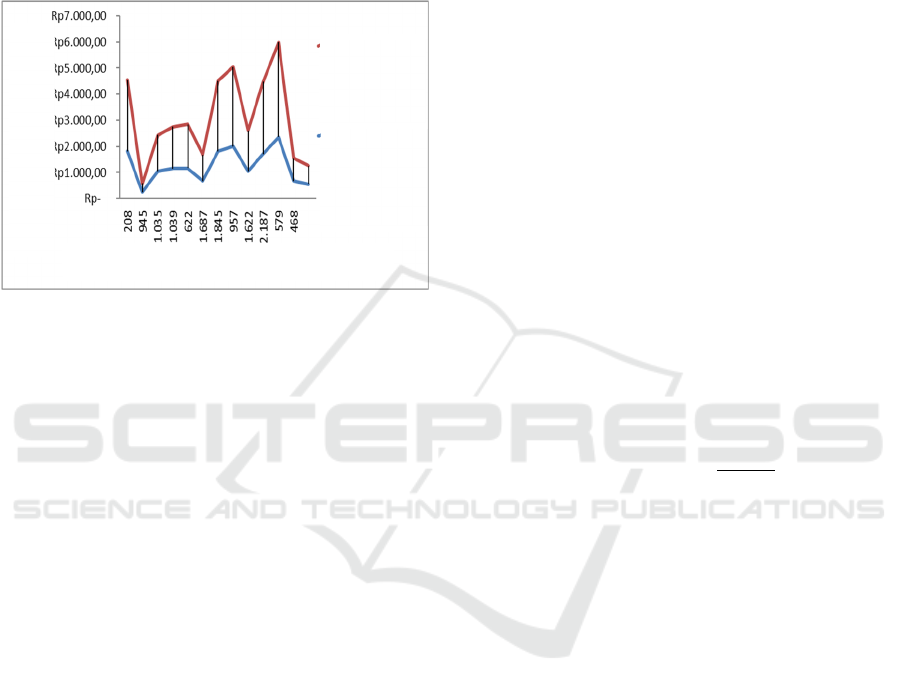
more expensive than containers through transhipment
CY with an average cost reduction of 33%. In total,
the cost of services with existing transhipment CY is
cheaper than that of no transhipment CY services
with an average reduction in costs of 30% in one year.
Figure 10 shows the difference in service fees based
on the number of containers unloaded every month.
Fi
g
ure 10. Difference in domestic transhi
p
ment service costs.
3.4 Analysis of Transhipment CY
Location Accuracy based on
Service Time
To find out the exact location of Transhipment CY in
Mirah Terminal, the writer analyzed Transhipment
CY location in Terminal of Nilam, Terminal of
Berlian, Terminal of Teluk Lamong, and Surabaya
Container Terminal by calculating the fastest service
time of the five terminals. Equations for calculating
the accuracy of Transhipment CY locations based on
time considerations are as follows:
𝑇𝐿
∶
𝑇𝐿
∶
𝑇𝐿
:
𝑇𝐿
∶
𝑇𝐿
(17)
TL
1
= Transhipment CY service time at
Terminal of Nilam
TL
2
= Transhipment CY service time at
Terminal of Mirah
TL
3
= Transhipment CY Service Time at
Terminal of Berlian
TL
4
= Transhipment CY Service Time at
Terminal of Teluk Lamong
TL
5
= Transhipment CY Service Time at TPS
1 = Unloading terminal in Nilam
2 = Unloading terminal in Mirah
3 = Unloading terminal in Diamond
4 = Unloading terminal in Teluk Lamong
5 = Unloading terminal in TPS
3.5 Analysis of Benefit Cost Ratio
(BCR) Calculation
BCR calculation is done to find out that the stacking
field is needed from the side of the service provider
and from the service user (Sulianti & Tilik, 2013).
BCR value is obtained from the division between
total benefit and total cost.
a. Procurement Costs
In this study, there are procurement costs for the
transhipment build up the field at Terminal of
Mirah and procurements costs for the Depot. In
calculating the cost of procurement consider
inflation in 2019 which is equal to 2.88% and the
taxation of 10% of the cost of land investment.
b. Operating costs
Included in the operational costs of the
transhipment container services are equipment
fuel costs at the container terminal, maintenance
costs, and labour costs.
1) Operational Cost of Transhipment CY
a) Fuel and Electricity Costs
To calculate the cost of fuel obtained
by the equation:
Fuel costs
𝑃𝑏
𝐵.𝐾.𝐻
(18)
b) Equipment Maintenance Costs
Equipment maintenance costs are
used for engine lubrication of loading
and unloading machinery, assuming
that in one-month oil needs as much
as 8 litters /month.
c) Labour Costs
In this calculation, the salary value
for operator workforce
(GajiUmr.com, 2019), which is Rp
3,872,000/month. Costs for labour
salaries in 1 month can be calculated
by the equation:
Labour costs 𝑇𝐵𝑀.𝐺
(19)
TMB = Number of workers
G = Salary (Rp / month)
2) Operational Cost of Depot
a) Integrated Billing System (IBS)
Operating Costs
Service Cost of Domestic Transhipemtn
Number of Container through Transhipment CY (Box/month)
Number of
container
through Depot
(milion/month)
Cost of
container
through
Transhipment
CY
(milion/month)
senta 2019 - The International Conference on Marine Technology (SENTA)
82
Operational costs when there are
Transhipment CY from the shipping
side are the administrative costs for
issuing job orders according to the
number of containers transhipment,
labour costs for payment system
operations, and monitoring of
containers that are transhipment
domestically. The operational costs are
borne by the shipping company are the
administrative costs of issuing job
orders and the operational costs of the
Integrated Billing System (IBS) plus
the cost of reserves.
c. Opportunity Cost
Opportunity costs or costs incurred when
sacrificing opportunities to use services for
other purposes. To find out the number of costs
lost due to transhipment CY, the authors’
analyses from two sides, namely from the side
of the service provider and service user.
1) Opportunity Cost of Port
Port Opportunity Cost can be calculated
with the following equation:
Opportunit
y
costs 𝑇𝐵𝑀.𝐺
(20)
BS = Fee for rental of stacking field in
Terminal of Mirah (Rp / m
2
)
LS = Area of leased land (m
2
)
K = Increase in cost by 2% / month
2) Opportunity Cost of Shipping Company
Shipping company opportunity cost can be
calculated by the equation:
Opportunit
y
costs
𝑊𝑡
𝑊𝑡
.𝐾 (21)
𝑊𝑡
𝑊𝑡
= Time difference via
transhipment CY and
via depo
K = Loss (Rp / hour)
The calculation results show the value of BCR
from the port side that is the total benefits obtained by
the port minus the opportunity cost of the port divided
by the total cost. From the calculation of Port BCR of
1.09> 1 so from the CY side transhipment side is
needed. BCR calculation from the shipping company
side is that the total benefits obtained by the shipping
company are reduced by the shipping company
opportunity cost. The calculation of Shipping BCR of
1.67> 1 so from the service user side (shipping
company) transhipment CY is needed. From the
results of the overall BCR calculation shows that the
value of 1.45> 1 so that it can be said that the service
with the existing transhipment CY is needed from the
port side as well as from the service user (shipping
company).
3.6 Analysis of Container Quantity
Sensitivity to BCR Value
The sensitivity analysis of the BCR value is
calculated based on the change in the percentage of
the number of domestic transhipment containers
between terminals through Transhipment CY for each
unloading terminal. Changes in the percentage of the
number of containers relocating through
transhipment CY will affect the number of containers
that have the terminal loading status directly. The
following is the result of the sensitivity analysis of the
change in the number of containers through
transhipment CY to the value of BCR.
Figure 10. Sensitivity analysis of containers number to the
BCR value.
Benefit Cost Ratio for domestic transhipment
services are needed from the Portside with a BCR
value of 1.09, from the shipping company side with a
BCR value of 1.67, and a total BCR value of 1.45 with
the percentage of relocation containers between
terminals via Transhipment CY 35 % of total
transhipment containers unloaded at each terminal.
3.7 Analysis of Transhipment CY
Capacity
In this study, the authors also analysed YOR or
Domestic Transhipment CY's ability to accommodate
transhipment containers in the Port of Tanjung Perak.
Before calculating YOR, one must know the
discharged capacity and used capacity of the
Number of container throu
g
h Transhi
p
ment CY
Existing of
Port, 1.09
Existing of
All, 1.45
Value of BCR
Existing condition,
32 % of transhi
p
ment container more than 10 da
y
s
Existing of
Shipping,
1.45
Analysis of Necessity for Container Domestic Transhipment Services Inter-terminals: Case Study of Tanjung Perak Port Region
83
transhipment container stacking yard located in
Mirah Terminal. In calculating the used capacity of
the stacking yard, it must know the total containers
piled up on Domestic Transhipment CY by the
number of containers going through Domestic
Transhipment CY and the number of containers to be
loaded at Mirah Terminal. In this study, the authors
analysed the change in the number of containers
through Domestic Transhipment CY by changing the
percentage of Period 1 (Lt> 10 days). The change in
the percentage of Period 1 will affect the percentage
of Period 2 and Period 3. The percentage change is
intended to determine the ability of Domestic
Transhipment CY to accommodate containers if the
number of containers through Domestic
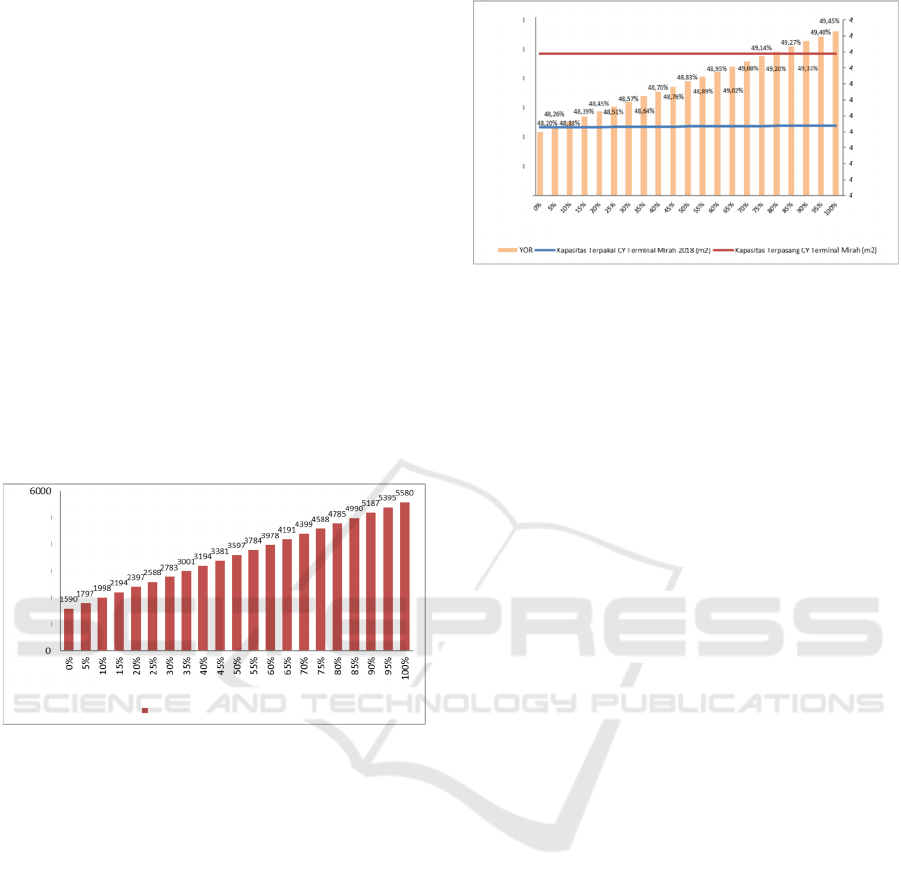
Transhipment CY changes. The results of the
calculation can be seen in the number of containers
piled up on Domestic Transhipment CY from the total
transhipment containers unloaded at each terminal, as
follows.
Figure 11. Analysis container number stacked at domestic
transhipment CY.
After knowing the number of containers piled up
in Transhipment CY, we can be calculated the ability
of Transhipment CY to accommodate containers. The
following are the results of the calculation of the
number of container analysis of Transhipment CY
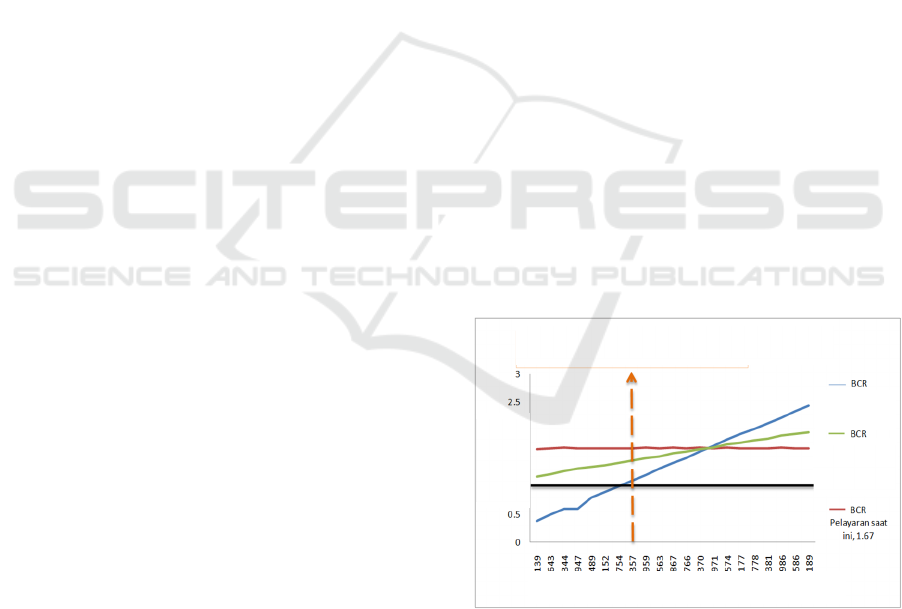
capacity at Mirah Terminal. YOR (Yard Occupancy
Ratio) in the Terminal of Nilam 61.9% and YOR in
Terminal of Berlian 63.3% have exceeded the port
operational performance standards. So, the service
with Transhipment CY is only needed for
transhipment containers which are unloaded at
Terminal of Nilam and Terminal of Berlian. The
following is the result of the sensitivity analysis of
container number on BCR value.
Figure 12: Sensitivity analysis of container number on BCR
value.
4 CONCLUSIONS
From the results of research and calculations that
have been carried out, then some conclusions are
obtained, among others as follows:
1. The scenario of placing transhipment CY
locations in all terminals involved shows that
transhipment CY is right at Mirah Terminal with
an average service time of 4.6 hours/box.
2. Transhipment CY Services can reduce service
costs but not significantly, depending on the
unloading terminal and the selected type of
service distribution. Average transhipment
container service costs are:
a. Unloading transhipment containers at
Terminal of Nilam decreased by 31%.
b. Unloading transhipment containers at
Terminal of Mirah decreased by 50%.
c. Unloading transhipment containers at the
Terminal of Berlian increased by 6%.
d. Unloading transhipment containers at the
Terminal of Teluk Lamong decreased by 38%.
e. Unloading transhipment containers at the
Container Terminal decreased by 42%.
Despite an increase in the cost of container
unloading services at the Terminal of Berlian, the
existence of Transhipment CY can reduce service
costs by 33% when seen from all containers that
transhipment in the Port of Tanjung Perak. Further
analysis is needed with the presence of CY
transhipment as a domestic container hub for Eastern
Indonesia and is able to reduce logistics costs.
Number of Container (Box)
Presentage of relocation with duration >10 days
Number of container in Transhipment CY (Box)
Capacity of Transhipment CY in Terminal of Mirah
YOR of Transhipment CY in Terminal of Mirah
Presentage of relocation with duration >10 days
senta 2019 - The International Conference on Marine Technology (SENTA)
84

ACKNOWLEDGEMENTS
The authors would like to thank PT Pelabuhan
Indonesia III (Persero) and East Java Regional, PT
Terminal Teluk Lamong, PT Surabaya Container
Terminal, PT BJTI for providing data and
information.
REFFERENCES
Basuki, M, Susanto, R. B., Herianto, H. P. (2015). Analisis
Risiko Kegiatan Bongkar Muat Sebagai Komponen
Dwelling Time di Pelabuhan. Seminar Nasional Sains
dan Teknologi Terapan III 2015, Institut Teknologi
Adhi Tama Surabaya.
Carlo, H. J., Vis, I. F. A., & Roodbergen, K. J. (2014).
Transport operations in container terminals: Literature
overview, trends, research directions and classification
scheme. European Journal of Operational Research, 236
(1), 1–13. https://doi.org/10.1016/J.EJOR.2013.11.023
Directorate General of Sea Transportation. (2017).
Guidelines for Calculation of Port Operational Service
Performance. Regulation of the Director General of Sea
Transportation No. HK 103/2/2/DJPL-17. Directorate
General of Sea Transportation, Republic of Indonesia.
Directorate General of Sea Transportation. (2018).
Standard of Port Operational Service Performance.
Nur, H. I., & Hadi, F. (2013). Layout Optimization Model
for Dry Bulk Port Based on Discrete Simulation
Approach: Case Study Special Purpose Port of PT
Petrokimia Gresik. National Seminar on Marine
Technology Theory and Application Technology.
Institut Teknologi Sepuluh Nopember, Surabaya, B-42-
B47.
Putra, I. P. (2016). Comparative Analyis of Multiport and
Transshipment on Domestic Container Transport.
Undergraduate Thesis. Department of Marine
Transportation Engineering, Faculty of Marine
Technology, Institut Teknologi Sepuluh Nopember,
Surabaya.
Sulianti, I., & Tilik, L. F. (2013). Internal Rate of Return
(IRR) and Benefit Cost Ratio (BCR) Analysis of
Financial Feasibility on Technical Quantity Alternative
of Palembang Cinde Market Building. Jurnal Teknik
Sipil Pilar, 8(1).
Triatmodjo, B. (2009). Port Planning. Yogyakarta: Beta
Offset Yogyakarta.
GajiUmr.com. (2019). 2019 Complete List of Minimum
Provincial Wage and Minimum Regional Wage for 38
Regencies and Cities in East Java. Accessed from
http://www.gajiumr.com/gaji-umr-jawa-timur/.
Velsink, H., & Ligteringen, H. (2012). Ports and
Terminals. Delft University of Technology.
Analysis of Necessity for Container Domestic Transhipment Services Inter-terminals: Case Study of Tanjung Perak Port Region
85
