
Utilization of the Beach Climate Index (BCI) based on Meteorological
Review to Support Tourism Development in Bangka Island
Faqih Musyaffa
1,a
, Muhammad Rafli
1,b
, Anwar Budi Nugroho
1,c
, Reynold Mahubessy
1,d
and Yosafat Donni Haryanto
2,e
1
Undergraduate Program of Meteorology, STMKG, Banten, Indonesia
2
Lecturer, Department of Meteorology, STMKG, Banten, Indonesia
e
yosafatdonni@gmail.com
Keywords: BCI, Beach, Development, Tourism.
Abstract: Bangka Island has a beautiful nature, especially in the beach and coastal areas. The tourism sector has been
focused to develop the economy. Climatology factors have a strong impact on natural conditions that can
affect tourism activities, so they need to be considered. This study aims to analyse the beach climate index in
Bangka Island. Application of ECMWF ERA-Interim reanalysis data and observation data from the Pangkal
Pinang Class I Depati Amir Meteorological Station over a 30-years periodic were analysed to determine the
comfort level of the beach climate using the Beach Climate Index (BCI). Meteorological parameters used in
BCI are temperature, precipitation, wind speed, and sunshine duration. Furthermore, this measurement is used
to analyse as temporally and spatial data in monthly periodic. The result shows that the comfort level each
month is classified as “Very Good” in general, with the category of "Excellent" in June, July, August (JJA)
so it is recommended for tourists who want to visit Bangka Island during the dry season. Thus, this study is
important to support information services on the tourism sector development.
1 INTRODUCTION
Tourism is one of the sectors that contribute to
Indonesia's development (Sumargana, 2004). Many
tourist destinations in Indonesia have the potential to
develop. One of them is Bangka Island. Bangka
Island from Bangka Belitung province has many
beach destinations (Habibi et al.,2007). The number
of tourist visits every year has increased rapidly
(Bangka Belitung Culture and Tourism Department,
2010).
Tourism development is a series of efforts to
realize integration in the use of tourism resources and
integrate all forms of aspects outside tourism that are
directly or indirectly related (Swarbrooke, 1996).
Tourism development has proven to have a
positive impact on the existence of major changes in
people's lives. it has an economic impact by on
expanding business and employment opportunities,
increasing per capita income and increasing the
country's foreign exchange (Priambudi, 2013).
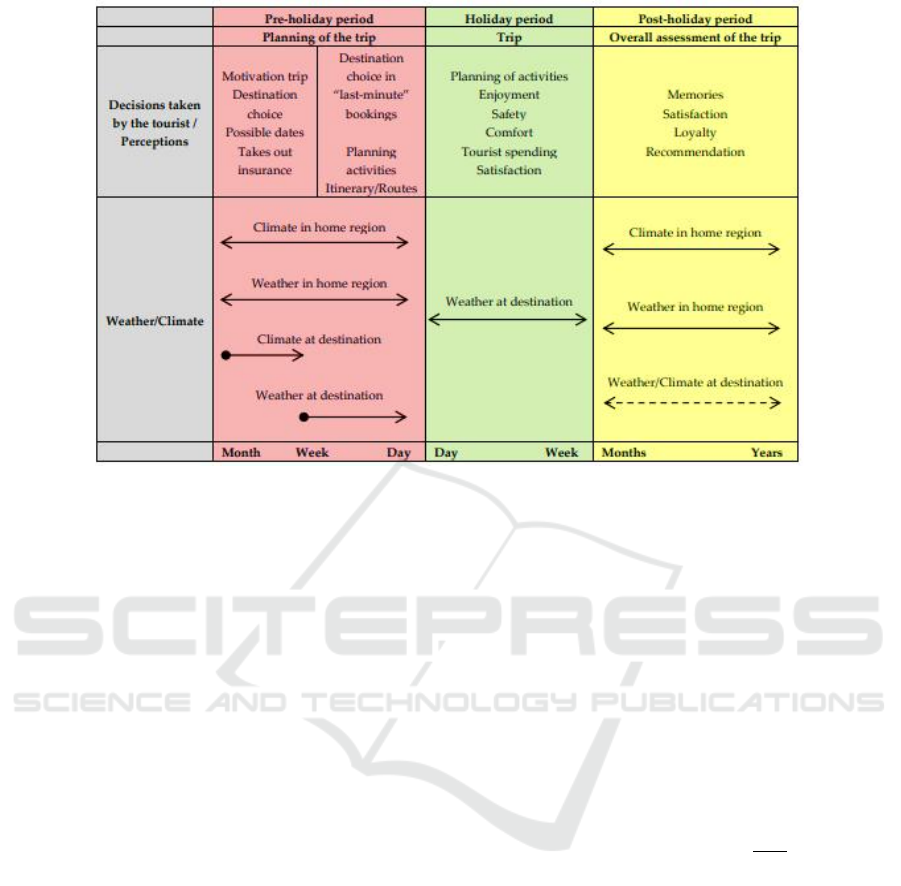
In developing the tourism sector, weather and
climate information factors play an important role in
the decision-making process and the travel
experience of consumers or tourists (Scott and
Lemieu, 2010; Eugenio and Campos, 2010; Gossling
et al., 2012). Climate factors need special attention
because they are closely related to natural conditions
that can affect tourism activities. Morgan et al. (2000)
had conducted research in 34 countries including
Indonesia, which was represented by the Bali area
using parameters of precipitation, wind, air
temperature, sun exposure time, thermal sensation,
and bathing water temperature to determine the level
of tourism comfort based on the BCI index (Beach
Climate Index). The results showed that several
tropical destinations such as Gambia, Bali
(Indonesia), Cancun (Mexico), and Jamaica have
hotter thermal sensation values throughout the year.
When entering the transition season of Bali,
Indonesia is very worth a visit for a tour.
Musyaffa, F., Rafli, M., Nugroho, A., Mahubessy, R. and Haryanto, Y.
Utilization of the Beach Climate Index (BCI) based on Meteorological Review to Support Tourism Development in Bangka Island.
DOI: 10.5220/0010855500003261
In Proceedings of the 4th International Conference on Marine Technology (senta 2019) - Transforming Maritime Technology for Fair and Sustainable Development in the Era of Industrial
Revolution 4.0, pages 71-76
ISBN: 978-989-758-557-9; ISSN: 2795-4579
Copyright
c
2022 by SCITEPRESS – Science and Technology Publications, Lda. All rights reserved
71
The purpose of this study is to analyze the comfort
level in the beach area of Bangka Island using the BCI
Index (Beach Climate Index) with spatial and
temporal data. We hope the result can be a reference
for foreign and local tourists who will take a vacation
to Bangka Island.
2 DATA AND METHODOLOGY
2.1 Data
This study was conducted over Bangka Island, Bangka
Belitung Province, located in latitude (104.9-107.1) and
longitude (1.30S-3.25S). The data used is as follows.
a. ECMWF ERA-Interim reanalysis data synoptic
monthly mean for the parameters of skin
temperature, wind speed 10m, total precipitation,
and sunshine duration with a resolution of 0.125°
x 0.125° and the period 1987-2017.
b. Daily observation data for the years 1987-2017 for
parameters of precipitation, wind speed, sunshine
duration, relative humidity, and average
temperature of Pangkal Pinang Class I Depati Amir
Meteorological Station were obtained from
Database Online BMKG. ECMWF reanalysis data
is processed spatially using ArcGIS 10.3 (trial
version) to display the mapping by inputting the
*.nc to *.xls file extension which is converted using
ODV software. Daily observation data is processed
statistically using Microsoft Office Excel.
2.2 Methods
Daily observation data is processed using Microsoft
Office Excel to obtain normal data for 30 years by
calculating monthly average for parameters of
precipitation, wind speed, sunshine duration, relative
humidity, and average temperature. Auliciems et al.
(2007) developed an effective temperature in terms of
the correlation between air humidity and daily
average temperature to show the perceived
temperature and comfort conditions using the
following equations (Houghten et al, 1923).
𝐸𝑇0.4
𝐷𝐵𝑇101
𝑅𝐻
100
(1)
where ET (°C) is the effective temperature, DBT is
dry ball temperature as the daily average temperature,
and RH is relative humidity.
Based on research conducted by Morgan et al
(2000), a beach climate index has been developed to
determine the comfort level of tourism in coastal
areas with a scale of 0-100 using the following
equation.
𝐵𝐶𝐼0.18𝑇𝑆0.29𝑃0.26𝑊0.27𝑆
(2)
where BCI is beach climate index, TS is thermal
sensation obtained from skin temperature, P is total
precipitation, W is wind speed, and S is sunshine
duration.
Figure 1: Climate and Meteorology information towards tourist decision (Scott and Lemieu, 2010).
senta 2019 - The International Conference on Marine Technology (SENTA)
72
Each parameter is processed based on a scale
according to criteria determined by Lemesios et al
(2016). The scaling results of each parameter are
entered into equation (2) to obtain the Beach Climate
Index (BCI) with weighting scheme (scale) <40
(Unfavourable), 40-60 (Acceptable), 60-70 (Good),
70-80 (Very Good), and >90 (Excellent).
Based on the results of the calculations are used to
analyse the comfort level of tourism on Bangka Island
spatially and temporally for the rainy season period,
namely DJF (December, January, February), the dry
season, JJA (June, July, August), the transitional
season, MAM (March, April, May), and SON
(September, October, November) to obtain
information on the comfort level of tourism to support
the development of the coastal and marine tourism
sector.
Table 2: BCI Weighting Scheme for Effective Temperature
(Lemesios, 2016).
Ratin
g
Effective Tem
p
erature
(
°C
)
100 32.5-34.4
77
34.5-35.4
39
29.0-32.4
24
35.5-36.4
21
26.0-28.9
2
21.0-25.9
Table 3: BCI Weighting Scheme for Wind Speed
(Lemesios, 2016).
Ratin
g
Wind S
p
eed
(
m/s
)
100
<4
50
4-6
0
>6
Table 4: Classification of BCI score (Lemesios, 2016).
Ratin
g
Comfort Level fo
r
Beach Activit
y
>80 Excellent
70-80 Verry Good
60-70 Good
40-60
Acceptable
<40
Unfavorable
3 ANALYSIS AND RESULTS
Comfort is one of the important aspects of tourism.
There are Many aspects that affect the comfort level,
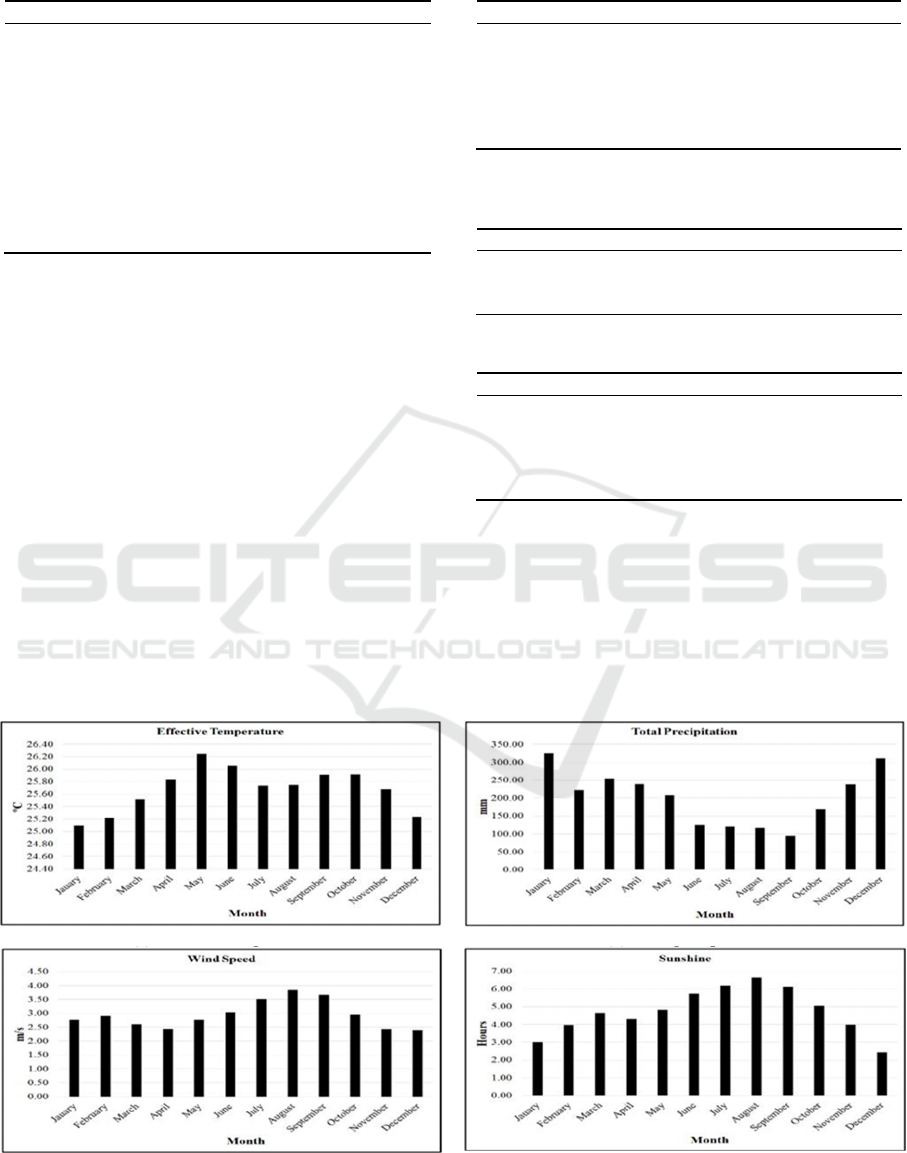
one of them is the meteorological parameter. Based
on Beach Climate Index (BCI), the spatial data shows
that there is a variation of the condition. By using
(
a
)
Effective tem
p
erature
(
b
)
Total
p
reci
p
itation
(c) Wind spee
d
(d) Sunshine
Fi
g
ure 2: Monthl
y
avera
g
e observation.
Table 1: BCI Weighting Scheme for Precipitation an
d
Sunshine (Lemesios, 2016).
Ratin
g
Preci
p
itation
(
mm
)
Sunshine
(
hrs
)
100
<15
10 or more
90
15-30
9h-9h59min
80
30-45
8h-8h59min
70
45-60
7h-7h59min
60
60-75
6h-6h59min
50
75-90
5h-5h59min
40
90-105
4h-4h59min
30 105-120 3h-3h59min
20 120-135 2h-2h59min
10 135-150 1h-1h59min
0.0
>150
<1h
Utilization of the Beach Climate Index (BCI) based on Meteorological Review to Support Tourism Development in Bangka Island
73
spatial data and temporal data as comparison, we can
estimate the beach climate in Bangka Island.
By processing spatial data and temporal data as a
support to analyze the comfort level based on
meteorological parameters in the beach areas. The
mapping results were put together based on the
characteristics of the seasons on Bangka Island
namely the DJF (December, January, February),
MAM (March, April, May), JJA (June, July, August),
and SON (September, October, November) periods.
Processing the observation data as a comparison
parameter to analyze meteorological aspects for the
comfort level. The grouping is then based on the
classification of beach climate index values
categorized as "excellent", "Very good", "Good", and
"Acceptable". With the temporal data as control,
further study regarding the level of comfort is very
easy by using BCI in knowing the exact time and
destination for your trip. Grouping based on seasonal
patterns in Indonesia aims to find monsoon
phenomena related to the comfort level of the beach
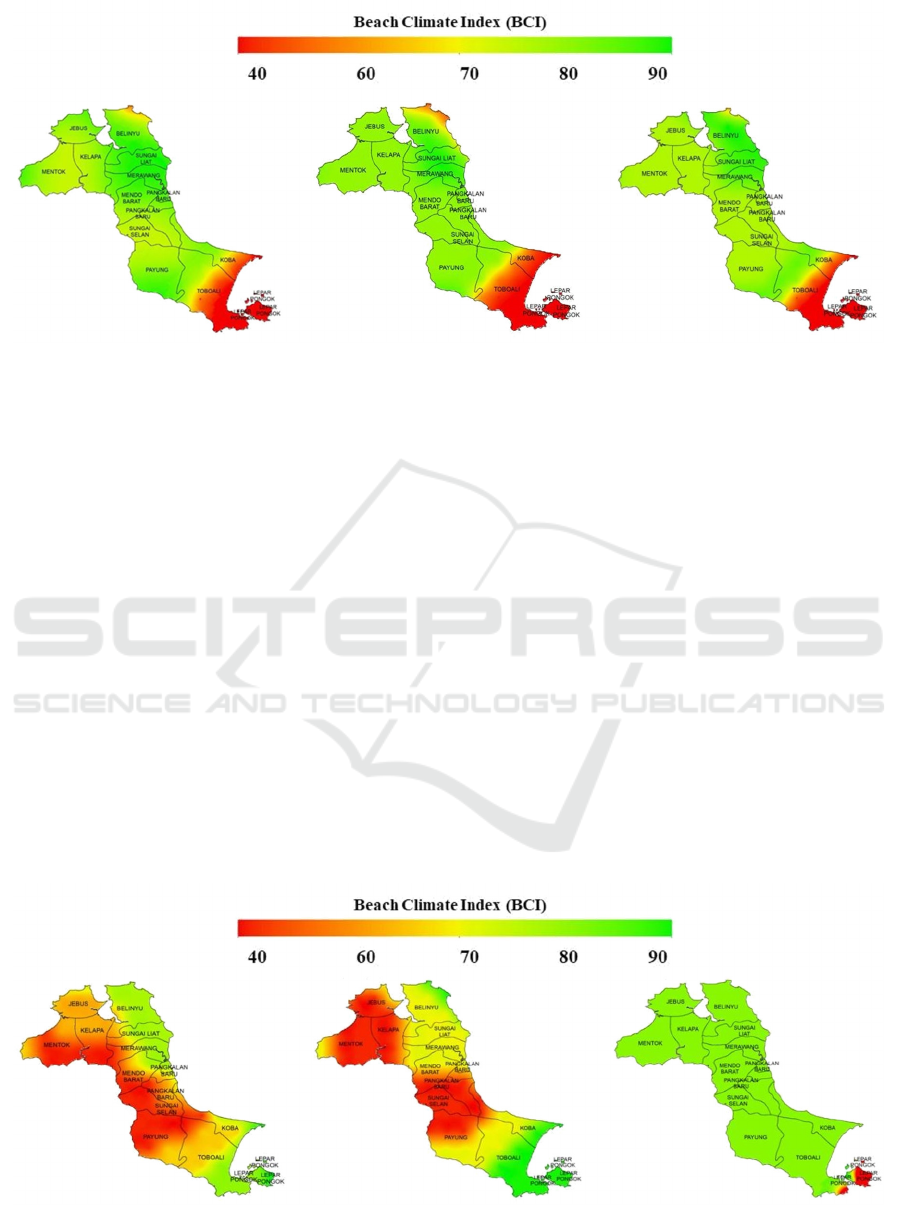
Variation of the index during the DJF period shows
an increase in the west coast, and a decrease in the
southeast coast, although the spatial data didn’t show
a significant change. While in the northeast coast
change of the mapping was not significant but tend to
show an increase especially in Belinyu.
From the results of observing data processing, the
period in the DJF month, Bangka Island is in the wet
season. Where in January is at the top of the
precipitation. From the temporal data, this period
generally is a wet season, short sunshine duration,
low effective temperature, and high humidity (See
Figure 3).
Tjasyono (2008) found that the first transition
season happened during the MAM period, where the
transition goes from wet to dry season. Based on
temporal observation as shown in Figure 4, during
this period the average monthly precipitation began to
decrease. However, in March and April, it was still
(a) Decembe
r
(b) Januar
y
(c) Februar
y
Fi
g
ure 3: S
p
atial data of
B
C
I
in Ban
g
ka Islan
d
durin
g
DJF
p
eriod.
(a) March (b) April (c) Ma
y
Fi
g
ure 4: S
p
atial data of BCI in Ban
g
ka Islan
d
, MAM.
senta 2019 - The International Conference on Marine Technology (SENTA)
74
above 150 mm. Most of the Bangka Island are in the
“Acceptable” to “Good” category, while the southeast
coastal areas are in the category “Very Good” to
“Excellent”. For Mentok, Paung, Sungai Selan,
Kelapa, and Jebus areas, the lowest BCI value is 40,
with “Acceptable” as the category, while for the
southeast coast area, Toboali, Lepar Island, the
category is in “Very Good” to “Excellent” with a BCI
value of 75-80. Changes in comfort level are
indicated by index mapping in May where almost all
the Bangka Island, almost all of its coastline was in
the “Very Good” category to “excellent” with a BCI
value 80-90. From the observation data, May is a
transition month with the lowest precipitation, 207
mm the mean sunshine duration is about 4,82 hours
with temperature at 27.4°C. Some research said that
the comfort level based on effective air temperature
also gives a good sensation for the skin (Green, 1967).
Variable of effective air temperature is a decrease
from the interaction of average temperature with the
relative humidity of an environment. In May, it has
the highest effective air temperature among other
months in Indonesia.
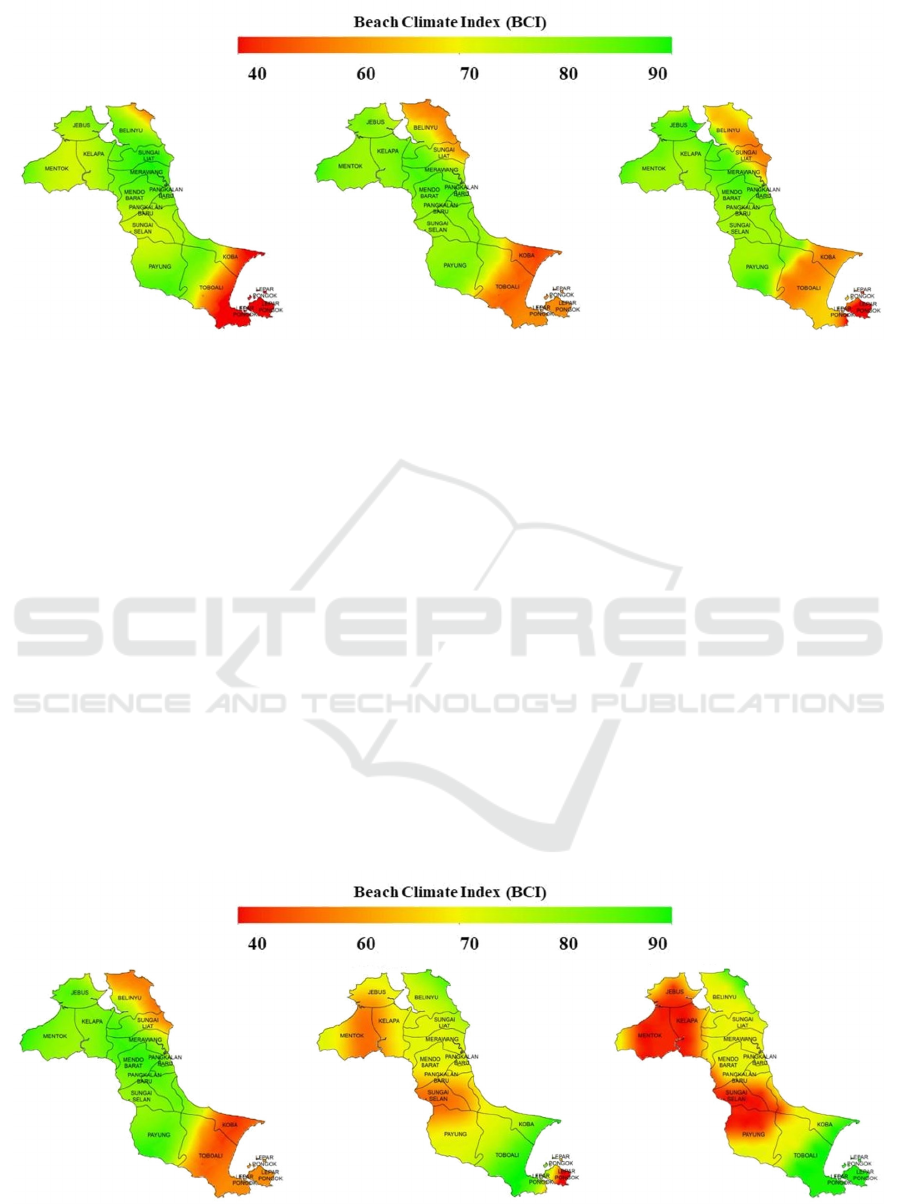
JJA period is the dry season with monsoonal
patterns. This indicates by monthly precipitation
below 150 mm. Tabel 5 shows that JJA period has the
same pattern with the previous period. The southeast
and northeast coast especially Toboali, Koba, Pulau
Lepar are in the category of “Acceptable” with BCI
value around 40-60, while the north (Kelapa) to west
coast (Jebus) and most of Bangka land is in the
category of "good" to "very good". Changes in the
BCI index are consistent with time. The index is
rising along the southeast coast and northeast Bangka.
On the west coast and northeast, the coast of
Merawang, Pangkalan Baru and southwest of Patung
experience a decrease in the index over time.
(a) June (b) Jul
y
(c) Au
g
us
t
Figure 5: Spatial data of BCI in Bangka Island, JJA.
(a) Septembe
r
(b) Octobe
r
(c)
N
ovembe
r
Fi
g
ure 6: S
p
atial data of BCI in Ban
g
ka Islan
d
, SON.
Utilization of the Beach Climate Index (BCI) based on Meteorological Review to Support Tourism Development in Bangka Island
75

From the observations of the JJA period, it tends
to provide statistical values which are also not much
different from temporal data with the weather
condition being dry with the precipitation below 150
mm and the sunshine duration about 6-8 hours/day
(see Table 5).
For the SON period, the pattern is almost the same
as in MAM because this pattern classified as the
transition months where October and November have
differences in index with other months. For August, it
still follows the condition of the previous month, JJA
where the west coast is still categorized as "Very
good". Whereas for September and November the
west coast has decreased to “Acceptable” and for the
southeast coast “Excellent”. In November, Lepar
Island are in top condition. transition and October-
November for the dry-wet transition season (see
Table 6).
4 CONCLUSIONS
Based on the data analysis it can concluded that the
BCI index (Beach Climate Index) spatially and
temporally on Bangka Island generally shows the
category of "Excellent" in June, July, August (JJA) so
it is recommended for tourists who want to visit
Bangka Island during the dry season.
ACKNOWLEDGEMENTS
We acknowledge, European Centre for Medium-
Range Weather Forecasts which develop and
compute ECMWF ERA-Interim for reanalysis file
data and also Pangkal Pinang Class I Meteorological
Station for observation data (meteorological
parameters).
REFERENCES
Auliciems, A., & Szokolay, S., (2007), PLEA Note 3:
Thermal comfort.". Brisbane: PLEA in association with
Department of Architecture University of Queensland.
Bangka Belitung Culture and Tourism
Department, 2010,
https://www.babelprov.go.id/content/dinas-
kebudayaan-dan-pariwisata.
Eugenio, J.L., and Campos, J.A., (2010), Climate in the
region of origin and destination choice in outbound
tourism demand. Tour. Manag, 31, 744–753.
Gössling, S.; Scott, D.; Hall, C.M.; Ceron, J.P.; Dubois, G.,
(2012), Consumer Behaviour and Demand Response of
Tourists to Climate Change. Ann. Tour. Res, 39, 36–58.
Green, J.S.A., (1967), Holiday meteorology: reflections on
weather and outdoor comfort. Weather 22: 128-131.
Habibi, A., Adi W., and Syari, I.A., (2017), Kesesuaian
Wisata Pantai untuk Rekreasi di Pulau Bangka, Jurnal
Sumberdaya Perairan, Vol.11 no 1.
Houghten, F. C., McConnel, W. J., & Yagloglou, C. P.,
(1923), The Human Organism and hot Environment.
Trans. Amer. Soc. Heat & Vent. Engrs.
Hu, Y.; Ritchie, J, (1993), Measuring destination
attractiveness: A contextual approach. J. Travel Res,
32, 25–34.
Lemesios, G., Giannakopoulos, C., Papadaskalopoulou, C.,
Karali, A., Varotsos, K., Moustakas, K., … & Loizidou,
M., (2016), Future heat-related impact assessment of
tourism industry to climate change in Cyprus. Reg
Environ Chang, 16, 1915-27.
Morgan, R., Gatell, E., Junyent, R., Micallef, A., Özhan, E.,
and Williams, A.T., (2000), An improved user-based
beach climate index, Journal of Coastal Conservation,
6, 41-50.
Priambudi, P, (2013), Pengaruh Destination Image
Terhadap Behavioral Intention Wisatawan Nusantara di
Pulau Belitung, Universitas Pendidikan Indonesia.
Scott, D and Lemieux, C., (2010), Weather and Climate
Information for Tourism. Procedia Environ. Sci, 1,
146–183.
Sumargana, (2004), Industri Pariwisata dan Pembangunan
Nasional, Magistra, No. 48, Th. XVI, Maret, 1.
Swarbrooke, (1996), Tourism Development, New York:
Van Nostrand Reinhold.
Tjasyono, H. K., B., (2008), Meteorologi Terapan,
Bandung, ITB.
senta 2019 - The International Conference on Marine Technology (SENTA)
76
