
Stress Concentration Analysis on Ship Plate with Hole using
Numerical Approach
Mohammad Nurul Misbah
1,a
, Dony Setyawan, Totok Yulianto, Rizky Chandra Ariesta,
andWing Hendroprasetyo Akbar Putra
1
Department of Naval Architecture, Institut Teknologi Sepuluh Nopember, Indonesia
Keywords: Numerical, Plate, Ship, Stress Concentration.
Abstract: The selection of construction firms affects the stress that occurs on the ship. Stress concentration on the
construction of the vessel is caused by the load when the ship is operating. A tensile test used to verify the
material strength and obtain the maximum stress range that could work on the ship material. In this study,
the analysis is conducted to determine the stress concentration of perforated plate stress on the ship. This
analysis uses numerical calculation methods and validates with analytical. Based on these results, the
approach might use to validate and applied for other shapes.
1 INTRODUCTION
Stress is a factor needed to calculate details when
designing ship construction. In its operation, the ship
is subject to stress due to a load of ocean waves. Stress
work on ship occurs at some point. Stress gradients
that have a small area with a dominant red colour
called a stress concentration. The stress concentration
carries out in the hotspot area. The effect of stress on
the hotspot may result in fatigue. Fatigue occurs due
to the influence of size, shape, and location rather
than damage. Stress distribution around the hole is
shown in Figure 1.
Figure 1: Distribution of stress concentration.
Simple construction of a ship was studied to
observe the occurrence of failures with crack
applications. This research aims to obtain the
difference between the numerical and analytical
methods. Thus, these results can be applied as a
reference in applying the size, shape, and location of
the damage to avoid stress concentration.
2 LITERATURE REVIEW
In general, the stress concentration occurs due to
tensile load and other factors that fail ship
construction. Damage is assumed to be holes that
cause stress concentration concentrations (Belamri,
2009). Stress concentration area could create to
reduce the stress concentration of the critical area
(Vable, 2010). Cracks were observed during
operation to predict construction life. From the
observations, the stress concentration increases in
proportion to the magnitude of the damage (Ogeman
and Mao, 2014). Previous research analyses plates
applicated with axial load conditions. Investigations
of the load carry out to prevent failure. Axial load
failure occurs in the stress concentration area. The
development of damage measurement was an early
stage to measure the magnitude of the stress. The
stress that occurs is measure in a certain period. This
study aims to prevent the stress concentration that
occurring on the plate with a hole. (Gokul, Kuriakose
and Kurian, 2016). Some cases of failure occur in
detailed construction so a simple form of construction
is required taking into account strength requirements
Misbah, M., Setyawan, D., Yulianto, T., Ariesta, R. and Putra, W.
Stress Concentration Analysis on Ship Plate with Hole using Numerical Approach.
DOI: 10.5220/0010855200003261
In Proceedings of the 4th International Conference on Marine Technology (senta 2019) - Transforming Mar itime Technology for Fair and Sustainable Development in the Era of Industrial
Revolution 4.0, pages 117-121
ISBN: 978-989-758-557-9; ISSN: 2795-4579
Copyright
c
2022 by SCITEPRESS – Science and Technology Publications, Lda. All rights reserved
117
(Sujiatanti et al., 2018). Most of the cracked damage
to structural fatigue occurs under repeated loads. A
Crack has appeared on a plate that has a large stress
intensity. Stress concentration calculation is required
to evaluate crack on ship construction (Takaki and
Gotoh 2020). Based on several variations in this
study, an evaluation of the stress concentration was
carried out to obtain the stress concentration factor in
each variation of the holes on the plate. This hole
represents a detailed form of construction on a ship,
for example, dry holes, scallops, and manholes. The
construction details are an important part that serves
to reduce stress.
2.1 Working Load
In this research, the tensile load applies to determine
the stress distribution that occurs. This condition is
following where the plates on the ship experience
tensile and compressive stresses. The load is applied
on the model. The load condition is placed at the end
of the plate and clamped at the other end.
2.2 Stress Concentration
The stress concentration factor (K) is a
nondimensional value applied to measure the
concentration of stress that occurs in the material.
Stress concentration can also be mentioned as a stress
riser. The maximum nominal stress occurs on section
a-a, which is taken through the bar’s smallest cross-
sectional area shown in Figure 2.
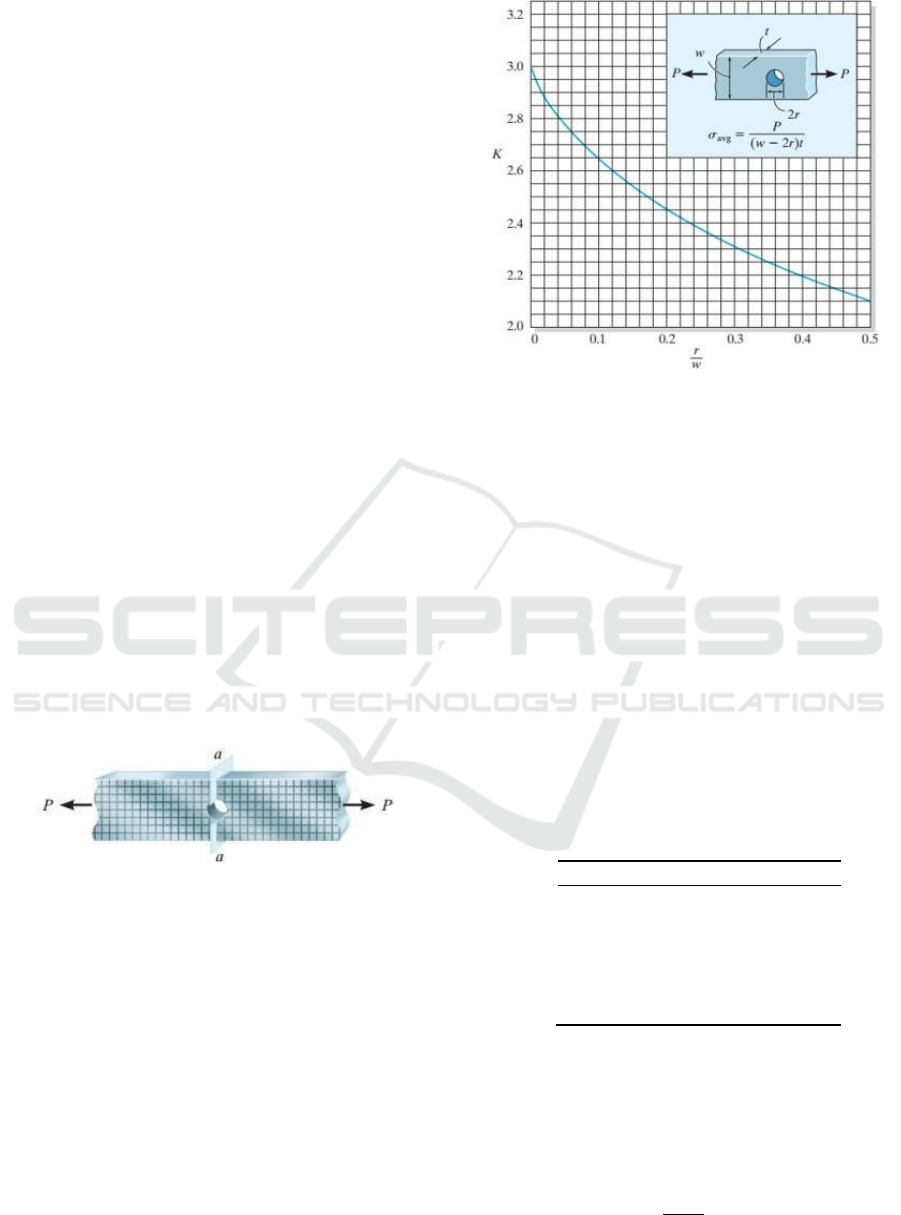
Analytically, stress concentration calculation on
the perforated plate has been approached using
several variations and resulted in value for the stress
concentration factor on the perforated plate. The
stress concentration factor is influence by the ratio of
the plate width and the hole diameter. Where the large
hole gives different behaviour to the K value is all
created the table scheme shown in Figure 3.
Influence value of K by the radius and width
where the closer the ratio value to 0, the greater the
stress concentration.
3 METHODOLOGY
The method in this research is numerical and
validated with analytical solutions. The numerical
method is developing to obtain the interaction of the
load conditions, shape, and size of the hole so that the
stress concentration factor. Furthermore, compare the
results of the stress concentration factor to know the
difference in error between the two methods is seen.
The model analysed is a plate with a length of 300
mm and a width of 50 mm. The variation of the holes
in the centre of the plate is determined according to
the reference ratio (Hibbeler 2011). Some of the
variations are shown in Table 1.
Table 1: Variations of radius.
N
o w(mm) r(mm) r/w
1
50
0
0
2
50
5
0.1
3
50 10 0.2
4
50 15 0.3
5
50 20 0.4
6
50 25 0.5
Based on these variations, the stress concentration
is calculated using the equation below. The stress
concentration factor is determined as the ratio of the
maximum stress (σ
max
) is divided by nominal stress
(σ
nom
), which can obtain follows Equation (1).
𝐾
𝜎
𝜎
(1)
Figure 2: Tensile force working principle.
Fi
g
ure 3: Ratio of stress concentration.
senta 2019 - The International Conference on Marine Technology (SENTA)
118
The nominal stress is made from the total load by
neglecting the concentration areas such as the hole.
The approximate stress in the centre of the plate width
is solved by equation (1). The nominal stress value is
obtaining from the force (F) divided by the cross-
sectional area (A) as in Equation (2):
𝜎
𝐹
𝐴
(2)
Area (A) obtained from the cross-sectional width of
the plate. Then the value of K can be determined by
Equation (3) by (Young and Budynas, 2002).
𝐾
3.003.13
2𝑟
𝐷
3.66
2𝑟
𝐷
1.53
2𝑟
𝐷
(3)
The approach used the above equation to get the
stress concentration. Where the stress concentration
depending on the ratio of the width and diameter of
the hole. The results of the large stress concentration
factor on the plates were then analysed by numerical
methods. The development of the numerical method
is carried out in several stages. Numerical modelling
is develops using the finite element method (Misbah,
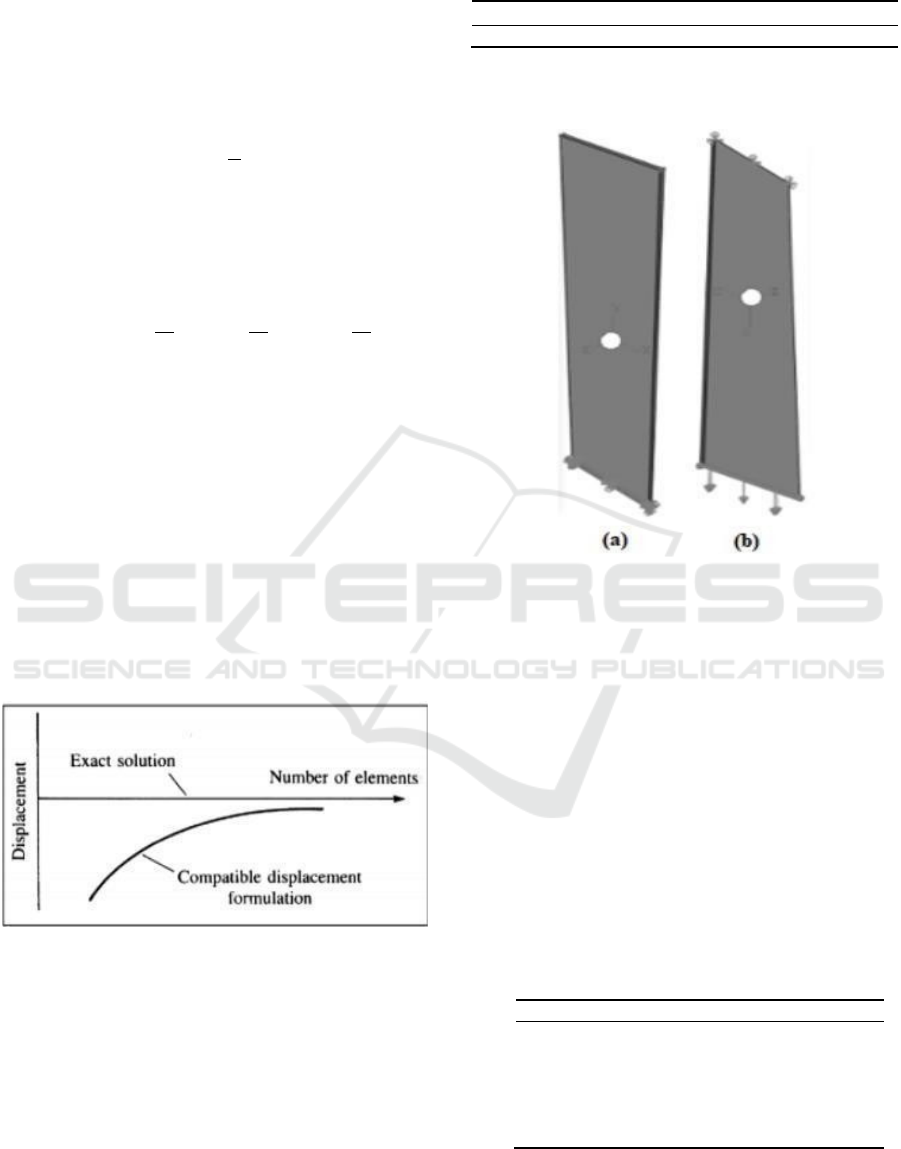
et al. 2018). In the analysis, obtaining a good
accuracy required the convergence of studies by
changing the element size to obtain great result. The
relationship between the number of elements and the
accuracy of the results presented in Figure 4
Figure 4: Convergency study.
The results will begin to stabilize and not be
affected by the change of elements in range size and
amount of element (Logan, 2011). The initial stage is
modelling each variation of the model to determine
the amount of stress that occurs. This modelling aim
is to simplify the experimental process. Then, the
numerical results are validated by analytic
calculations. A model made of steel with material
properties such as properties used as density (ρ),
Young’s modulus (E), and Poisson’s ratio presented
in Table 2. Model is defined in Figure 5 (a) left and is
the boundary condition (b) right.
Figure 5: (a) Model and (b) Boundary condition.
Furthermore, meshing was carried out to obtain
convergent results and continued in the analysis of the
results.
4 RESULTS AND DISCUSSION
The calculation design of variation hole radius and
the length ratio determine using equation (3) to obtain
the stress concentration factor (SCF). Theoretically,
the stress concentration factor is proof. That is a show
from the big will decrease the value of the stress
concentration. The results of the analysis of analytical
calculations are presented in Table 3.
Table 3: Stress concentration factor (K1) analytical.
r
(
mm
)
r/w
K
1
0 0 3
5
0.1 2.595
10 0.2 2.375
15 0.3 2.25
20 0.4 2.15
25 0.5 2.08
Table 2: Material properties of steel.
Materials
ρ
(k
g
/m3) E (MPa)
υ
Steel 7850 2.06 x 10
5
0.3
Stress Concentration Analysis on Ship Plate with Hole using Numerical Approach
119
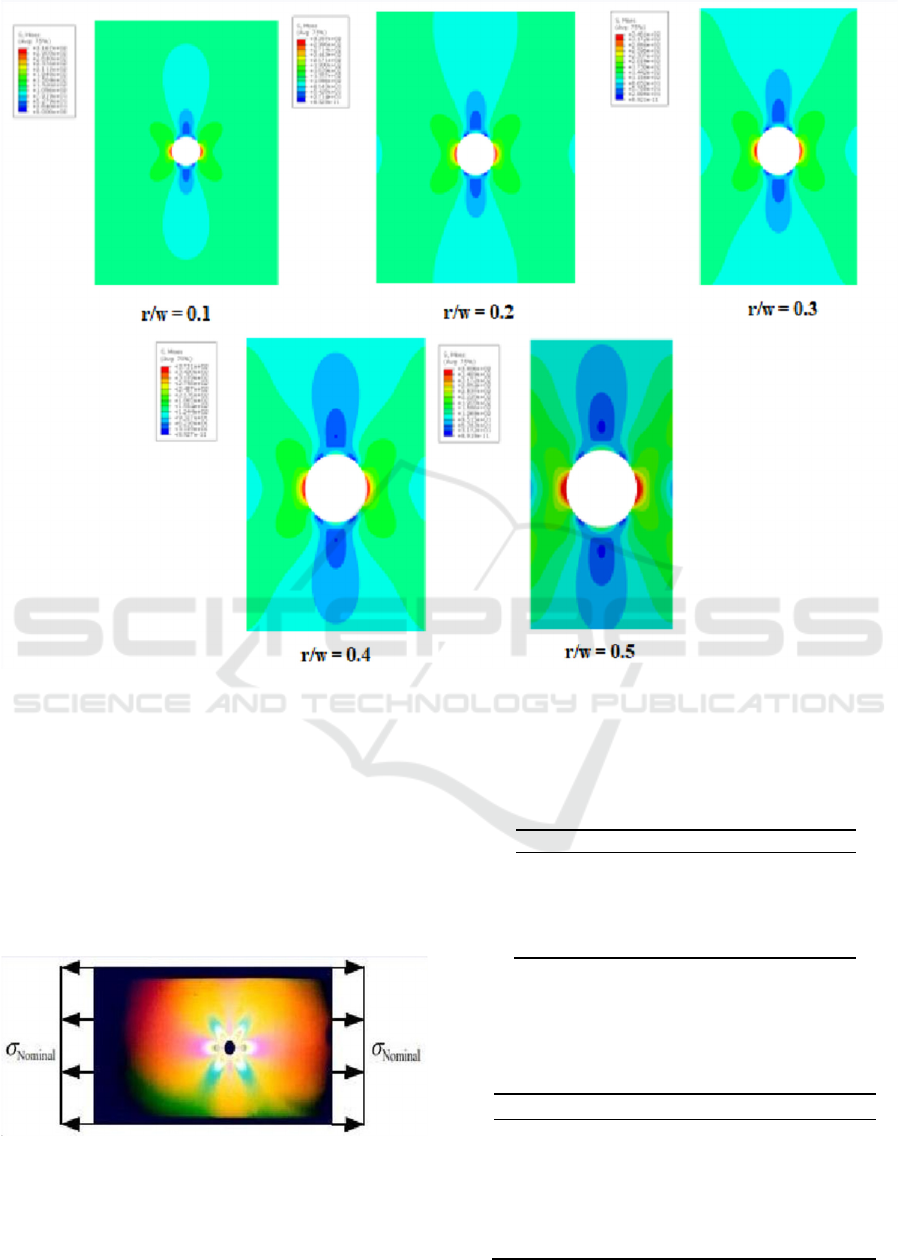
Based on this result, a numerical simulation is
performing to ensure that these results be good.
Obtained stress contours from the simulation results
are then processed to obtain the stress concentration
factor. The results of the simulated stress distribution
are shown in Figure 6. The stress concentration is
centre on the left and right sides of the hole due to the
working tensile load. The resulting contours in
numerical analysis are the same as in Figure 7.
Figure 7: Contour of the stress concentration (Vable, 2010).
Values of stress in Table 4 are using to input in the
equation for calculations. That calculation produces
the value of the stress concentration factor using
Equation (1).
Table 4: Maximum stress value.
Type Max Stress (MPa)
1
st
Variation 316
2
nd
Variation 326
3
rd
Variation 346
4
th
Variation 373
5
th
Variation 380
The stress distribution on the side of the plate
is shown in Figure 8. The resulting stress distribution
Figure 6: Stress concentration in numerical simulation.
Table 5: Stress concentration factor (K1) numeric.
r(mm)
𝑟
𝑤
⁄
K
2
0 0 3
8.4 0.16 2.57
10.3 0.205 2.49
13.9 0.278 2.38
17.5 0.35 2.28
25 0.5 2.16
senta 2019 - The International Conference on Marine Technology (SENTA)
120
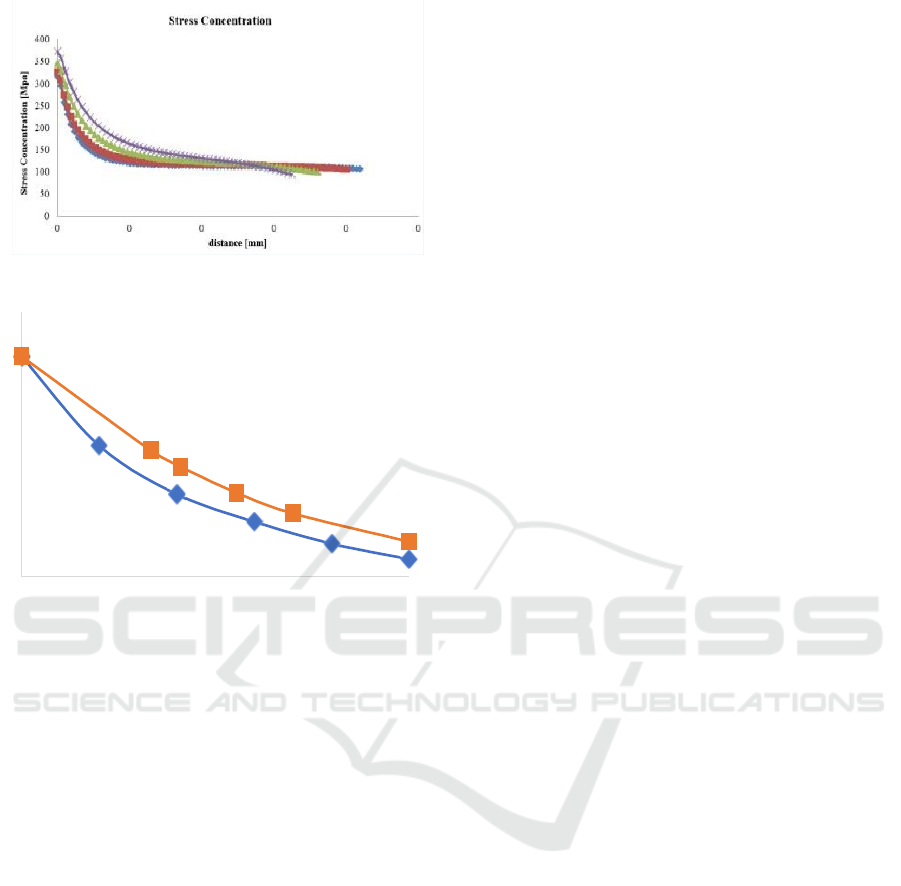
is numerically high in the vicinity of the hole and
decreases toward the edge of the plate. That same
with Figure 1 above. Finally, from the resulting stress,
SCF calculations are carried out so that the values
presented in Table 5 are obtained. That comparison of
results from the analytical and numerical formula
references is present in Figure 9. If attention to the
results of the numerical approach, the graph tends to
be the same. So that result can be said to be valid with
a difference of error below 2%.
5 CONCLUSIONS
Based on the analysis of the analytical and numerical
methods approach with the finite element method.
This technique allows it to use in other structural
forms with the addition of various load conditions.
The SCF value resulted in an error below 2% for all
variations. In the future, additional experiments need
to make sure the results correct.
REFERENCES
Belamri, S., Tamine, T., Nemdili, A. 2009. “Experimental
and Numerical Determenation of Stress Intensity
Factors of Crack in Plate with a Multiple Holes.”
Damaged and Fracture Mechanics: Failure Analysis of
Engineering Materials and Structures 285 – 295.
Gokul, P.V., Bennet Kuriakose, and Salini Theres N
Kurian. 2016. “Numerical Analysis of Thin Plates with
Holes.” Applied Mechanics and Materials 154-158
Hibbeler, R. 2011. Mechanics of Materials Eight Edition.
United Stated: Pearson Prentice Hall.
Logan, Daryl L. 2011. A First Course in the Finite Element
Method. 5th. Kanada: Cengage Learning.
Misbah, Muhammad Nurul, Septia Hardy Sujiatanti, Dony
Setyawan, Rizky Chandra Ariesta, and Satriyo
Rahmadianto. 2018. “Structural Analysis on the Block
Lifting in Shipbuilding Construction Process.”
MATEC Web of Conference. Surabaya: EDP Sciences.
1 - 6.
Ogeman, Viktor, and Wengang Mao. 2014. “Uncertainty in
Stress Concentration Factor Computation for Ship
Fatigue Design.” Proceedings of the ASME 2014 33rd
International Conference on Ocean, Offshore and
Arctic Engineering (OMAE). San Fransisco, USA:
ASME.
Sujiatanti, Septia Hardy, Totok Yulianto, Wing Prasetyo
Akbar Putra, and Rizky Chandra Ariesta. 2018.
“Influence of the Cut-out Shape on the Fatigue Ship
Structural Detail.” 6th International h International
Seminar on Ocean and Coastal Engineering,
Environmental and Natural Disaster Management.
Surabaya: SCITEPRESS. 111 -115.
Takaki, Yoshifumi, and Koji Gotoh. 2020. “Approximate
weight functions of stressintensity factor for a wide
range shapes of surface and an embedded elliptical
crack.” Marine Structures 70: 1 -22.
Vable, Madhukar. 2010. Mechanics of Materials second
Edition. Michigan: Michigan Technological University
Young, W.C., and R. G. Budynas. 2002. Roark's Formula
for Stress and Strain 7th Edition. United States:
McGraw -Hill.
Figure 9: SCF Analytical vs Numerical.
Figure 8: Stress distribution along path.
Stress Concentration Analysis on Ship Plate with Hole using Numerical Approach
121
