
Fleet Planning Scenarios as an Impact of Changing the Export Policy
on Cost, Insurance and Freight: A Case Study of Indonesian Coal
Export
Firmanto Hadi
1,a
, Siti Dwi Lazuardi
b
, Irwan Tri Yunianto
c
, Dika Virginia
d
, and Dhany Herdiansyah
e
1
Department of Marine Transportation Engineering,
Institut Teknologi Sepuluh Nopember, Indonesia
e
dhanyherdiansyah7@gmail.com
Keywords: Coal Export, Cost Insurance and Freight, Fleet Planning, Free on Board, Shifting Term of Delivery.
Abstract: Indonesia is one of the world’s largest coal producers and exporters with total number of production and
export in 2017 are 271 million ton (rank-5) and 17,9 million ton (rank-2) respectively. However, Indonesian
coal export has been dominantly carried by foreign vessels, so that it effects on decreasing national fleets
usage in the export activities. In order to enhance the participation of national fleets on the export activities,
Indonesian government created a policy to change the terms of delivery on coal export from free on board
(FOB) to cost insurance and freight (CIF). Therefore, the coal export should be transported by national fleets.
The problem is total national fleets could merely control 3% of total coal export transportation. Hence, this
study aims to compare FOB and CIF term on Indonesian coal export and to determine the optimum fleet
planning required to support national fleets with three scenarios: (1) ship chartering, (2) second-hand ship
purchasing, and (3) new ship building. The method used for determining new ship building is optimization
by finding the optimum vessel size that produces the cheapest required freight rate (RFR). The analysis result
obtained that for the coal export from Muara Pantai to Port of Guangzhou with total demand of 9,360,000
tons per year, it required 6 bulk carriers of 67,452 DWT with the lowest RFR of $. 4.26 per ton.
1 INTRODUCTION
Indonesia is one of the world’s largest coal producers
and exporters with total number of production and
export to China, India and Japan in 2017 are 271
million ton (rank-5) and 17.9 million ton (rank-2)
respectively.
The government establishes regulations through
the Minister of Trade regarding the export and import
activities of certain commodities. Export activities are
listed in the Regulation of the Minister of Trade of the
Republic of Indonesia no. 82 of 2017 article 3
paragraph (1) which requires exporters of coal or
Crude Palm Oil (CPO) to use sea transportation
controlled by national sea transportation companies
and in article 4 paragraph (1), exporters in insuring
coal export commodities or CPO are obliged to use
insurance from a national insurance company
(Permendag, 2017). Sea transportation controlled by
a national sea transportation company is sea
transportation owned by a national shipping company
and has an Indonesian flag, not under a lease from a
foreign shipping company. This regulation was
enacted on 26 October 2017 and will be implemented
6 (six) months later, namely on 26 April 2018. If
exporters do not comply with these rules, they will be
subject to administrative sanctions in the form of
suspension of permits or revocation of permits. This
regulation is the government's effort to increase the
competitiveness of the national shipping industry in
the international world.
Responding to this, the Indonesian Coal Mining
Association (APBI) considers this regulation to be
burdensome for coal export activities. According to
Hendra Sinadia (Chairperson of APBI), the use of
national vessels can hamper coal exports because the
availability of export transportation is still limited and
coal companies use more foreign ships with a free on
board (FOB), accounting for 80% of Indonesia's coal
export activities (Benarto, 2016).
Currently, national shipping companies only
control 3% of coal export transportation (Yunianto,
Lazuardi, & Hadi, 2018). Due to the high number of
Indonesian coal exports, while the use of the national
Hadi, F., Lazuardi, S., Yunianto, I., Virginia, D. and Herdiansyah, D.
Fleet Planning Scenarios as an Impact of Changing the Export Policy on Cost, Insurance and Freight: A Case Study of Indonesian Coal Export.
DOI: 10.5220/0010854700003261
In Proceedings of the 4th International Conference on Marine Technology (senta 2019) - Transforming Maritime Technology for Fair and Sustainable Development in the Era of Industrial
Revolution 4.0, pages 63-70
ISBN: 978-989-758-557-9; ISSN: 2795-4579
Copyright
c
2022 by SCITEPRESS – Science and Technology Publications, Lda. All rights reserved
63

fleet is still limited, it is necessary to plan a vessel so
that the national shipping company is able to meet the
demand of coal exports.
2 METHODOLOGY
The first analysis compares the existing FOB to the
projected CIF. Both apply the identical term, Free on
Board (FOB). There are four phases of analysis
1. Selecting the port of origin (Mara Pantai Port,
East Borneo) and the port of destination
(Guangzhou Port, China),
2. Comparing FOB to CIF that obtained through
required freight rate (FRF),
3. Obtaining RFR of FOB from the coal mining
company and RFR of CIF from the calculation,
4. Determining the total shipping cost of CIF on the
certain route. In fact, the total shipping cost of CIF
equals to FOB due to the similar shipping cost
components.
The second analysis conducts a calculation on
fleet planning for coal export, as follows
1. Collecting the existing national ship data that
serve coal export activities,
2. Gathering the second-hand ship data, which serve
coal export activities,
3. Calculating the ship’s main size in order to obtain
the optimum RFR through optimization method,
4. Computing cost and RFR calculation for each
scenario,
5. Determining the number of ships where have the
lowest RFR,
6. Conducting the sensitivity analysis.
The scenario analysis conducted on the study
1st Scenario: Ship chartering
The number of national shipping as the main object is
20 units in various size. In this scenario, the RFR
calculation includes time charter hire (TCH), voyage
cost, and cargo handling cost. In addition, the charter
rate depends on the fixed costs; both capital and
operational cost (Lazuardi, 2017).
2nd Scenario: Second-hand ship purchasing
Purchasing 15 unit of ships in various size. The
capital cost is obtained through the price and their size
(Blank, 2008). Furthermore, the ship price is various
depended on their size and year of establishment.
3rd Scenario: New ship building
The total cost of new ship building consists of capital
cost, operational cost, voyage cost and cargo handling
cost (Stopford, 2009). Ship building calculation is
required when the capacity of existing ships unmet
the demand. The ship size: Length between
Perpendicular (Lpp) is optimized using the Nonlinear
Programming method (Santosa & Willy, 2011).
There are three main components in optimization
model, the objective function, constraints and
decision variables. Therefore, Solver in Microsoft
Excel is used to find the optimal solution.
Mathematical Model
With the development of formulations, the following
is a mathematical model that is created and must be
implemented in the software in the Microsoft Excel
called Solver. The equation used to determine the
total cost is as follow:
𝑇𝐶 𝐹𝐶 𝑉𝐶 𝑃𝐶
(1)
Objective Function
Min 𝑅𝐹𝑅
𝑇𝐶
𝐷
(2)
Where:
𝐹𝐶 𝑆
𝑃
(3)
𝑆𝑐
𝑃
𝑆𝑇
𝐿𝑃𝑃 𝐵 𝐷
𝐴
𝐶
𝑆𝑇
𝑈
𝐸
(4)
𝑃𝑐 𝐷
𝐶
𝑃𝑖
𝐶
𝐸𝑀
𝐶
𝑅
𝑒
𝑀
𝐶
Tax (5)
𝑉𝑐 𝑆
𝑜𝐶
𝑆
𝑣𝐶
𝑃
𝑜
(6)
𝑆
𝑛
𝑆
𝐸𝑀𝐶
𝑇𝐷𝐹𝑊
𝑐
(7)
𝑆
𝑀𝐸
𝑐
𝐴
𝐸
𝑐
(8)
𝑀𝐸
𝑛𝑀𝐶𝑅 𝑆𝐹𝑂𝐶 𝑡
𝑠
𝑃
𝑀𝐹𝑂
(9)
𝐴
𝐸
𝑛
𝑀𝐶𝑅
𝑆𝐹𝑂𝐶
𝑡𝑠
𝑡𝑝
𝑃𝐷𝑀𝑂
(10)
𝑃𝑂
𝑛
𝐴
𝐵𝑀
𝑐
(11)
Decision Variable
LPP (Length between Perpendicular)
Constraints
Operational efficiency and effectiveness of ports or
𝐿𝑃𝑃
> 0;
𝐿𝑃𝑃
𝜖
1, 2, 3 …
𝑥
𝑖𝑗
≥
𝐷
ℎ
𝑗
×(
𝑡
𝑠
+t
𝑝
)
𝑇𝑠 ≤ 𝐿𝑊𝑆
senta 2019 - The International Conference on Marine Technology (SENTA)
64
𝐿𝑃𝑃 ≥ 𝐿𝑃𝑃 𝑚𝑖𝑛
𝐿𝑃𝑃 ≤ 𝐿𝑃𝑃 𝑚𝑎𝑥
𝐷 ≤ 𝐾
𝑎
× 𝐹
𝑑
Descriptions:
RFR : Required Freight Rate
TC : Total cost in a year
D : Demand (ton/year)
T : Ship Draft (meter)
Tp : Port Draft (meter)
Ka : Cargo Handling Capacity (ton)
Fq : Frequency
3 GENERAL AND LITERATURE
REVIEW
3.1 Coal Mining Industries
Coal production in Indonesia is dominated by Low to
Medium Calories coal, such as bituminous, sub
bituminous, and briquettes. The tendency of coal
production is increasing during the past 10 years. The
highest amount of coal production was in 2013, 474
million ton. Most of the use of the coal was providing
the export demand. In 2017, the amount of coal
production reached 97 million ton, climbed 7.2% by
the previous year and surged to 364 million ton, 5%
increasing in 2016. The Indonesia's Ministry of
Energy and Mineral Resources said that the
production level in 2018 rocketed was caused by
many small-scale business licenses that have been in
the exploitation period.
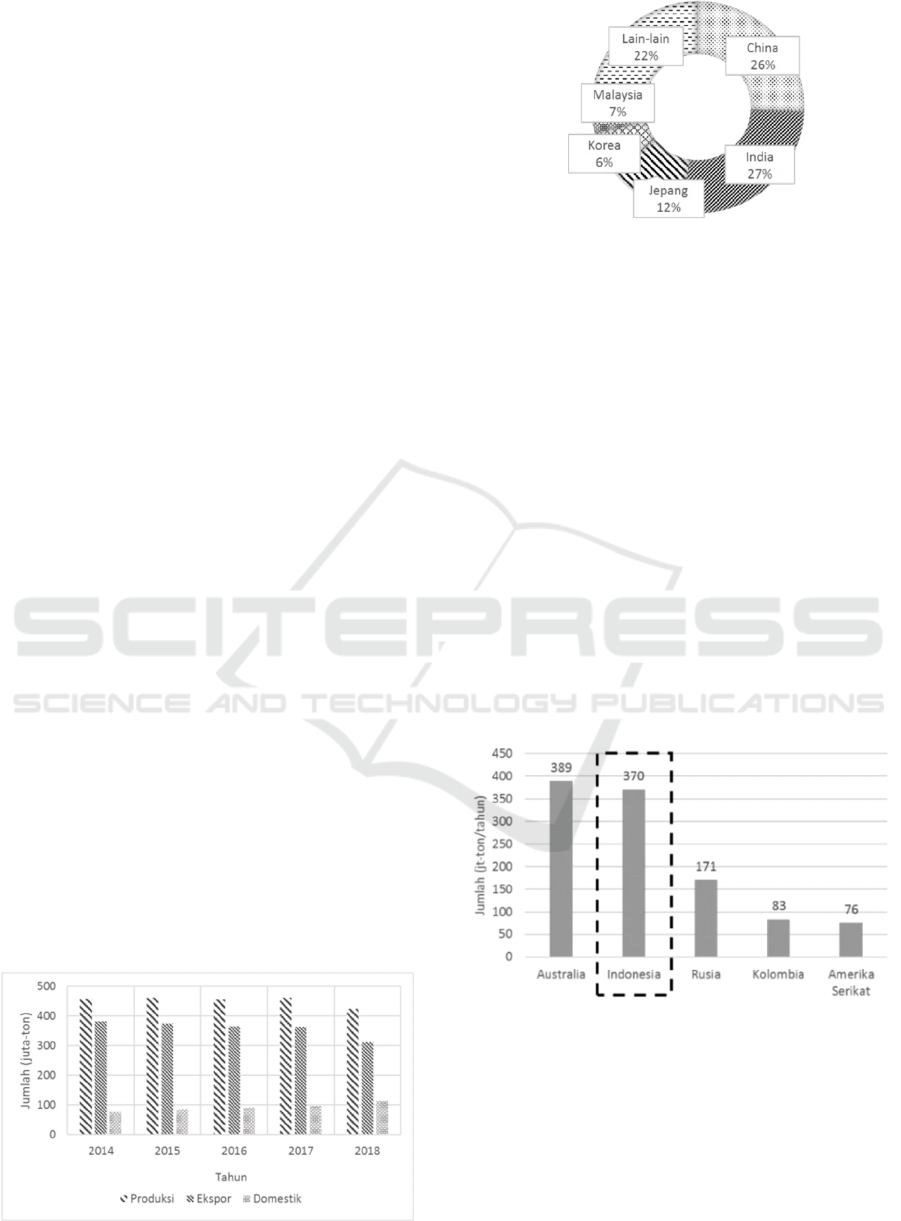
3.2 Coal Importer Countries
The countries in Asia that yield the highest amount of
coal are China, Japan, India, Korea, and Taiwan. The
biggest importer is China that yielded 255 million
tonnage in 2016. In addition, the importers for
Indonesia are China, Japan, South Korea, and
Figure 1: The amount of coal production in Indonesia.
Figure 2: Importer countries for Indonesia (tonnage per year).
Malaysia (International Trade Centre, 2015).
According to The Indonesia's Ministry of Energy and
Mineral Resources, in 2017, China, India, South
Korea and Malaysia imported 31.5 million tonnage,
40 million tonnage, 7.7 million tonnage and 7.8
million tonnage, respectively.
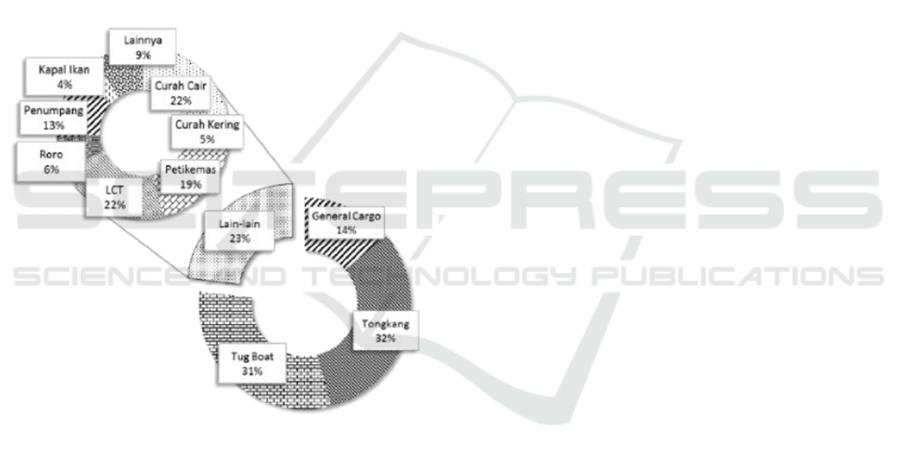
3.3 Coal Exporter Country
According to the International Energy Agency in
2017, Australia is the top country that yields 389
million-ton coals (26.5% out of world’s total coal
production). The second country is Indonesia, 370
million ton (24% out of world’s total coal
production). In the third place, Russia yields 171
million ton. Lastly, in 2016, the 10 biggest coal
exporters contribute 95% of coal production in the
World. The amount of coal export in Indonesia
increased by 0,9% in 2016, from 368 million ton to
365.7 million ton.
Figure 3: Coal exporter.
3.4 Coal Fleet by National Company
Currently, the number of carriers in Indonesia is 27,500
units according to the Ministry of Transportation. The
Indonesian ship such as dry bulk and barge have been
continuously operated to fulfil the domestic demands.
In consequence, Indonesian ship has the small
percentage of fulfilling the export demand, since there
Fleet Planning Scenarios as an Impact of Changing the Export Policy on Cost, Insurance and Freight: A Case Study of Indonesian Coal
Export
65
are few numbers of ships, 50 units. Recently, only 3%
of national fleet are operated for coal carrier while the
rest, 97%, managed by international ship (Yunianto,
Lazuardi, & Hadi, 2018).
3.5 The Port of Origin and Port of
Destination
The study case on this research is the export of coal
from Muara Pantai, East Borneo to Guangzhou port,
China. There are three mining areas, Sambarata, Lati,
and Binungan. From Lati, Coal are produced for
brand Agathis and Sungkai. The coal reserved in this
area is 465 million ton. Coal is excavated with a
hydraulic excavator and loaded on trucks. From this
mining area, the coal is transported to the installation,
11 km, through a well-established road on any
weather, then stocked in the stockpile before loaded
into the barge.
Figure 4: The percentage of Indonesian fleets.
The destination port in China, Guangzhou port
which established in 2004, has 14 coal terminals, with
the result that it could manage 60 million ton in a year.
In 2010, the port could handle 410 million ton of
cargo in which it was nominated as the 5th busiest
port for non-container handling and the 7th best port
for container handling (UNCTAD, 2015). Moreover,
one of terminal is Xinsha (14,4-meter depth) on the
fresh water. So that, the ship that aim to conduct
loading and discharging is restricted to the maximum
of 85,000 DWT.
4 ANALYSIS AND RESULTS
4.1 Introduction
The result of this research on the coal trade is the
optimum fleet planning in terms of cost analysis on
charter, ship building and second-hand ship through
national shipping company which fulfils the
international coal demand.
4.2 Existing Coal Export in Indonesia
In today’s world, 80% of shipping contract apply the
FOB as the term of delivery in where the exporter
pays the cost of marine freight, insurance, discharging
and transportation from the arrival port to the final
destination. Besides, the CIF term in export- import
increases the role of companies with Indonesian legal
status and assists increasing foreign exchange
through taxes.
Coal export in Indonesia is carried by bulk carrier
from Muara Pantai, East Borneo to Guangzhou port,
China for 1,424 nm. The loading-discharging
activities in Muara Pantai utilises the floating transfer
solution (speed 40,000 tonnage/day). In addition, dry
bulk carrier is operated to transport coal using the
FOB delivery term. The size of the dry bulk carrier is
65,000 DWT with RFR $4-$4.5 per tonnage.
4.3 FOB and CIF Comparation
Calculation model used in this research can be
utilized to calculate freight on other routes on
domestic coal demand. The freight excludes the profit
margin, called require freight rate (RFR).
Ship operations determine the cost required in the
transportation process. There are 2 (two) types of
time, when ship is berthing and sailing. The vessels
time conducting activities in the port is called port
time, whereas the time spent vessel on the sea (origin
to destination) is called sea time. Port time includes
waiting time, approaching time, and berthing time.
Sea time calculation is obtained from the division
between the distance travelled (s) with the speed of
the vessel (v). Meanwhile, the speed of the ship is
determined by laden and ballast condition. Port time
distance travelled (S) and sea time (s) are the time are
required to export the coal in one roundtrip.
senta 2019 - The International Conference on Marine Technology (SENTA)
66

Table 1:Roundtrip time.
Sea time
(
roundtri
p)
219.08 Hours
10.00 Days
Port time
Origin
38.71 Hours
2.00 Days
Destination
57.71 Hours
3.00 Days
Roundtrip
315.5 Hours
14.00 Days
The demand (D) of coal in China is 9,360,000 ton
per year and the payload is 64,519 ton. Therefore, the
trip frequency (Fd) can be counted by 146 times
(divided payload by demand) and the operation days
(Ho) in a year is 330 days, 1 ship is required (RTD)
14 days in one roundtrip. So that, the frequency (Fa)
of the ship obtained by divide Ho by RTD is 24 times.
Besides, to count the number of ships required, 7
unites with the size of 65,000 DWT; 80% of
utilization, can be counted by divide Fa by Fd in a
year.
Furthermore, charter rate can be found through
some calculations: capital cost, operational cost and
freight. Time charter charged the charterer in the time
charter scheme during certain period, 1 (one) year in
this study. The total of capital and operational cost is
$ 157,224,261. The total cost is charged in each year
and is added by the profit of time charter hire, $
19,291,286 in a year.
The shipping cost is the component that take into
account when RFR is calculated. The amount of the
shipping cost depends on the distance and the type of
the ship. As well as the bunkers and port charges.
Through the considered routes from Muara Pantai to
the Guangzhou Port, the Fa can be counted by
determined the number of roundtrips. The bunker cost
is divided by two types, the fuel for main engine, $
14,847,480 per year and the fuel for auxiliary engine
$ 3,704,362 per year. In addition, the port charge is
divided into 4 parts: anchorage, berthing, pilot service
and tug assistance cost, $ 2,841,124 per year.
Moreover, the cargo handling cost using the CIF term
where the exporter is responsible to the cargo loading
cost in the origin port. There are 9,360,000 tonnage
cargo carried that cost $ 742,543 per year.
The freight in which the analysis that applied CIF
terms is the RFR excluded the profit. RFR can be
counted by divide the number of Demand in a year
(D) to Total Cost (TC). The total cost includes Time
charter hire, shipping, and cargo handling cost. Then,
the total cost of coal export to China is $ 41,426,796
per year. At last, after knowing all the total cost, RFR
can be calculated by divide demand (D) to total cost,
$ 4.43 per tonnage.
Table 2: Existing cost.
Tittle Amount ($) Unit
Time Charte
r
Hire 19,291,286 /yea
r
Shi
pp
in
g
Cost 21,392,967 /
y
ea
r
Cargo Handling Cost 742,543 /yea
r
Total Cost 41,426,796 /
y
ea
r
RFR 4.43 /ton
In summary, the minimum RFR is using the FOB
term, $ 4.0 per tonnage which is $ 0,43 per tonnage
lower.
4.4 The First Scenario: Ship Charter
Bulk carriers owned by shipping company are in the
limited numbers. According to INSA, their national
vessels are able to satisfy only 3% of the total amount
of coal export in Indonesia, 370 million tonnage per
year. In terms of national charterer, there are 20
alternative vessels that could be operated.
The model used to calculate the charter vessel is
MV Victory Union 65,000 DWT, its payload is
64,509 ton, so that, in order to meet the demand from
China, 146 frequencies (Fd) are required. The
operation days (Ho) in a year is 330 days, 1 ship is
required (RTD) 14 days in one roundtrip. So that, the
frequency (Fa) of the ship obtained by divide Ho by
RTD is 24 times. Thus, 7 ships, 87% of utilization,
can be counted by divide Fa by Fd in a year.
Table 3: Existing charter cost.
Tittle Amount ($) Unit
TCH 20,768,631 /
y
ea
r
Shipping Cost 21,109,806 /yea
r
Car
g
o Handlin
g
Cost 742,614 /
y
ea
r
Total Cost 42,621,051 /yea
r
RFR 4.55
/
ton
Furthermore, time charter hire can be found
through some calculations: capital cost, operational
cost and freight. Time charter charged the charterer in
the time charter scheme during certain period, 1 (one)
year in this study. The total of capital and operational
cost is $ 157,224,261. The total cost is charged in
each year and is added by the profit of time charter
hire, $ 19,291,286 in a year.
Time charter hire is obtained by calculating the
capital and operational cost, $ 108,882,197 and
$40,923,057 respectively. Thus, TCH is $ 20,768,631
per year. The shipping cost consists of fuel and port
cost, $ 18,263,645 per year and $ 2,846,161 per year
respectively. Whereas the cargo handling cost is $
742,614 per year.
Fleet Planning Scenarios as an Impact of Changing the Export Policy on Cost, Insurance and Freight: A Case Study of Indonesian Coal
Export
67

In summary, the total time charter hire on MV.
Victory Union is $ 42.621.051 per year, so that the
RFR is $ 4,55 per ton
4.5 The Second Scenario: Buy Bulk
Carrier
As mentioned previously, the number of bulk carriers
owned by National shipping company is limited. So
that, the alternative offered is buy the bulk carriers. In
this research, there are 15 bulk carriers with various
DWT. The existing method to calculate the RFR is
applied to the MV. Hanton Trader II with 63,800
DWT. The payload is 63.321 ton, so that in order to
meet the China’s demand (D), 9,360,000 ton per year,
148 frequencies (Fd) are required. The operation days
(Ho) in a year is 330 days, 1 ship is required (RTD)
14 days in one roundtrip. So that, the frequency (Fa)
of the ship obtained by divide Ho by RTD is 24 times.
Thus, 7 ships, 87% of utilization, can be counted by
divide Fa by Fd in a year.
The market price for the ship is $ 15,300,000. The
capital cost that should be paid is $ 107,100,000. This
cost is charged in each year with the value of
weighted average cost of capital (WACC), 12%, thus
the capital cost is $ 13,655,247 per year.
Table 4: Recapitulation of ship purchase cost.
Tittle Amount ($) Unit
Capital Cost 13,655,247 /Yea
r
O
p
erational Cost 6,581,359 /Yea
r
Shipping Cost 20,905,138 /Yea
r
Car
g
o Handlin
g
Cost 738,019 /Yea
r
Total Cost 41,879,762 /Yea
r
Unit Cost 4.47 /ton
The operational cost consists of the salary of
crews, maintenance cost, consumable cost, insurance,
lubricant, and fresh water. Thus, the total operational
cost of Mv. Harton Trader II is $ 5,361,560 per year.
The shipping cost consists of bunker and port cost.
The fuel of main engine and auxiliary engine are $
14,385,621 per year and $ 3,663,732 per year,
respectively. In addition, the port cost is $ 2,855,785
per year.
In summary, the total cost for purchasing the MV.
Hanton Trader II is $ 41,879,762 per year. The RFR
on this scenario is $ 4,47 per ton in which it is 11%
higher than the existing FOB term.
4.6 The Third Scenario: Building New
Ship
The main size of the ship is obtained by conducting
the optimization method. Since there are 9.360.000
ton per year demand (D) and the speed required is 15
knot, ship planning calculation is assigned. The
calculation includes the displacement and ship
tonnage. The optimization method is used to find the
minimum value of RFR.
Table 5: Optimized vessel specifications.
Tittle Amount Units
LOA 226.78 m
LWL 218.38 m
LPP 209.98 m
B 31.91 m
H 18.77 m
T 13.12 m
DWT 67,452 ton
LWT 11,133 ton
GT 36,978
NT 22,731
Main Engine Powe
r
12,270 hp
Auxiliar
y
En
g
ine Powe
r
650 h
p
The ship’s payload is 66,995 ton that gained by
reducing the DWT in consumable and crew weight.
The frequency required, since the demand (D) is
9,360,000 ton and the payload is 66,955, is 140 times.
The operation days (Ho) in a year is 330 days, 1 ship
is required (RTD) 14 days in one roundtrip. So that,
the frequency (Fa) of the ship obtained by divide Ho
by RTD is 24 times. Thus, 6 ships, 97% of utilization,
can be counted by divide Fa to Fd in a year.
The total cost is obtained by multiplying steel,
machinery, equipment, and tools to the existing price
of the steel. The ship building cost is $ 12,537,930.
The building cost is added by 20% profit, 5%
inflation, 10% taxes, hence the ship price is $
19,926,206. The number of units required is 6, thus
the total cost is $ 101,557,236. That capital cost is
equally split through 30 years of ship’s economically
age and the WACC is 12%. Accordingly, the cost is
$ 12,607,687 per year.
The operational cost consists of the salary of
crews, maintenance cost, consumable cost, insurance,
lubricant, and fresh water. Consequently, the total
operational cost is $ 4,852,608 per year. The shipping
cost consists of bunker and port cost. The fuel cost for
both main engine and auxiliary engine depend on
engine power, voyage duration, and the cost of the
fuel in the market. The fuel of main engine and
auxiliary engine for the new ship are $ 17,790,105 per
year and $ 3,663,732 per year, respectively. In
senta 2019 - The International Conference on Marine Technology (SENTA)
68
addition, the port cost is $ 2,757,594 per year. The
cargo handling cost is calculated when the ship in is
in the origin. Hence, the cargo handling cost is
$739,095 per year.
Table 6: Recapitulation of ship building cost.
Tittle Amount ($) Units
Ca
p
ital Cost 12,607,687 /
y
ea
r
Operational Cost 6,071,169 /yea
r
Shi
pp
in
g
Cost 20,547,699 /
y
ea
r
Cargo Handling Cost 739,095 /yea
r
Total Cost 39,965,650 /
y
ea
r
RFR 4.26 /ton
In summary, the total cost for building the new
ships is $ 39,965,650 per year. Therefore, the RFR is
$ 4.27 per ton which is 6% higher than using the FOB
term.
4.7 The Comparison of RFR
The alternative term (CIF) for coal export is by
chartering the national ship, or by building the new
ships which can be the demand. The price reference
of RFR in FOB for shipping from Muara Pantai to
Guangzhou port (1,424 nm) is $ 4 - $ 4.5 per ton.
Table 7: Scenario comparison.
Charte
r
Buy Buil
d
DWT (ton) 65,000 63,800 67,452
Shi
p
(
unit
)
7 7 6
Annual Total Cost
(
Thousand $
)
42,621 41,879 39,909
RFR ($/ton) 4.55 4.47 4.26
As shown in the table above, the amount of RFR
in three scenarios are $ 4.55, $ 4.47, $ 4.26 which are
allocated for charter, buy, and build the ship,
respectively. Moreover, the time charter hire for
65,000 DWT requires 7 units of ship, buying ship on
63,800 DWT requires 7 units, and building ship on
67,425 DWT requires 6 units. To sum up, according
to the result of the analysis, the scenario chosen is
building 6 units of ship which have RFR $ 4.26 ton.
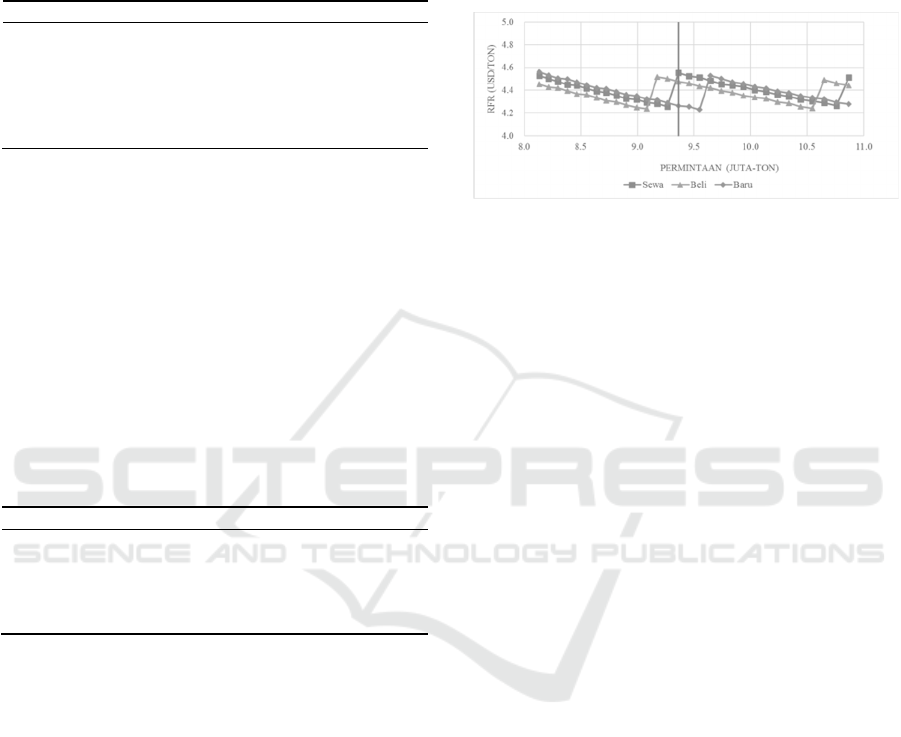
4.7 Sensitivity Analysis
Sensitivity Analysis provides the information in
which variables affected by the chosen scenario.
The higher number of demands, the lower amount
of RFR. There is a significant rise of the RFR in
which it shows that there should be addition on the
number of ship when the demand rise. At the
9,360,000 ton per year demand, building the ship
gives impacts in a lower amount of RFR since the
utility of the ship is 97%, meanwhile, the utility of
time charter hire and buying ship is 87% and 88%,
respectively. In the case of increasing the number of
demands by 2%, the amount of RFR will decrease by
0.87%.
Figure 5: Sensitivity analysis on demands and RFR.
The sensitivity analysis is applied on other
variables, such as speed, loading and discharge rate,
load factor, distance, and currency. In this sensitivity
analysis, for each variable is increased by 2%. This
variation influenced the amount of SFR in which it is
increasing by 0.53% (speed), decreasing by 0.08%
(loading and discharge rate), decreasing by 1,1%
(load factor), increasing by 0.93% (distance), and
decreasing by 0.8% (currency).
5 CONCLUSIONS
According to the analysis and the result, there are
summary need to be considered:
1. Indonesia is one of the biggest coal exporters in
the world that export 364 million ton per year. The
importer countries for Indonesia are China (22%),
India (24%), Japan (11%), South Korea (6%) and
Malaysia (6%). Terms of delivery (ToD) Free on
Board (FOB) is massively used, 80%, in
Indonesia where Indonesia as the exporter
responsible to ship the coal to the origin port.
2. The amount of RFR and FOB on 65,000 DWT to
export coal from Muara Pantai to Guangzhou Port
(1.424 nm) in which demands 9.360.000 ton per
year is $4-$4.5, while using the CIF term, the
amount of RFR is $4.48 per ton, 11% higher than
FOB term.
3. Fleet planning has been conducted in three
scenarios, (1) time charter hire; (2) buying ship;
and (3) building new ship.
a. Time charter hire for 65,000 DWT requires 7
units of ship, the RFR amount is $ 4.55 per ton.
b. Buying ship on 63,800 DWT requires 7
units, the RFR amount is $4.47 per ton, and
Fleet Planning Scenarios as an Impact of Changing the Export Policy on Cost, Insurance and Freight: A Case Study of Indonesian Coal
Export
69

c. Building ship on 67,425 DWT requires 6
units, the RFR amount is $ 4.25 per ton
Thus, according to the result of the analysis, the
scenario chosen is building 6 units of ship which
have RFR $ 4,26 per ton.
4. Therefore, sensitivity analysis is conducted to
determine the most sensitive variables; the
sensitivity orders are: load factor (the most
sensitive), distance, demands, currency, speed and
loading and discharge rate (the least sensitive).
REFERENCES
Benarto, R. A. (2016). Analisis Penerapan Cost Insurance
and Freight (CIF) pada Komoditi Ekspor Indonesia:
Studi Kasus Komoditi Crude Palm Oil (CPO).
Surabaya: ITS.
Blank, L. &. (2008). Basic of Engineering Economy (Vol.
I). New York: McGraw-Hill.
International Trade Centre. (2015). Market Analysis and
Research. Switzerland: International Trade Centre.
Lazuardi, S. D., van Riessen, B., Achmadi, T., Hadi, I., &
Mustakim, A. (2017). Analyzing the National Logistics
System through Integrated and Efficient Logistics
Networks: A Case Study of Container Shipping
Connectivity in Indonesia. Applied Mechanics and
Materials, 862, 238–243.
https://doi.org/10.4028/www.scientific.net/amm.862.2
38.
Permendag. (2017). Peraturan Menteri Perdagangan
Republik Indonesia Nomor 82 Tahun 2017. Jakarta:
Kementerian Perdagangan RI.
Santosa, B., & Willy, P. (2011). Metode Metaheuristik,
Konsep, dan Implementasi. Surabaya: Guna Widya.
Stopford, M. (2009). Maritime Economics 3rd Edition.
Abingdon, Oxon: Routledge.
UNCTAD. (2015). Review of Maritime Transport 2015.
United Nations Conference on Trade and Development.
Yunianto, I. T., Lazuardi, S. D., & Hadi, F. (2018). Freight
calculation model: a case study of coal distribution. IOP
Conference Series: Earth and Environmental Science
Vol. 135 (p. 012-013). IOP Publishing.
senta 2019 - The International Conference on Marine Technology (SENTA)
70
