
Experimental and Numerical Study of Effects of the Application of
Hydrofoil on Catamaran Ship Resistance
Ahmad Firdhaus
1,a
, I. Ketut Suastika
b
1
Department of Naval Architecture, Institut Teknologi Sepuluh Nopember, Indonesia
Keywords: Catamaran, CFD, Hydrofoil, Resistance, Towing-tank Test.
Abstract: The use of hydrofoil on a catamaran can reduce the ship's resistance at a certain speed. The reduction of ship
resistance occurs because of the lifting force that lifts the ship's hull above the waterline to reduce the wet
surface area. This research aims to study the effect of adding hydrofoil in the hull of a catamaran on the ship's
total resistance using experimental and numerical CFD methods. A 44m passenger catamaran was considered
with two variations of hydrofoil: one hydrofoil on the bow section and two hydrofoils (one on the bow section
and one on the stern section). The hydrofoil is rectangular NACA 641-212 section and aspect ratio of 16,34.
The results indicate increasing ship resistance instead of decreasing on the catamaran with the hydrofoil. At
service speed (Fr=0,7), the Total resistance value occurs in case 1 (catamaran without hydrofoil) is 114.59
kN, case 2 (catamaran with added one foil on the bow section), and case 3 (catamaran with added foil on both
bow and stern section) are respectively 31% and 59% higher than the catamaran without hydrofoil. These data
show that not all existing catamaran vessels can be added hydrofoil between the demihulls.
1 INTRODUCTION
Abbreviation Hysucat stands for Hydrofoil Supported
Catamaran and describes a new High-Speed Small
Craft, a seagoing catamaran with a hydrofoil
arrangement the two demi-hulls which carries a part of
the craft's weight at speed. Vessels of this type have
greater efficiency than fast boats or varieties of a
catamaran with a gastric form V. "Hysucat" shows a
reduction in propulsion power and has good seakeeping
characteristics in rough water (Hoppe, 1995).
Based on research on variations in the type of
hydrofoil on catamaran vessels, catamaran vessels'
performance, especially on ship resistance, has
increased efficiency, as evidenced by resistance
improvement of up to 40% based on the output from
several research projects (Hoppe, 2001).
Research and development related to Hysucat
ships (hydrofoil supported catamaran) and Hysuwac
(hydrofoil supported watercraft) began in the late
1970s or early 1980s at Stellenbosch University,
South Africa, led by Prof. Karl Gunter Hoppe
(Hoppe, 1987). Aside from Hoppe, the research
results related to the use of foil on catamarans were
also reported in (Calkins, 1984) and (Suastika et al.,
2018) conduct numerical simulations of hysucat
mono foil vessels using CFD. The simulation results
show that the position of hydrofoil placement in the
longitudinal direction dramatically affects the size of
the ship's resistance. The most optimum position is
the position just below the Center of Gravity (CoG)
of the ship.
The latest technology in ships has been developed
in a variety of conventional forms, including one with
Hydrofoils, Surface Effect Ships (SES), Air Cushion
Vehicles (ACV), and Smal Waterplane Area Twin
Hulls (SWATH). The difference between various
concepts is the method to help the weight of the ship.
Three basic methods, namely, (1) static lift
(Buoyancy), (2) supported static lift (lift fans), and (3)
dynamic lift force (hydrofoils planing hull). The
results of ship technology development with this
method. 95-100% of the ship's weight is assisted by
one of the three methods above (Hoppe, 1989).
NACA (National Advisory Committee for
Aeronautics) Aerofoil is an aerodynamic body shape
that functions to give a certain lift force to a body. An
aerofoil is an aerodynamic form that aims to produce
a large lift force with the smallest drag force possible.
When an aerofoil is passed by fluid flow, because of
the influence of the interaction between fluid flow
and the surface, variations in velocity and pressure
will occur along the top and bottom surfaces as well
104
Firdhaus, A. and Suastika, I.
Experimental and Numerical Study of Effects of the Application of Hydrofoil on Catamaran Ship Resistance.
DOI: 10.5220/0010854400003261
In Proceedings of the 4th International Conference on Marine Technology (senta 2019) - Transforming Maritime Technology for Fair and Sustainable Development in the Era of Industrial
Revolution 4.0, pages 104-110
ISBN: 978-989-758-557-9; ISSN: 2795-4579
Copyright
c
2022 by SCITEPRESS – Science and Technology Publications, Lda. All rights reserved
as the front and rear. The pressure difference between
the upper and lower surfaces gives rise to a resultant
force whose direction is perpendicular to the direction
of the flow of fluid, and this force is called lift force.
The difference in pressure between the front and back
will result in a resultant force in the direction that is
in line with the direction of the flow of fluid, and this
force is called a drag force (Hoppe, 1991).
Catamarans tend to have low water draught so that
the ship can be operated in shallow water. Slender hull
shape can reduce the occurrence of wave wash
compared to monohull vessels. The components of the
catamaran ship resistance have a more complex
phenomenon than a monohull because there is an
interaction effect between the two hulls of the ship,
which causes ship resistance interference. The
empirical formula used is based on the equation from
the study in (Jamaluddin et al., 2013), which is a
modification of the method (Molland et al., 1996).
The purpose of this study is to investigate the effects
on the ship resistance of the positioning of the
hydrofoil arrangement between the two demi-hulls.
Studies on the hydrofoil positioning in the longitudinal
directions were reported in (Suastika et al., 2018). This
study pursues that reported in (Suastika et al., 2018) but
utilizing different arrangement as case 1 (catamaran
without hydrofoil), case 2 (catamaran with added one
foil on the bow section), and case 3 (catamaran with
added foil on both bow and stern section). The results
can enrich the literature on the applications of
hydrofoil catamaran.
2 METHOD
The ship particulars are summarised in Table 1. The
study utilizes CFD simulations and towing test
experiments.
Table 1: Ship Particular.
Princi
p
al Dimension Catamaran Demihull
LWL 44.00 m 44.00 m
B 20.6 m 3.00 m
T 1.40 m 1.40 m
H
3.80 m 3.80 m
V
28 knot 28 knot
Cb 0.491 0.491
Displacement 185.50 ton 92.75 ton
Furthermore, the ship's resistance analyses with the
variation of the number of foil placed on between the
catamaran demi-hull
2.1 Modeling with CAD Software
From the main dimension data of the ship model, the
ship body modeling was made with the help of a CAD
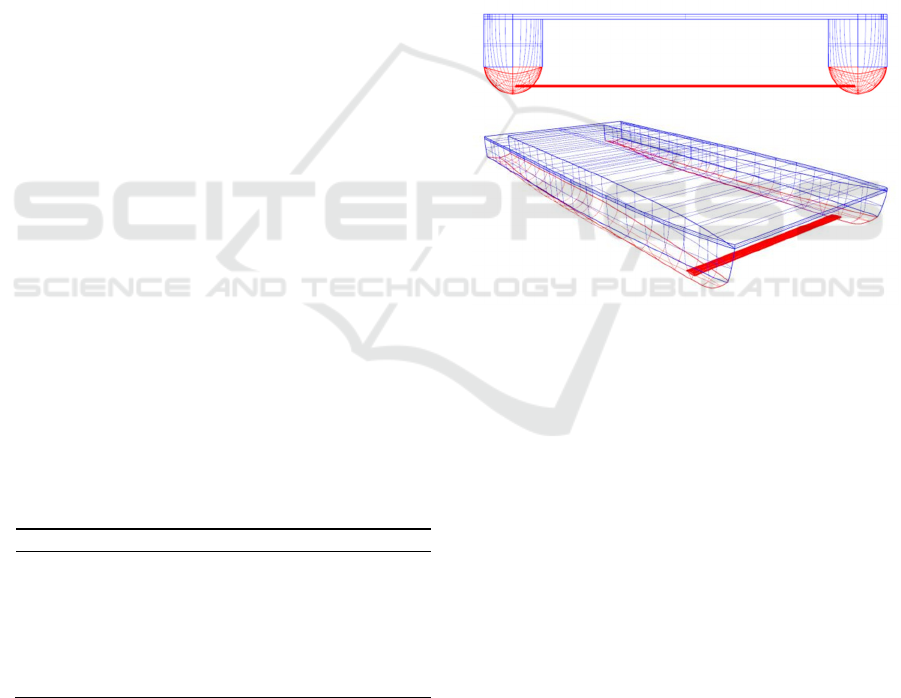
modeler, as shown in figure 1 below. Figure 1 shown
the 3D geometry of the ferry catamaran with one foil
on the bow section of the ship as a wireframe view.
3D geometry should be similar to a real ferry
catamaran so it can be used for numerical simulation
and represents the real condition. In this research,
there are three variations from the original condition
is catamaran without foil. Variation 1 is a catamaran
with one foil on the bow section of the ship, and
variation 2 is a catamaran with two foils (1 on the bow
section and one on the stern section). NACA 641-212
is used for added foil. Places 1m below draught
(1.4m) with 1m cord and 17.3m span.
Figure 1: Front view (upper) and diagonal view (below) of
Geometry of catamaran vessel model (Case 1 - 1 foil at bow
section) using CAD modeler.
2.2 CFD Simulation of the Foil NACA
64
1
-212
Simulations of the foil alone were undertaken to
measure lift force produced by foil NACA 641-212
with 1m cord and 17.6m span on different speed
based on catamaran service speed for preliminary
measurement to get information about how much lift
force from foil before it is assembled on between
demihull catamaran, from this, we can estimate WSA
reduction because of the lifted hull, trim that will
happen to the ship, and total ship resistance.
Experimental and Numerical Study of Effects of the Application of Hydrofoil on Catamaran Ship Resistance
105
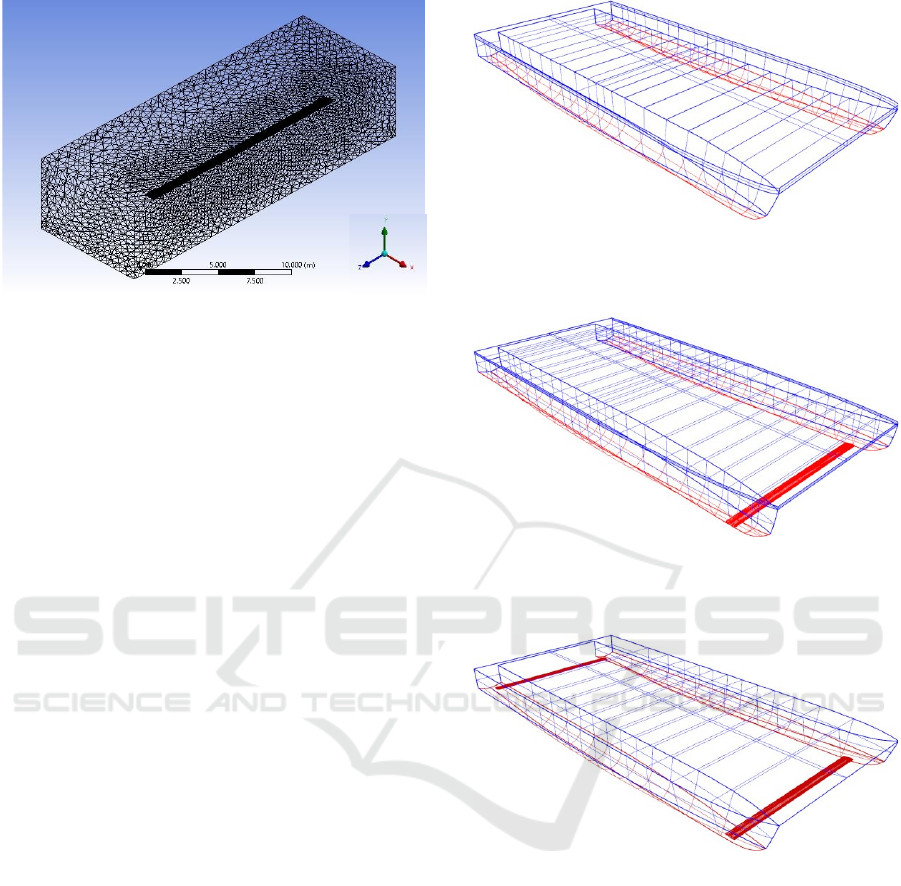
Figure 2: Preview Mesh of the NACA 641-212 foil on
boundary domain from pre-processing of CFD simulation
with hybrid mesh consists of the unstructured element on the
domain and structured element on boundary layer and foil.
The boundary conditions of the computational
domain are as follows (Versteeg & Malalasekera,
2007). The inlet boundary, located at 1-c upstream
from the leading edge (where c is the chord length),
is defined as a uniform flow with velocity equaling
the ship/foil’s velocity. (In the simulations, the foil is
at rest, but the water flows.) In the outlet boundary, at
a location 4-c downstream from the trailing edge, the
pressure equals the undisturbed (hydrostatic)
pressure, ensuring no upstream propagation of
disturbances (Mitchel et al., 2008). The boundary
condition on the foil’s surface is defined as a no-slip
condition. The boundary conditions on the top and
bottom walls (at a distance of 2-c above and below
the foil, respectively) and on the side walls
(approximately 7-c away from the side of the model)
are defined as free-slip condition. Furthermore,
because the foil is fully submerged at a relatively deep
submergence elevation (the foil’s thickness is much
smaller than the submerged depth), and in order to
reduce the time of convergence, free surface effects
(generation of waves) were not modeled in this case.
2.3 CFD Simulation of the Catamaran
with and without Foil
The process of numerical simulation on
Computational Fluid Dynamic starts from making a
hull model. Modeling using the CAD software, then
the file is exported in the form of a file .igs. The model
used must be solid. After the model is finished, the
work continues using numerical simulations. The
numerical simulation software used is software based
on Computational Fluid Dynamic. These simulation
steps are divided into several stages, including
Geometry, Mesh, Setup, Solution, and Result.
Figure 3: Imported Geometry solid modeling of catamaran
without foil on CFD pre-processor phase from CAD
modeler.
Figure 4: Imported Geometry solid modeling of a
catamaran with one foil on CFD pre-processor phase from
CAD modeler.
Figure 5: Imported Geometry solid modeling of a
catamaran with one foil on CFD pre-processor phase from
CAD modeler.
Figures 3 to 5 show the geometry model after
imported to CFD software from CAD software. It
must be solid so CFD software can read the geometry
fully correct and ready to simulate. After the running
or simulation process is complete, the results can be
seen in the result stage. The results obtained are the
resistance value of the ship, the model, and
visualization of the flow on the free surface and
station behind the hull.
senta 2019 - The International Conference on Marine Technology (SENTA)
106
2.4 Towing-tank Experiments
Towing tank experiments were held in the
Hydrodynamic Laboratory of the Faculty of Marine
Technology, ITS Surabaya, Indonesia, to verify the
results from CFD simulations. The dimensions of the
towing tank are 50m in length, 3m in width, and 2m
in depth.
1:40 geometrical scaled Ship Model were
designed and manufactured for the ship hull and the
foil. Fiberglass-reinforced plastic was used to make
the ship model, and the foil was made from copper.
The model’s resistance was measured by using a load
cell. The load cell was connected to a voltage
amplifier, which was in turn connected to a computer
network in the control room. Before carrying out a
measurement, the load cell was calibrated by using a
mass of 0.5kg. Five ship speeds were tested: 0.87,
1.16, 1.46, 1.74, and 2.037 m/s (full-scale speeds: 12,
16, 20, 24, 28 knots). Figure 7 shows a photograph of
the model being towed at a speed of 1.16 m/s (full-
scale speed: 16 knots; Fr = 0.4).
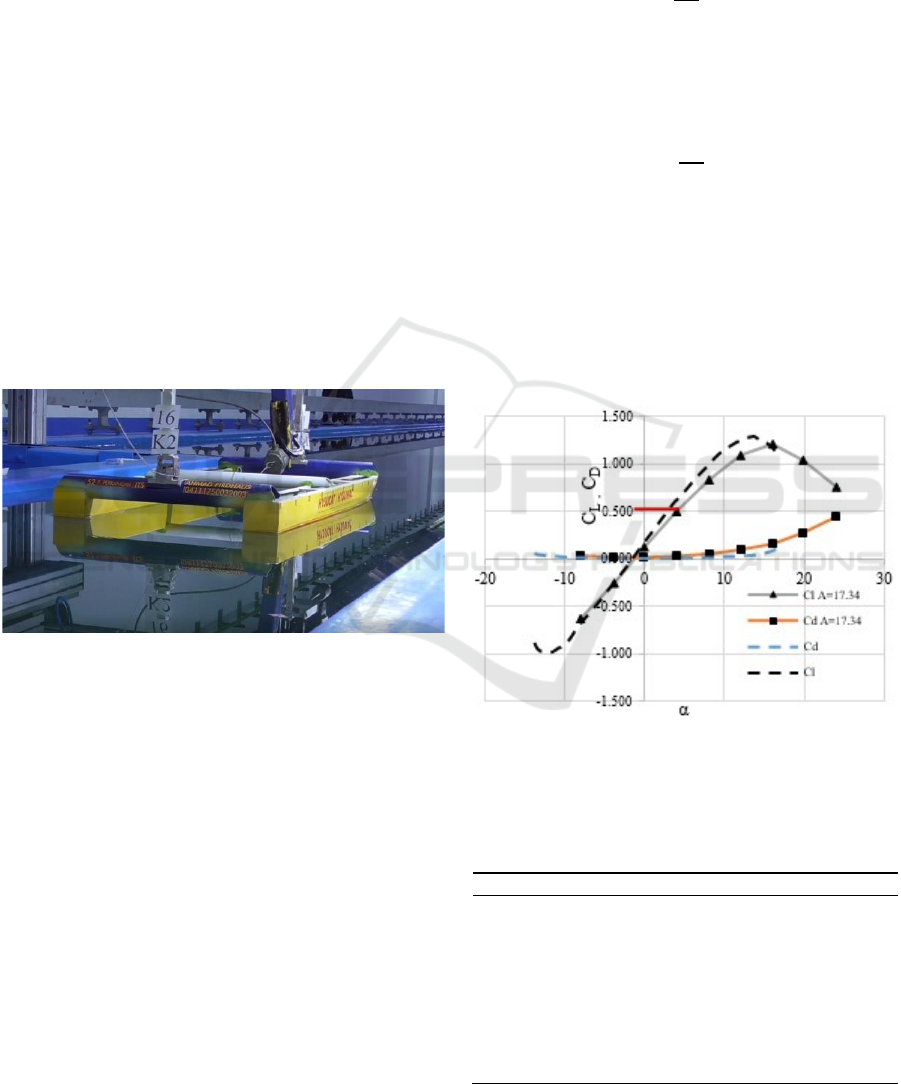
Figure 6: Model 2 of a catamaran with one foil on the bow
section of the demihull catamaran before tested on towing
tank on 16-knot speed (1.16m/s).
3 RESULTS AND DISCUSSION
3.1 Foil Characteristic
Table 2 summarizes the effect of different foil angels
of attack on the lift-to-drag ratio as obtained from
simulations of the foil alone with an angle of attack
from -8⁰ to 24. The results show that, for the same foil
size (aspect ratio), the lift-to-drag ratio of NACA 641-
212 is increasing along with the rise of the angle of
attack until 4⁰ and then decreasing. Furthermore, the
vane characteristics were obtained from CFD
simulations of foil alone. To verify the CFD results,
these are compared with the theoretical results.
The shifts in lift and drag coefficients due to finite
span are given as follows (White, 2011). For a given
C
L
, the horizontal shift in α due to the finite span as
compared with the infinite span case is given as:
∆𝑎
𝐶
𝜋𝐴
(1)
Furthermore, for a given 𝛼, the increase in C
D
due
to the finite span as compared with the infinite span
case is given as:
∆𝐶
𝐶
𝜋𝐴
(2)
In Equations (1) and (2), the C
D
is the drag
coefficient, C
L
is the lift coefficient, α is the angle of
attack and A is the aspect ratio. Then the results of C
L
from CFD are compared with C
L
from experimental
calculations that have been carried out by others to
ensure that calculations using CFD can be trusted by
plotting the graphic of C
L
from CFD and experiment
such in Figure 7.
Figure 7: Lift and drag coefficients for NACA 641-212
section (theoretical results with infinite aspect ratio A)
compared with NACA 641-212 vane with an aspect ratio of
17.3 obtained from CFD simulations (Re
c
= 5.0 x 10⁶).
Table 2: Foil NACA 641-212 Characteristic.
αDra
g
(
kN
)
Lift
(
kN
)
C
d
Cl L/D
-8 32.35 -590.27 0.03 -0.62 -18.25
-4 16.79 -239.12 0.01 -0.25 -14.24
0 13.67 116.74 0.01 0.12 8.54
4 28.15 470.71 0.03 0.50 16.72
8 47.48 782.32 0.05 0.83 16.48
12 93.89 1028.04 0.10 1.09 10.95
16 148.51 1138.18 0.15 1.20 7.66
20 258.75 979.08 0.27 1.04 3.78
24 419.03 712.66 0.44 0.75 1.70
Experimental and Numerical Study of Effects of the Application of Hydrofoil on Catamaran Ship Resistance
107
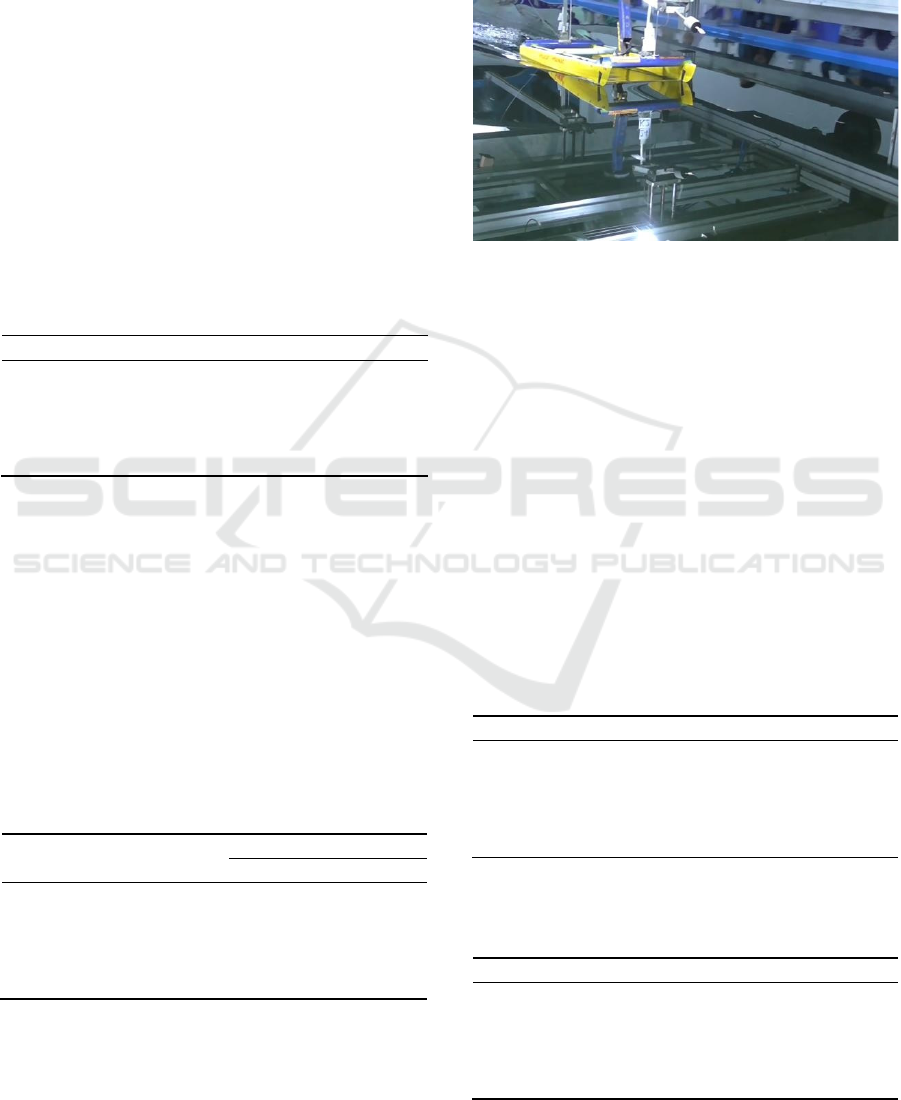
Figure 7 shows the lift and drag coefficients for
NACA 641-212 section with infinite span compared
with NACA 641-212 section and aspect ratio A =
17.34. The lift curve slope for
between -8° and 12°
for the infinite span case is approximately 0.1 per
degree and stall takes place at
approximately 14°
according to the theoretical prediction (Abbot & Von
Doenhoff, 1959).
Table 3 summarizes the lift forces that occur on
the foil when it is simulated under several ship speed
conditions as obtained from foil simulations only
without catamaran, with the angle of attack α = 2⁰,
chord 1m length and span 17.3m. The results show
that, for the same foil size (aspect ratio), the higher
the speed of the ship, the higher the lift force
produced by the foil. NACA 641-212 foil has a
greater lift when it's simulated on service speed
(Fr=0.7).
Table 3: Lift force of foil NACA 64
1
-212.
F
r
V (Knots) V (m/s) L (kN) D (kN)
0.3 12 6.17 67.83 11.61
0.4 16 8.23 119.71 20.72
0.5 20 10.29 184.53 32.75
0.6 24 12.35 249.25 50.48
0.7 28 14.40 327.88 70.32
Table 4 summarizes the lift force that occurs on
the foil when it is simulated under some conditions of
ship speed obtained from the simulation when the foil
is on a catamaran, with the angle of attack α = 2⁰,
chord 1m length, and span 17.3m. The results show
that, for the same foil size (aspect ratio), the higher
the speed of the ship, the higher the lift force
produced by the foil. The value of this condition is
greater than the lift and drag on foil-only condition
because when the foil is attached to the catamaran
hull, the foil condition seems to have a wingtip
because both ends of the foil are covered by demihull.
Table 4: Lift force of foil NACA 641-212 on the catamaran.
Fr Vs. (knot) Vs (m/s)
Lif
t
(kN)
1 Foil 2 Foil
0.3 12 6.17 69.57 124.86
0.4 16 8.23 149.62 233.42
0.5 20 10.29 246.97 425.51
0.6 24 12.35 352.14 612.88
0.7 28 14.40 451.14 707.15
3.2 Ship Resistance with and without Foil
Results of resistance for the ship with vane are
presented in this section. A comparison between the
CFD and towing test results are shown in Figure 9.
Figure 8: Model 2 of a catamaran with one foil on the bow
section of the demihull catamaran being tested on towing
tank at 16-knot speed (1.16m/s).
It can be shown in Figure 9 below that trim
occurred on the model because of the effect of bow
foil. The result of the Ship resistance analysis using
CFD and Experiment was gathered and then process
to get the final data. In figure 8 above is Case 2 of a
catamaran with one foil on the bow section of the
demihull catamaran being tested on towing tank at a
16-knot speed (1.16m/s). It can be shown in Figure 9
below that trim occurred on the model because of the
effect of bow foil. The percent relative error between
Ship resistance value from each model with various
speeds from CFD calculation and towing tank
experiment can be seen on the table below.
Table 5: Percent relative error between the CFD results and
experiment.
F
r
Case 1 Case 2 Case 3
0.3 4.80 0.88 4.84
0.4 3.48 3.16 2.64
0.5 1.10 4.12 1.96
0.6 1.40 3.30 1.22
0.7 3.40 4.08 2.00
Table 6: Percent increase of total resistance compared
between case without foil (Case 1) and case with foil (Case
2) and (Case 3) based on CFD result.
F
r
Case 2 Case 3
0.3 41.11 98.94
0.4 39.27 87.49
0.5 36.05 82.21
0.6 34.09 77.42
0.7 31.04 59.32
senta 2019 - The International Conference on Marine Technology (SENTA)
108
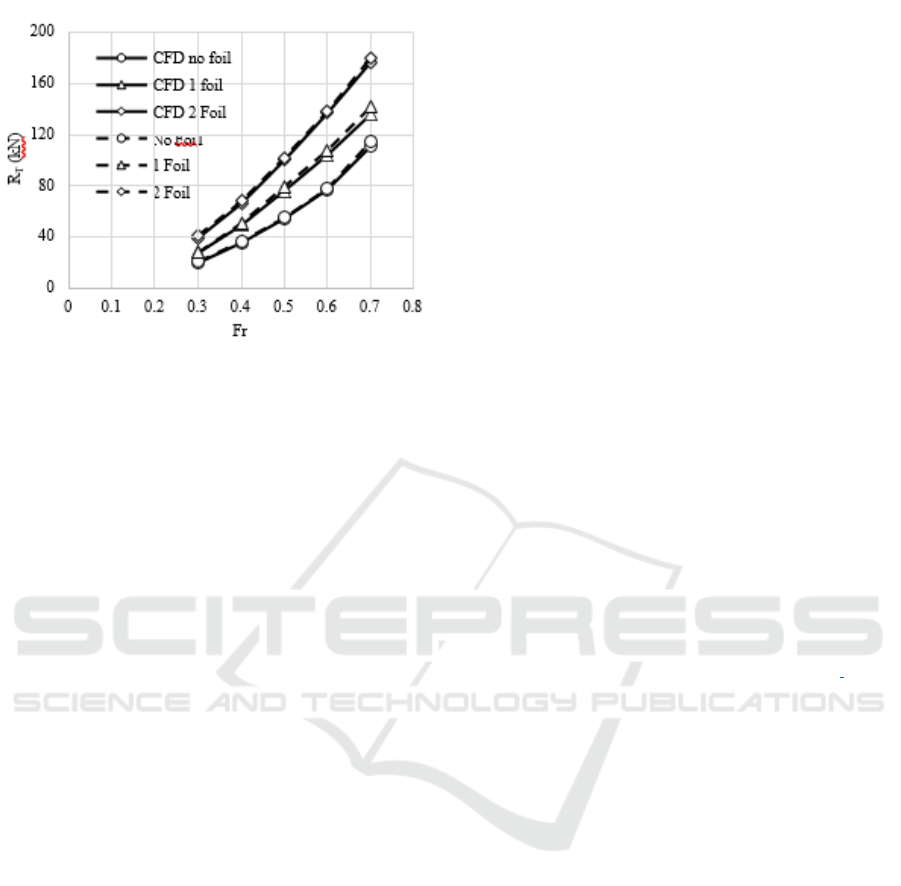
Figure 9: Total ship resistance from 3 various models
of a catamaran with and without foil with different
speeds (Fr=0.3-0.7).
Line with black dash is resistance for catamaran
without foil, dash dots line is Resistance for a
catamaran with one foil on bow section, the straight
line is a catamaran with two foil (1 on the bow and
quarter span on the stern section of each demihull),
and node without line results from the experiment.
The calculation results and the graph image above
show the difference in the resistance value of each
ship model according to the Froude number and the
speed of each ship model. As table 5 show that there
is no reduction in ship resistance because of added
foil, a catamaran with two foil is higher than a
catamaran without foil. Based on the literature
(Calkins, 1984; Hoppe, 1982, 1989, 1991, 2001), the
effect of added foil on the ship hull will reduce the
total resistance at a certain speed. In this study, the
effect of adding foil has not reached a state where the
addition of lift force is greater than the addition of
drag force due to the addition of foil, so a higher speed
is needed to achieve this condition. But as the speed
going higher, it will consume much power, so the
efficiency will not be optimum.
4 RESULTS AND DISCUSSION
Based on CFD Simulation and Towing tank
experiment that has been done on 3 different cases.
(K1) catamaran without foil, (K2), 1 catamaran with
1 foil on the bow section, (K3), a catamaran with 1 in
the bow section, and 1 in the stern section show that
the added foil significantly affect the catamaran’s
total resistance. Generally, hydrofoil on a ferry
catamaran increases the total resistance produced by
the ship at service speed. The highest resistance value
occurs in the case catamaran with foil on the ship's
bow and stern section (K3). Total resistance value
happens in case 1 as the existing catamaran without
foil is 114.59 kN at service speed, case 2 (1 foil)
design of catamaran with added 1 foil on the bow
section, and case 3 (2 foil) with added foil on both
bow and stern section is respectively 31% and 59%
higher than the catamaran without foil These data
show that not all existing catamaran vessels can be
added hydrofoil between the demihulls. To get
optimal hydrofoil-supported catamaran performance,
designing a catamaran ship with hydrofoil from the
preliminary design is necessary. For further research,
a more sophisticated hydrofoil technology is needed
to change the hydrofoil conditions at each ship's
speed. The resulting lift remains stable in providing a
lift to the hull and the least possible drag force.
REFERENCES
African Development Bank, 2010. African development
report. Ports, logistics, and trade in Africa. Oxford
University Press Inc., New York.
Abbot, I. H., & Von Doenhoff, A. E. (1959). Theory of
Wing Sections (Including a Summary of Airfoil Data),.
Dover Publication.
Calkins, D. E. (1984). HYCAT: Hybrid hydrofoil
catamaran concept. Ocean Engineering, 11(1), 1–21.
https://doi.org/10.1016/0029-8018(84)90021-0.
Hoppe, K. G. W. (1982). The Development of a Hydrofoil-
Supported-Rigid- Inflatable Boat.
Hoppe, K. G. W. (1987). U . S. Patent Aug 11, 1987. 19.
Hoppe, K. G. W. (1989). The Hysucat Development.
Hoppe, K. G. W. (1991). Surface Craft with Reference to
the Hysucat Development Research Report 1990 BY.
January, 1–28.
Hoppe, K. G. W. (2001). Recent Applications of Hydrofoil-
Supported- Catamarans. Fast Ferry International, 1– 20.
Hoppe, K. G. W. (1995). Optimization of Hydrofoil-
Supported-Planing Catamarans. Third International
Conference on Fast Sea Transportation, September 25–
27.
Jamaluddin, A., Utama, I. K. A. P., Widodo, B., & Molland,
A. F. (2013). Experimental and numerical study of the
resistance component interactions of catamarans.
Proceedings of the Institution of Mechanical Engineers
Part M: Journal of Engineering for the Maritime
Environment, 227(1), 51–60.
https://doi.org/10.1177/1475090212451694.
Mitchel, R. R., Webb, M. B., Roetzel, J. N., Lu, F. K., &
Dutton, J. C. (2008). A Study of the Base Pressure
Distribution of a Slender Body of Square Cross Section.
Proceeding of the 46th AIAA Aerospace Sciences
Meeting and Exhibition, 1–8.
Molland, A. F., Wellicome, J. F., & Couser, P. R. (1996).
Resistance experiments on a systematic series of high-
Experimental and Numerical Study of Effects of the Application of Hydrofoil on Catamaran Ship Resistance
109

speed catamaran forms: Variation of length-
displacement ratio and breadth-draught ratio. In Trans.
RINA (Vol. 138, pp. 59–71)..
Suastika, K., Dikantoro, R. Y., Purwanto, D. B., Setyawan,
D., & Putra, W. H. A. (2018). Analysis of Lift and Drag
of Mono-foil Hysucat due to Longitudinal Foil-
placement Variation. International Journal of Marine
Engineering Innovation and Research, 2(2), 2–8.
https://doi.org/10.12962/j25481479.v2i2.3655.
Versteeg, H., & Malalasekera, W. (2007). An Introduction
to Computational Fluid Dynamics. In Pearson (Vol. 6,
Issue 4). https://doi.org/10.1109/mcc.1998.736434.
White, F. M. (2011). Fluid Mechanics (7th ed.). McGraw-
Hill.
senta 2019 - The International Conference on Marine Technology (SENTA)
110
