
A Study of Efficiency of Container Terminals:
A Case Study of Ports in Tanzania
Adam Ali
1,a
, I. G. N. Sumanta Buana
1,b
, I Ketut Suastika
2,c
1
Department of Marine Transportation Engineering, Institut Teknologi Sepuluh Nopember, Indonesia
2
Department of Naval Architecture, Institut Teknologi Sepuluh Nopember, Indonesia
Keywords: Container Terminals, Stochastic Frontier Analysis, Technical Efficiency.
Abstract: The objective of this study is to evaluate efficiency of container terminals in Tanzania. Relative efficiencies
between terminals are imperative to identify the potential areas of improvement for the inefficient terminals.
Tanzania is often excluded from literature about port operation and performance since many studies focused
on Asia and Europe. In order to enhance understanding about Tanzanian port efficiency, the present study is
highly demanded. However, traditional studies on container terminal efficiency tend to focus on partial
productivity measures such as TEUs per crane. These instruments do not assess the overall efficiency of
terminal operations, as they are focusing only at specific aspects of the terminal operation process. This study
uses a measurement of container terminal efficiency based on Stochastic Frontier Analysis (SFA). It is found
that the lowest score is 0.430, and the highest score is 0.997 of technical efficiency among container terminals.
On average, a typical container terminal in the sample during the study periods has an efficiency level around
0.821, meaning that the terminal operating at 82.1%, of efficiency, which is below the maximum potential
output on the frontiers. However, there is a possibility for terminals to increase efficiency by 17.9%. The most
efficient terminal ever found is at Zanzibar, and the least is at Mtwara. The urgency of automation to reduce
inefficiency level is required to fulfil the timely submission, timely delivery, and higher quality services.
1 INTRODUCTION
Seaport is a potential link of international supply
chains between sea and land transportation and
therefore enhances international trade. Following the
expansion of sea transportation technology, 80% of
world total imports and exports were conducted by
way of maritime transportation (UNCTAD, 2017)
and remains the most common mode of international
freight transport (AfDB, 2010). It is the principal
foundation to smoothing world trade, offering the
most economical and reliable way to move goods
over long distances. The growth of world trade was
due to the world container ports improvement with
enough infrastructures and handling equipment
(UNCTAD, 2018). However, many ports experience
a shortage of facilities and investment, long delays,
and dwelling time, causing congestion, affecting
import prices, and export competitiveness (Carine,
2015).
The amount of delay and dwelling time in
Tanzanian ports became significant challenges that
affected the production level due to inefficient
services provided. The efficiency of the container
terminal is an influential factor toward
competitiveness and became indicator of a country’s
development. Therefore, the Seaports authorities are
under the pressure of improving efficiency by
ensuring that the services level offered on the
container ports is on a competitive basis.
There is no doubt that technological changes
significantly influence the efficiency of container
terminals and competitiveness. The inefficiency of a
container terminal would be evidenced by several
performance indicators including physical design,
equipment, and container stacking capacity, quality
and connectivity of landsides transport connections,
links to the main shipping lines routes, vessel size,
quality of port or terminal infrastructure as well as
container handling, government process, and custom
charge. These factors are accountable in linear
relationships with economic scale since they build a
positive reputation for the customers and, indeed, lead
more attractive. Therefore, in the less matured
container port including ports of Tanzania, the study
of comparing one terminal with another in terms of
Ali, A., Buana, I. and Suastika, I.
A Study of Efficiency of Container Terminals: A Case Study of Ports in Tanzania.
DOI: 10.5220/0010853800003261
In Proceedings of the 4th International Conference on Marine Technology (senta 2019) - Transforming Maritime Technology for Fair and Sustainable Development in the Era of Industrial
Revolution 4.0, pages 53-62
ISBN: 978-989-758-557-9; ISSN: 2795-4579
Copyright
c
2022 by SCITEPRESS – Science and Technology Publications, Lda. All rights reserved
53

their relative efficiency is vital for economic
reformation.
The economic value of maritime transportation
are facilitated by high-level efficiency that guarantees
timely submission, timely delivery, and high-quality
services, which are less bureaucratic. Headed to the
improvement of efficiency and productivity in the
container port or terminal, comprehensive maritime
management information systems support is needed.
These systems are automatic identification systems,
vessel traffic management systems, and port
operating systems.
In the country with a less-matured port system, the
development of port infrastructure and facilities
should be paid special attention to the port to
accommodate business activities. In Tanzania, the
ports performance has deteriorated and already
exceeded maximum capacity planned since 2013.
Therefore, container ports in Tanzania will suffer
progressive declines in operational effectiveness
unless both capacity and terminal efficiency issues
should adequately be well addressed. However, little
is known about the container terminals’ efficiency of
Tanzanian ports. This study aims to bridge the gap.
In addition, there are extensive researches in the
literature that have been conducted in examining
factors that influence performance and efficiency of
container terminal, most of them focused in Europe,
Asia, and Middle East ports (Almawsheki et al.,2015;
Zheng et al., 2016; Liu, 2010; Yang et al.,2011;
Wang, 2004), few have focused on African ports
(Ago et al., 2016; Carine, 2015). There are limited
studies focused in Tanzanian ports. Therefore, there
is a need to enhance an empirical-driven
understanding of efficiency issue to Tanzanian ports’
performance in efficiency perspective. This study
plays an essential role in creating this perspective.
The significance of this study is to provide support to
managers and operators of the container terminal in
decision making to improve the operating system in
order to produce the best potential output. It
contributes knowledge to the literature in the carrier
while helping students, researchers, and practitioners
for further development. Also, it contributes to
efficiency theories by offering an empirical model
that can be used as a decision support tool for
container terminals’ efficiency in Tanzania.
The authors designed this study with the primary
objective of evaluating the efficiency of container
terminals in ports of Tanzania with a special interest
in technical efficiency. However, approaches of
technical efficiency estimation vary depend on the
target of the researcher want to achieve. The technical
efficiency herein estimated based on output-oriented
approaches via the Stochastic Frontier Analysis.
2 LITERATURE REVIEW
Operational efficiency and effectiveness of ports or
terminals are critical to success, and considered the
best way to maintain competitiveness. Inefficient
operation and physical factors (including water depth,
mooring facilities, land, equipment, access, and so
forth) can reduce port throughput. Technological
factors have a significant impact on the availability of
real-time information for stakeholders and the
streamlining of both import and export value chains
of the business (Kahyarara & Simon, 2018). Although
port size and infrastructure, private sector
participation, and quality of both cargo-handling and
logistics services are essential determinants of
efficiency, the inputs such as quay length, terminal
area, and quay cranes have significant effects on
production (Yang et al., 2011). Similarly, the input
(length of the quay, the number of berth-side cranes,
the number of births) are shown a significant
influence on port production efficiency (Ago et al.,
2016). In the study of world major container
terminals, the variables such as terminal berth length,
alongside quay depth, terminal area, and draft, have
proven to significantly affect the production
efficiency (Hlali, 2017).
On average, container port terminals in Sub-
Sahara Africa have witnessed inefficiency indeed
rather than technical efficiency (Carine, 2015). The
study conducted at North Mediterranean Sea for both
ports and terminal operation efficiency revealed that
90% of the container ports included in the study have
their technical efficiency lower than 0.80, while 95%
of the container terminals have their technical
efficiency lower than 0.80 (Liu, 2010). From an
economic scale perspective, both container ports in
Korea and China, on average, revealed similar scores
of efficiencies about 0.886 and 0.887, respectively
(Zheng et al., 2016).
Numbers of studies have displayed different
approaches to investigate the efficiency of the ports
or terminals. Table 1 evidenced that recently, the
Stochastic Frontier Analysis (SFA) has become a
popular method in evaluating the efficiency of
container terminals. In this study, we use SFA to
evaluate the efficiency of container terminals of
Tanzania due to the available data characteristics. The
goodness of SFA is that it addresses the issue of error
and less bias as compared with analytical techniques.
Stochastic frontier analysis has not yet been used to
senta 2019 - The International Conference on Marine Technology (SENTA)
54

build an efficiency model of container terminals in
Tanzania ports. This situation leads to authors’
decision on using SFA approaches as paramount
techniques for studying production efficiency in
container terminals of Tanzania ports.
3 METHODS
3.1 Variables
The measurement of container terminals efficiency of
Tanzanian ports used stochastic frontier models. The
output variable that was considered in this study is
berth throughput (in TEUs) from 2010-2018. Also,
the input variables selected were quayside crane, the
terminal area in meter square, and berth length in
meter. However, other exogenous variables in binary
form were also included, such as quality of cargo
handling and private sector participation.
3.2 Modelling
The stochastic frontier analysis technique is used to
build the container terminals’ efficiency model of
Tanzania. The stochastic frontier model is a
statistical-based modelling used to analyze the
Table 1: Review of port/container terminals efficiency study.
Autho
r
Title Techni
q
ue Variables
Almawshaki et al., 2015 Technical efficiency of container terminals in
the Middle Eastern Region
DEA Berth throughput, berth length,
yard area, quay crane, yard
equipment, and maximum draft
Carine, 2015 Analyzing the operational efficiency of container
Ports in Sub-Saharan Africa
DEA Throughput, terminal area,
quayside crane, berth length,
an
d
yar
d
equipment
Demirel, 2012 Container terminal efficiency and private sector
participation
Tobit Throughput, private sector, hub
port status, logistic performance
index, and deviation distance
Hlali, 2017 The efficiency of the 26 major container ports
in 2015: Comparative analysis with different
models
SFA Throughput, quay length,
alongside depth, terminal area,
an
d
storage capacit
y
Hlali, 2018 Efficiency analysis with different models: The
case of container ports
SFA Throughput, quay length,
alongside depth, terminal area,
an
d
stora
g
e ca
p
acit
y
Liu, 2010 Efficiency analysis of container ports and
terminals
SFA Berth length, quayside crane,
yard crane, yard area, crane
spacing, trade volume, terminal
size, and throughput
Lopez-Bermudez et al.,
2018
Efficiency and productivity of container
terminals in Brazilian
p
orts
(
2008 - 2017
)
SFA TEUs, frequency of call, gantry
crane, an
d
mobile crane
Liu, 1995 The comparative performance of public and
private enterprises: the case of British ports
SFA Turnover, labour, capital,
ownership, size, capital
intensit
y
, and location
Notteboom et al., 2000 Measuring and explaining the relative efficiency
of container terminals employing Bayesian
Stochastic Frontie
r
Models
BSFM Quay length, terminal surface
area, gantry crane, and
containe
r
traffic in teus
Suárez-Alemán et al.,
2015
When it comes to container port efficiency, are
all developing regions equal?
SFA TEUs, terminal area, berth
length, mobile crane, and
gantry crane
Wang, 2004 Analysis of the container port industry using
efficiency measurement: A comparison of China
with its international counterparts
SFA, DEA Quay length, yard area,
quayside, and yard gantry
cranes, an
d
straddle carriers
Yang et al., 2011 Seaport operational efficiency: An evaluation of
five Asian port using stochastic frontier
p
roduction function model
SFA Berth length, quayside crane,
yard crane, yard area, and
throughput
Zheng et al., 2016 A study of container terminals efficiency of
Korea and China
DEA Berth length, quayside crane,
yar
d
area an
d
b
erth throughput
A Study of Efficiency of Container Terminals: A Case Study of Ports in Tanzania
55

efficiency, which identifies the frontier through the
regression method with a composed error term. The
method was first proposed by Aigner et al. (1977) and
later was improved by Meeusen and Van den Broeck
(1977), which requires the specification of
distribution assumptions in order to estimate the
efficiency. The presence of stochastic elements
makes the models less vulnerable to the influence of
outliers than with deterministic frontier models. In
general, stochastic frontier model, also called
Potential Production Function, is defined as follows:
𝑌
𝑓
𝑋
𝑒
(1)
Where:
X
i
,Y
i
: Observed inputs and output for an
individual container terminal
U
i
: Non-negative random variable
associated to technical inefficiency
V
i
: White noise due to random shock
The composed error terms (
V
and
U
) are
distributed independently of each other. In the
literature, the
error (
V
) is always normally
distributed, and (
U
)
is specified by several one-sided
error distributions.
The density function
U
can be
evaluated under the Half Normal, Exponential,
Truncated Normal, or Gamma distributions.
In this study, the Authors adopted the truncated
normal distribution assumption of Battese and Coelli
(1992) as well as Battese and Coelli (1995) models to
analyze dataset with the Cobb-Doulas function, since
the Translog function failed to accommodate the data
set accurately. The model specified in coded form
such that the first code digit represent functional form
(1= Cobb- Douglas function), second digit represents
model type (1 = (Battese and Coelli, 1992), and 2 =
(Battese and Coelli, 1995)) and the third digit
represents number of variables specification (1= three
inputs variable with exogenous variables, and 2 =
three inputs variable with trend and/or exogenous
variables).
According to Battese and Coelli (1995), the
estimation of a stochastic production frontier function
depends on the validity of variance parameters as
follows:
𝜎
𝜎
𝜎
(2)
Then, the shared variation of inefficiency is
defined as follows:
𝜎
𝜎
𝜎
𝜎
(3)
The shared variance ratio reflects the total
variation from the frontier level of output attributed
to the technical inefficiency. It is normally used to test
the null hypothesis that the technical inefficiency is
not present in the model. If that is the case the value
of variance, 𝜎
, is close to zero, and the inefficient
term must be removed in the model, and hence the
model will be constantly be estimated using the
Ordinary Least Square (OLS) method.
Furthermore, the hypothesis test for the
parameters of the stochastic production should be
diagnosed using the generalized likelihood ratio (LR)
statistic defined as follows:
𝜆2
ln
𝐿
𝐻
ln
𝐿
𝐻
(4)
Where:
𝐿
𝐻
: Value of log-likelihood function
restricted to OLS
𝐻
: Value of the unrestricted function
If the value of LR-statistic is significantly
asymptotically distributed as a mixed Chi-square
random variable lead the critical area with a certain
degree of freedom, the null hypothesis should be
validly rejected and potential conclusion provided.
The production model of Cobb-Douglas function in
this study is specified as follows:
ln𝑌
𝛽
𝛽
ln
𝑋
𝛽
ln
𝑋
𝛽
ln
𝑋
𝛽
𝑇
𝑉
𝑈
𝑈
𝛿
𝛿
𝑍
𝛿
𝑍
𝑊
(5)
Where:
Y
i
: Berth throughput of container
terminal i
X
1
: Number of quayside crane
X
2
: Area of the terminal area
X
3
: Berth length among container
terminal
Z
1
: Private participation
Z
2
: Quality of cargo handling
𝛽
,𝛿
: Intercept
𝛽
…
,𝛿
,𝛿
: Slope coefficients of
independent variables
W
i
: Error term needs to be estimated
T : Trend variable
V
i
, U
i
: White noise and inefficiency
error term, respectively
senta 2019 - The International Conference on Marine Technology (SENTA)
56
4 RESULTS AND DISCUSSION
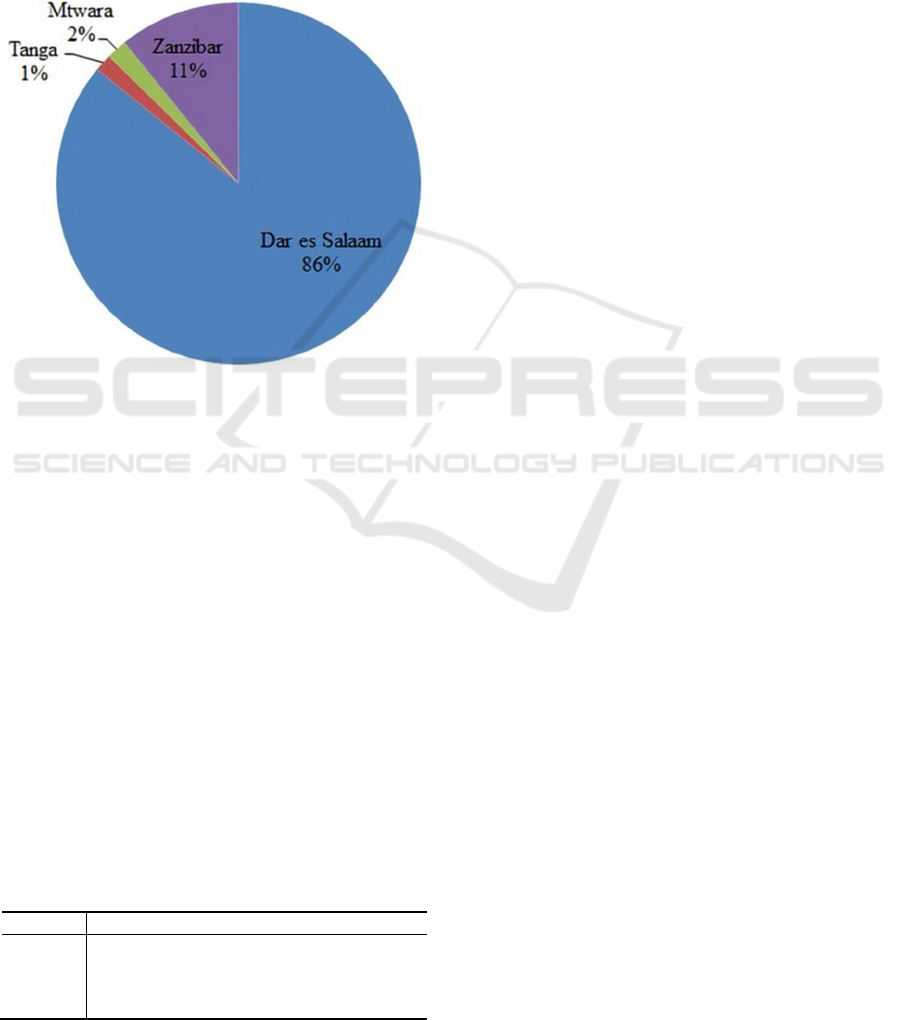
4.1 Output of Container Terminals
During the period of 2010-2018, the majority of
container handling occurred in Dar es Salaam
terminal out of the total container handled, followed
by Zanzibar terminal (Figure 1). Besides, the Tanga
and Mtwara have shown relative lower operating
container trade.
Figure 1: Berth throughput 2010-2018 share.
4.2 Correlation of Variables
Correlation measures describes the relationship
between two variables. It measures the strength and
direction of linear relationships among variables. The
value of correlation in Table 2 obtained using
Microsoft Excel.
All variables are accepted since there are no
negative correlations among them. The dependent
and independent variables are reasonably correlated
and provide a venue toward analysis. whereas quay
crane has the lowest correlation with berth output.
This finding suggests relatively lower importance of
quay crane to the influence throughput of container
traffic. Among the three inputs themselves, berth
length, terminal area, and quay cranes are strongly
positively correlated to each other.
4.3 Maximum Likelihood Estimate
In general, all elasticity coefficients (beta) are
empirically found significant at a 5% level, showing
that all three inputs (quay crane, terminal area, and
berth length) have a significant effect on berth
throughput among container terminals. This result is
consistent with those observed by (Zheng et al., 2016;
Hlali, 2018; Yang et al., 2011). However, the berth
length and quay crane are not relevant since their
coefficients have a negative sign, the results are not
differently found in the study of (Lopez- Bermudez et
al., 2018 and Hlali, 2017). It is not surprising due to
sample composition in which difference of quay
crane and the length of the berth are too large among
terminals.
For both inefficient models (1.2.2 and 1.2.1), the
intercept and parameter of the exogenous variable
(private participation and quality of cargo handling)
have experienced negative signs except for the private
sector involvement in model 1.2.2. The negative sign
is indicating that private participation and quality of
cargo handling reduces inefficiency to the terminals
but not statistically significant. The result suggests that
both variables are not relevant in improving operating
efficiency among container terminals in Tanzania.
For private sector participation, it is concluded
that the container terminals can operate efficiently
without private participation. These results are proven
contrast with previous results reported by (Yang et
al., 2011; Liu, 2010; Demirel et al., 2012). These
studies evaluated efficiency significant level of
technical efficiency under private sector
participation. In the present study, Figure 3 shows
that the highest efficient container terminal is public
operating than its counterpart. The results provide
criticism for economic argument that private sector
involvement in the operation of container terminals
associated with high efficiency.
For the quality of cargo handling, the results
experienced an insignificant effect on the technical
efficiency among terminals. It means that the quality of
cargo handling is not associated with inefficiency
among terminals. However, the terminal of Zanzibar
and Dar es Salaam observed with high quality of cargo
handling, which is reflected their average efficiency
scores. There is another possibility of improving
technical efficiency among terminals if port authorities
would focus on improving the cargo handling services.
In the evaluation of container terminals, economics of
scale became a potential aspect in the running process
of any container terminal. The Authors are backing to
the production elasticity on the selected model herein,
the results displayed, thus comparing them with the
previous study.
Table 2: Correlation among terminals characters.
Y X
1
X
2
X
3
Y 1
X
1
0.871 1
X
2
0.967 0.951 1
X
3
0.975 0.929 0.998 1
A Study of Efficiency of Container Terminals: A Case Study of Ports in Tanzania
57

The sum of elasticity coefficients of the inputs
variables appeared to be lesser than 1, which indicates
that container terminals of Tanzanian ports shifts the
situation of constant returns to scale towards
decreasing returns to scale. The results were
supported by the study of five major container ports
that were conducted using Cobb-Douglas and
Translog function.
The summation of coefficients variable recorded
as 0.46 which is less than 1 (Yang et al., 2011).
However, the results differ from the study of
(Notteboom et al., 2000; Hlali, 2017; Suárez-Alemán
et al., 2015; Liu, 2010). The revealed behavior of
decreasing return to scale means that among the
terminals, the tendencies of using few resources of
input factors against the level of output produced
have been experienced. Therefore, the government of
Tanzania should be responsive to the port
infrastructures, investments, and policies to enhance
cargo handlings services.
In contrast with the study herein, the container
ports among 26 major ports appear to be increasing
return to scale for both model distributions (Hlali,
2017). These results suggest that 26 major ports
reached extremely usage of input factors in the
production process against the level of output
produced. The same result was observed from the
study conducted in container port of developing
countries using Cobb-Douglas function and Translog
function that tends to increased scale among the
container ports (Suárez-Alemán, et al., 2015).
However, the constant return to scale in production
process was experienced by full efficient terminals
(Almawsheki, 2015).
Management effort is required to maintain the
efficiency of handling container cargo as the results
of this study suggest that the characters of the input
among terminals are not sufficient to handle the
container cargo. Traditional inputs would surpass the
output of the production and will remain attractive to
the customers. Hence, the terminals’ authority need to
review their quality services level offered to the
customers and maintain their loyalty.
In order to decide if the model would provide
more accurate data representation in the container
terminals, several tests of the hypothesis concerning
the nature of the product function, and inefficiency
effects. The relative higher considerable value of the
log-likelihood function is satisfactory, indicating that
the model is a good fit for the dataset. This is due to
the log-likelihood is higher enough to surpass critical
value at a certain level of significance. Three null
hypotheses were assessed, and the results are
presented in Table 4.
Starting with the first null hypothesis, “There is
no technical inefficiency in the estimated model of
container terminals.” The null hypothesis was fully
rejected. That means the method used justifies the
accuracy results of the methods used.
The second hypothesis, “Technical inefficiency of
container terminals of Tanzania, is not affected by
independent variables included in the model.” This
hypothesis was also rejected, meaning that the
Table 3: Production frontier of container terminals for 2010-2018.
Variables Estimate
d
Parameters 1.1.2 1.2.1 1.2.2
Constant
𝛽
290.223 (0.044)* -13.793 (0.000) -40.315 (0.000)
Quay crane
𝛽
-7.385 (0.000) -4.916 (0.000) -4.641 (0.000)
Terminal area
𝛽
8.018 (0.000) 4.701 (0.000) 4.319 (0.000)
Berth length
𝛽
-10.669 (0.000) -3.204 (0.000) -2.292 (0.000)
Trend
𝛽
-0.144 (0.000) 0.012 (0.000)
Constant
𝛿
-5.411 (0.533) -2.467 (0.362)
Private participation
𝛿
-1.093 (0.797) 0.098 (0.965)
Quality of cargo handling
𝛿
-1.885 (0.634) -1.659 (0.438)
Total variance
𝜎
𝜎
𝜎
0.023 (0.000) 1.664 (0.000) 0.828 (0.000)
Gama ratio
𝛾
𝜎
𝜎
0.374 (0.000) 1.000 (0.000) 1.000 (0.000)
Mu
𝜇
0.251 (0.000)
Eta
𝜂
0.240 (0.000)
Lo
g
-likelihoo
d
16.87 15.866 17.985
Wald chi2 1667.280 2.75x10
7
2.99x10
8
* Maximum likelihood estimated parameter values obtained using STATA, at 5% level of significance with 100 iterations,
the p-value showed in the bracket. The panel data models with total observations 36 in fou
r
-container port terminals.
senta 2019 - The International Conference on Marine Technology (SENTA)
58

exogenous variables influence inefficiency among
container terminals in Tanzania.
The third hypothesis was developed to check if the
technical efficiency among container terminals in
Tanzania during the periods of study varies over time.
The postulate is full rejected since the likelihood ratio
test has been surpassing the critical area.
These hypotheses were valid to our entire models
in the study. As we have seen in Table 3, the model
specified as model 1.2.2 revealed that it is the most
correct estimation of the parameters. It is chosen as a
suitable model in this study because the value of log-
likelihood function displays higher enough than
remaining model that reflects better. Therefore, in any
piece of discussion of this study, we choose to
reference the model 1.2.2 as the best model among all
for container terminals studied and therefore
proposed to the authority of the terminals for policy
implication.
4.4 Technical Efficiency
In general, operating efficiency among container
terminals in Tanzania has shown a reasonable effort
in improving the handling of container cargo over
periods shows the pattern of terminals' efficiency
improvement across time under the study.
If technological changes effect was considered,
both Zanzibar and Dar es Salaam container terminals
are found to be gradually increasing technical
efficiency. Though, Zanzibar terminal might surpass
Dar es Salaam terminal just after 2016.
Tanga terminal, the pattern movements of operating
efficiency have showed relatively fluctuated efficient at
the beginning until 2014, in which it starts constant
decline its’ relative efficiency. Mtwara terminal, starting
with high efficiency in 2012 and start to operate
inefficiently until 2015 before starting to improve its
efficiency and surpass the Zanzibar terminal just before
2017. To conclude on the efficiency movement
observed herein, there is inconsistent with the efficiency
pattern among terminals. The ranked terminals
efficiency was also displayed.
On average, the most highly technical efficiency
terminal has been ranked, with Zanzibar terminal at
the first place, surpassing the Dar es Salaam terminal
for the substantial difference of 0.6 percent, while the
last place terminal was Mtwara terminal with worth
value 0.784 of average operating efficiency during
the nine periods. However, all terminals have
deviated far from the potential production frontier.
This result shows that during the periods under study
those terminals were not able to maximize output to
close the potential output on the frontier curve during
the production process (see Figure 2).
To compare the results with similar application in
the literature, it was found that the container port of
Shanghai, Singapore, Shenzhen, Ningbo, and Dalian
are the most efficient container ports among 26 major
ports which represent the higher number of
Containers handling (Hlali, 2017; Hlali, 2018). These
results are shown in contrast with all container
terminals in Tanzania which are almost efficient with
small number of container handling. The best
efficiency port was upholding the mean efficiency
0.876, while in the present study the best terminal was
sustained to the mean efficiency of 0.852. The results
Table 4: Hypotheses testing of the production frontier function.
Null hypothesis Log-likelihood function
Test Statistic (
)
Critical value (5%) Decision
𝐻
:𝛾0
17.985 36.380 2.706 Rejected
𝐻
:𝛿
𝛿
0
17.985 36.380 5.138 Rejected
𝐻
:𝜂0
16.870 34.150 2.706 Rejected
N
ote: approximate critical value at p = 5% has mixed Chi-square and obtained from Table 1 of (Kodde and Palm, 1986).
The log-likelihood function value obtained directly from the estimated maximum likelihood model (see Table 3), the
test Statistic value found from the application of Equation (5). The decision was made by comparing the difference
b
etween loglikelihood value and test statistics with critical area.
Figure 2: Individual technical efficiency among containe
r
terminals for 2010-2018.
A Study of Efficiency of Container Terminals: A Case Study of Ports in Tanzania
59
illustrate that five ports among 26 have better
management practices compared with the container
terminals of Tanzania ports.
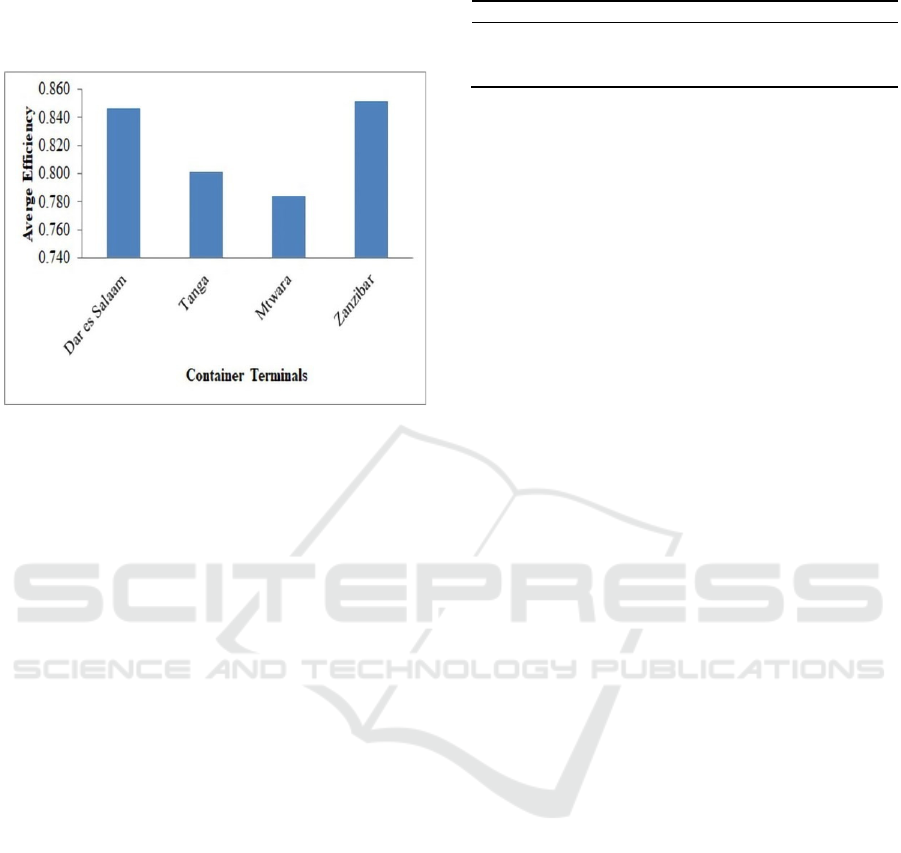
Figure 3: Technical efficiency per terminals, 2010-2018.
The estimation of the efficiency revealed that no
single port in the sample of developing economies
had reached a full efficient input combination. The
highest-ranked port reached a technical efficiency
score of 85 percent over study periods between the
years 2000 - 2010 (Suárez-Alemán et al., 2015). The
results in supporting the results found in the present
study such that the highest-ranked terminals have
reached the efficiency of scores 85.2 percent. The
exciting results found in the Dar es Salaam port the
efficiency was relative intermediate by score 0.660,
while Tanjung Perak Port, was found lower than of
about 0.550 scores of efficiency (Suárez-Alemán et
al., 2015). It is noted that the most efficient port in
this study are San Juan - Puerto Rico, Nanjing -
China, Puerto Limón - Costa Rica, Puerto Cortés -
Honduras, Jawaharlal Nehru - India all from
developing countries while the first six ranked port
Rades of Tunisia from Africa. Note that the best
model suggested in this study is model 1.2.2, which
describes the data much more precise.
Table 5 summarises a statistical description of
technical efficiency among models. It shows that on
average a typical container terminal in the sample
during the periods has an efficiency level about 0.821,
meaning that the terminal was operating at 82.1%,
which is below the maximum potential output on the
frontier. Similarly, by holding the input factors
constant there was possibility of container terminal to
increase the efficiency level by 17.9%.
The minimum efficiency level among container
terminal is 0.430, indicating that the typical terminal
operating at 43%, which is below the maximum
potential output. There was a possibility of increasing
the efficiency by 57% if the inputs factors were held
constant. The maximum technical efficiency level
among terminals was recorded at about 0.997, which
implies that the common terminal in the sample
during the period of study operating at 99.7% close to
the maximum potential output in the frontier.
Therefore, if the terminals holding the input factors
would increase to full efficiency by 0.3%.
5 CONCLUSIONS
This study builds an empirical model under the
stochastic frontier analysis framework (1.2.2) to
study the technical efficiency of container terminals
in Tanzania ports. The model is built upon the recent
panel data covering nine years (2010-2018). The
empirical model evaluates the technical efficiency of
four container terminals. The following are
conclusions and suggestions for further studies.
5.1 Conclusions
The main findings of the study are summarized as
follows:
• Only terminal area was found to be relevant factors
of production among container terminals in
Tanzania, while berth length and quay crane did not.
• Few operating resources are still used among
terminals (decreasing return to scale), which
indicates that shortage of container handling
infrastructures faces among terminals.
• Private contribution and quality of cargo handling
are insignificant factors to technical inefficiency.
Technical efficiency among terminals in Tanzania
does not have a linear relationship with private
participation and quality of cargo handling. The
highest efficient terminal operates without private
contributions.
• As the best selected model 1.2.2, the lowest
efficiency index was 0.430, and the highest was
0.997, among terminals across the period of study.
Table 5: Descriptive of technical efficiency 2010-2018.
Model Observation Mean St
d
. Dev. Min Max
1.2.2 36 0.821 0.179 0.430 0.997
1.2.1 36 0.811 0.182 0.397 0.999
1.1.2 36 0.780 0.074 0.715 0.904
senta 2019 - The International Conference on Marine Technology (SENTA)
60

• On average, the most highly efficient terminal in
container cargo handling is Zanzibar, and the least
is Mtwara terminal.
Terminals of Zanzibar and Dar es Salaam have
emerged extremely efficient technically, even though
it is well known that they are faced with congestion.
In fact, port congestion in container terminals is
unavoidable.
5.2 Suggestions
The following suggestions are provided for future
studies:
• The effects of different ownership structures of
container terminals efficiency and productivity
should be the focus on the future research on the
container terminals in ports of Tanzania.
• In the future, the study can be extended to scale and
allocate efficiency to observe if the input resources
employed with lowest cost lead to increases the
economic profit in the container terminals.
• It is strongly suggested that in the future study, the
comparative analysis with regional container port
countries can be carried out to understand the
level of efficiency in container handling services
of each presented terminals to maintain
competitive advantage.
• In the future study, the information systems usage
and services quality levels should be a prioritized
factor to be included in the investigation of
container terminal efficiency since it currently
plays a critical role in container handling services.
• An improved estimation methodology must be
paid attention on the future study regarding
container terminals efficiency.
ACKNOWLEDGEMENT
The first author would like to thank to the Ministry of
Research, Technology, and Higher Education of the
Republic of Indonesia for being awarded the KNB-
Scholarship to help conducting this research.
REFERENCES
African Development Bank, 2010. African development
report. Ports, logistics, and trade in Africa. Oxford
University Press Inc., New York.
Ago, T. E., Hualong, Y. & Fousseni, G. M., 2016.
Container ports throughput analysis: A comparative
evaluation of China and five West African Countries
Seaports efficiencies. International Journal of
Engineering Research in Africa, Vol. 22, P. 162-173.
Aigner, D., Lovell, C. A. K., & Schmidt, P., 1977.
Formulation and estimation of stochastic frontier
production function models. Journal of Econometrics,
Vol. 6, P. 21–37.
Almawsheki, E. S. & Shah, M. Z., 2015. Technical
efficiency analysis of container terminals in the Middle
Eastern Region. Asian Journal of Shipping and
Logistics. Vol. 31, No. 4, P. 477–486.
Battese, G.E., & Coelli, T.J., 1995. A model for technical
inefficiency effects in a stochastic frontier production
function for panel data. Empirical. Economics. 20 (2),
325–332.
Battese, G.E., & Coelli, T.J., 1992. Frontier production
functions, technical efficiency and panel data: with
application to paddy farmers in INDIA. J. Prod. Anal.
3 (1–2), 153–169.
Carine, A. C. F., 2015. Analyzing the operational efficiency
of container ports in Sub-saharan Africa. Open Journal
of Social Sciences, Vol. 3, P. 10-17.
Kodde D. A. & Palm F. C., 1986. Wald criteria for jointly
testing equality and inequality restrictions.
Econometrica, Vol. 54, No. 5, 1986, pp. 1243-1248
Demirel, B. Cullinane, K., & Haralambides, H., 2012.
Container terminal efficiency and private sector
participation. The Blackwell Companion to Maritime
Economics, Blackwell Publishing Ltd.
Hlali, A., 2017. Efficiency of the 26 major container ports
in 2015: Comparative analysis with different models.
International Journal of Economics & Strategies
Management of Business, Vol. 10, P. 15-20.
Hlali, A., 2018. Efficiency analysis with different models:
The case of container ports. Journal of Marine Science:
Research & Development, Vol. 8, No. 2, P. 2155-9910.
Kahyarara, G., & Simon, D., 2018. Opportunity and growth
diagnostic of maritime transportation in the Eastern and
Southern Africa. University of Dar-es- Salaam, United
Republic of Tanzania, Ad hoc expertise meeting under
IAME conference.
Liu, Q., 2010. Efficiency analysis of container ports and
terminals. Thesis Ph.D. University College London.
Liu, Z., 1995. The comparative performance of public and
private enterprises: the case of British ports. Journal of
Transport Economics and Policy, 29 (3), 263–274.
Lopez-Bermudez, B., Freire-Seoane, M. J., & Gonzalez-
Laxe, F., 2018. Efficiency and productivity of container
terminals in Brazilian ports (2008–2017). Journal of
Utilities Policy, Vol. 56, P. 82–91.
Meeusen, W., & Van den Broeck, J., 1977. Efficiency
estimation from Cobb–Douglas production functions
with composed error. International Economic Review
18 (2), 435–444.
Notteboom, T., Coeck, C., & Van den Broech, J. (2000).
Measuring and explaining the relative efficiency of
container terminals by means of Bayesian stochastic
frontier models. International Journal of Maritime
Economics, 2(2), pp.83-106.
Reker, R. A., Connell, D., & Ross, D. I., 1990. The
development of a production function for a container
A Study of Efficiency of Container Terminals: A Case Study of Ports in Tanzania
61

terminal in the port of Melbourne. Australian Transport
Research Forum, PP. 209–218.
Suárez-Alemán, A., Sarriera, J. M., Serebrisky, T., &
Trujillo, L., 2015. When it comes to container port
efficiency, are all developing regions equal? Inter-
American Development Bank, working paper series
no. IDB-WP-568.
United Nations Conference on Trade and Development,
2017. Review of Maritime Transport. Palais des
Nations, 1211 Geneva 10, Switzerland
United Nations Conference on Trade and Development,
2018. Review of Maritime Transport. Palais des
Nations, 1211 Geneva 10, Switzerland.
Yang, H., Kennedy, O. R., Lin, K., & Ruth, B., 2011. Sea-
port operational efficiency: An evaluation of five Asian
ports using stochastic frontier production function
model. Journal of service science and management,
Vol. 4, No. 3, P. 391–399.
Zheng, X. B., & Park, N. K., 2016. A study on the
efficiency of container terminals in Korea and China.
Asian Journal of Shipping and Logistics, Vol. 32, No.
4, P. 213–220.
senta 2019 - The International Conference on Marine Technology (SENTA)
62
