
Evaluation Models of Effectiveness and Efficiency of Pioneer Ship
Services: Case Study of West Papua Region
Tri Achmadi
1,a
, Pratiwi Wuryaningrum
b
and Ajeng Rizki Ayuningtyas
c
Department of Marine Transportation Engineering, Institut Teknologi Sepuluh Nopember, Indonesia
Keywords: Data Envelopment Analysis, Effectiveness, Efficiency, Pioneer Ship, Multivariate Analysis.
Abstract: The pioneer ship program is one of the programs provided by the Government of Indonesia to connect areas
that have not been commercially profitable by providing subsidies from national funds (APBN). Therefore,
the Government continues to evaluate pioneer ship services so that the subsidy is on target. This study aims
to give recommendation models for measuring the effectiveness and efficiency of pioneer ship services and
to evaluate pioneer ship services operated in route R-95 by using Multivariate Analysis and Data Envelopment
Analysis (DEA). There are five criteria to measure effectiveness, frequency and operational time of ship,
demand of passengers and goods, and load factor of ship. Measurement of efficiency is based on total costs
and fares of passengers and goods. It is obtained from the models that 7 routes are not effective and 1 route is
efficient. In order to increase effectiveness, vessel must carry at least 15% from capacity of ship. While to
increase efficiency, operator of ship must reduce operating costs at least 30%.
1 INTRODUCTION
The province of West Papua includes 598 small
islands that are around it. Being a province with a
large number of islands, there is an imbalance in
regional, economic and social development. Such
conditions make the welfare of the people in West
Papua unequal between the people who live in cities
and in the islands. One of the Government's efforts to
connect the islands in West Papua is by providing a
pioneer ship facility, where the routes served have
been determined by the Government. Based on the
Decree of the Directorate General of Sea
Transportation in 2018, 113 pioneer sea
transportation routes have been established, with a
total of 41 stopover ports. One of the pioneer ship
routes serving West Papua is R-95 with a shipping
distance of 1670 nm. Route R-95 has a base port in
Sorong City with 9 transit ports. Under these
conditions, making the R-95 route has a longer vessel
operating time, which is 14 days.
The length of time the ship sails affect the
operational costs of the ship. Cost is one of the most
important things in the operation of the ship.
Operating costs incurred are not proportional to the
income earned. To reduce the burden of costs
incurred, the Government provides assistance in the
form of subsidies to pioneer ship operators. However,
the Government does not yet know whether the
existing pioneer ship services are effective and
efficient. The effectiveness and efficiency of pioneer
ship services are important things that need to be
reviewed and considered. This is because the
operation of the pioneer ships is related to subsidies
provided by the Government to operators, where
these subsidies are obtained from the state budget
(APBN).
In this study, the authors determine the
measurement model for the effectiveness and
efficiency of pioneer ship services. The object of
research is pioneer ships operating in West Papua,
precisely on the R-95 route which has a base port in
Sorong City. The City of Sorong was chosen as the
focus of research because in meeting the daily needs
of people in the islands dependent on the City of
Sorong. In addition, the condition of the R-95 pioneer
ship route with the base port of Sorong City has 9
transit ports so the vessel's travel time is relatively
long. This makes the route needs to be re- evaluated,
both in terms of effectiveness and efficiency of
pioneer ship services. So that with this research, it is
expected to be able to solve the existing problems
through a model of measuring the effectiveness and
efficiency of the pioneering ship services produced.
Achmadi, T., Wuryaningrum, P. and Rizki Ayuningtyas, A.
Evaluation Models of Effectiveness and Efficiency of Pioneer Ship Services: Case Study of West Papua Region.
DOI: 10.5220/0010853500003261
In Proceedings of the 4th International Conference on Marine Technology (senta 2019) - Transforming Maritime Technology for Fair and Sustainable Development in the Era of Industrial
Revolution 4.0, pages 43-52
ISBN: 978-989-758-557-9; ISSN: 2795-4579
Copyright
c
2022 by SCITEPRESS – Science and Technology Publications, Lda. All rights reserved
43

2 RESEARCH METHODOLOGY
The analysis phase in this study uses 2 (two) methods
of adjusting to the model to be made, namely
Multivariate Analysis for the effectiveness model and
Data Envelopment Analysis for the efficiency model.
To determine the effectiveness measurement model,
it is necessary to identify the criteria used as a
measurement tool. There are five criteria for
measuring the effectiveness of pioneer ship services,
that is, (i) frequency of ships (each year), (ii) time of
operation of the ship (hours), (iii) number of
passengers (people/year), (iv) number of goods
(tons/year), and (v) ship load factor (%). Meanwhile,
to determine the efficiency model, the author
integrates input (total cost) and output (tariff) that
applies to passengers (Rp./ person.nm) and goods
(Rp./ ton.nm).
In addition, at this stage a sensitivity analysis
phase is carried out on the criteria that most influence
the effectiveness, level of effectiveness and efficiency
of pioneer vessel services on the R-95 route, and the
relationship between effectiveness and efficiency.
3 GENERAL DESCRIPTION
3.1 Current Condition Analysis
West Papua is one of the provinces located in eastern
Indonesia. West Papua Province is located on the
island of Papua and is bordered by the State of Papua
New Guinea. West Papua Province is the result of
division from Irian Jaya Province and was legally
recognized by the state as West Papua Province in
2007. In the beginning, Papua Island only had one
province, namely Irian Jaya Province. After
experiencing regional division, Papua Island now has
two provinces, namely West Papua and Papua.
Regional expansion is carried out by the Government
aimed to facilitate the Government in developing and
advancing the area on the island of Papua.
West Papua Province is located west of the island
of Papua, where the province includes the bird's head
region of the island of Papua and the surrounding
islands. This province is bordered directly by the
Pacific Ocean in the north, bordering North Maluku
and Maluku Provinces in the west, Cenderawasih Bay
in the east, and Seram Sea in the south.
West Papua Province has 13 districts/cities,
namely: Manokwari Regency, South Manokwari
Regency, Maybrat Regency, Arfak Mountain
Regency, Raja Ampat Regency, Sorong Regency,
South Sorong Regency, Tambrauw Regency, Bintuni
Regency, Teluk Wondama Regency, Fakfak
Regency, Kaimana Regency, and Sorong City. The
central government of West Papua Province is located
in Manokwari Regency, where the regency is located
as the Capital of the Province. The West Papua region
also has small islands which are spread across
regencies / cities. The small islands that are owned by
this province are the main attraction for tourists. One
of the islands that has become a tourist attraction is
the Raja Ampat Islands in Raja Ampat Regency (See
Figure 1).
Figure 1: Map of West Papua.
Regional conditions and uneven population
distribution in the province of West Papua have
become separate obstacles for the Government in
terms of regional development and development. This
causes the underdevelopment of regional
infrastructure, especially in the field of transportation.
Considering the condition of the land that is less
supportive for the intensification of road construction,
the Government provides an alternative to the
community in the form of procurement of sea
transportation. One of the sea transportation facilities
provided by the Government is a pioneer ship.
Pioneer ships are ships that have the task of
connecting remote areas or still lagging behind.
Pioneer ships operate on routes established by the
Government, where the area included in the route is an
area that has not been served or not served
commercially by sea transportation. West Papua is one
of the areas served by pioneer ships. This can be seen
from 22 pioneer ships that visited West Papua. The
following are 22 pioneer ship routes that stop in West
Papua such as R-51, R-57, R-58, R-65, R-69, R-72, R-
75, R-77, R-78, R-79, R-84, R-87, R-88, R-89, R-90,
R-91, R-92, R-93, R-94, R-95, R-96, and R-113.
senta 2019 - The International Conference on Marine Technology (SENTA)
44
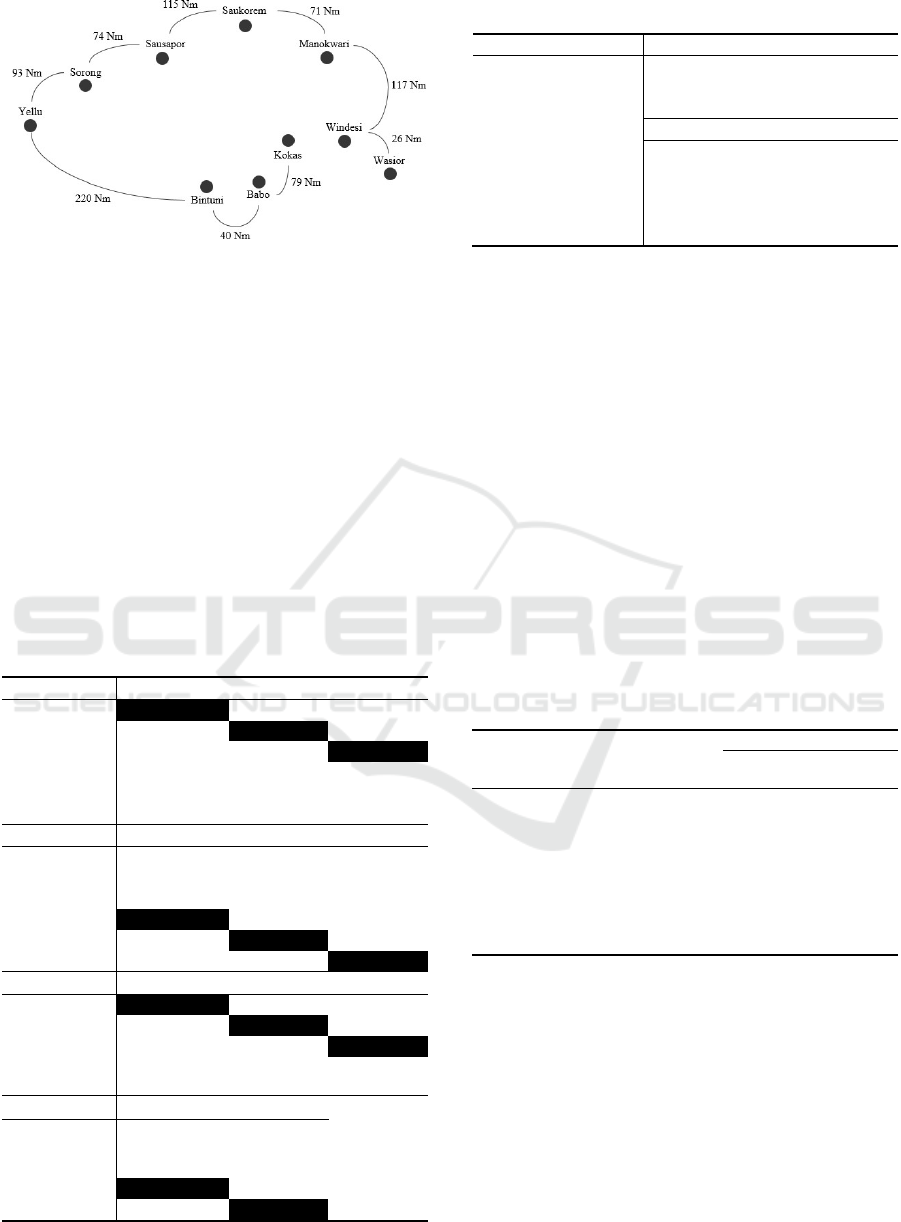
3.2 Research Location
This study choses the R-95 route as a case study,
where the R-95 route is served by KM Sabuk
Nusantara 42. The R-95 Route is one of the pioneer
routes serving West Papua, where the area served by
this route is Sorong - Sausapor - Saukorem -
Manokwari - Windesi - Wasior - Windesi -
Manokwari - Saukorem - Sausapor - Sorong – Yellu
- Bintuni - Babo - Coke - Babo - Bintuni - Yellu -
Sorong. The regions visited on the R-95 route have
been determined by the Government in the Decree of
the Sea Transportation General (see Figure 2).
Table 1: R-95 Route Distance Matrix (nm).
Sorong Sausapor Saukorem
Sorong 74 189
Sausa
p
or 74 115
Saukorem 189 115
Manokwari 260 186 71
Windesi 377 303 188
Wasior 403 329 214
Manokwari Windesi Wasior
Sorong 260 377 403
Sausa
p
or 186 303 329
Saukorem 71 188 214
Manokwari
117 143
Windesi 117 26
Wasior 143 26
Soron
g
Yellu Bintuni
Soron
g
93 313
Yellu 93 220
Bintuni 313 220
Babo 353 260 40
Kokas 432 339 119
Babo Kokas
Soron
g
353 432
Yellu 260 339
Bintuni 40 119
Babo 79
Kokas 79
Table 2: Specification of KM Sabuk Nusantara 42.
Dimensions Capacity
Loa 62.8 m Passange
r
400
p
erson
L
pp
57.36 m Car
g
o50ton
B12m
H4m Machiner
y
T 2.7 m Main Engine 1,100 HP
GT 1206 2 unit
DWT 499 ton Auxiliary Engine 210 HP
Vs 12 knot 2 unit
AB
K
12
p
erson
The R-95 route has a total distance of 1607 nm.
The distance that must be sailed by a pioneer ship has
been listed in the Decree of the Sea Transportation
General. To serve the entire area on the R-95 route,
KM Sabuk Nusantara 42 requires a 14-day voyage to
arrive at the point of origin. Table 1 shows distance
between regions on the R-95 route.
Route R-95 is served by KM Sabuk Nusantara 42.
KM Sabuk Nusantara 42 is a pioneering ship
designated by the Government to serve areas on the
R-95 route. KM Sabuk Nusantara 42 is operated by
PT. Indonesian National Shipping (PELNI). Table 2
shows the specifications of KM Sabuk Nusantara 42.
People who use KM Sabuk Nusantara 42 services
are required to pay the applicable tariff. Payment of
tariffs is made for the people who deliver goods and
the people who are passengers. The rates that apply to
KM Sabuk Nusantara 42 are shown in Table 3.
Table 3: Tariff of KM Nusantara 42.
3.3 Demand of Passengers and Goods
of R-95 Route
As explained earlier, KM Sabuk Nusantara 42 is a
pioneer ship carrying two types of cargo, namely
passengers and goods. In this study, data on the
number of passengers and goods using data in 2018
were obtained when the authors conducted a direct
field review. Figure 3 and Figure 4 shows the flow of
passengers and goods on the R-95 route.
Figure 2: R-95 Route.
O D Dist
Tariff
Pass. Goods
Rp/pax.nm Rp/ton.nm
Sorong Sausapo
r
74 9,400 8,100
Sausapo
r
Saukorem 115 13,400 11,400
Saukorem Manokwari 71 9,100 7,800
Mano
k
-wari Windesi 117 13,600 11,500
Windesi Wasio
r
26 4,700 4,000
Sorong Yellu 93 11,600 9,700
Yellu Bintuni 220 21,600 18,700
Bintuni Babo 40 6,200 5,200
Babo Kokas 79 9,800 8,500
O: Origin, D: Destination, Dist: Distance, Pass.: Passenge
r
Evaluation Models of Effectiveness and Efficiency of Pioneer Ship Services: Case Study of West Papua Region
45

Figure 3: Demand of Passengers -KM Sabuk Nusantara 42.
Figure 4: Demand of Goods - KM Sabuk Nusantara 42.
Based on the flow of passengers and goods, it can
be seen that the shipping of goods using the pioneer
ship KM Sabuk Nusantara 42 is fluctuating. Not
infrequently the ship experiences a cargo emptiness.
Such conditions did not cause the operation of the
pioneer ships to be stopped. Pioneer ships still have
to serve routes even though there is no demand for
shipping goods from the public.
4 ANALYSIS AND DISCUSSION
4.1 Measurement Criteria of
Effectiveness
In this study there are several criteria used to measure
effectiveness, namely: frequency and operational
time of ship, demand of passengers and goods, and
load factor of ship. These criteria will be arranged
into an index that can be used to measure the
effectiveness of pioneer ship services.
4.1.1 Frequency of Ship
Pioneer ships have annual target operating frequency
of the ship that has been determined by the
Government. The target frequency of operation of
pioneer vessels is stated in the Decree of the Director
General of Sea Transportation regarding the Pioneer
Sea Transportation Route Network. Pioneer ships that
operate must meet the targets set by the Government
in order to achieve the objective of conducting
pioneer ship transportation. Each pioneer ship that
operates has a different frequency target. The
difference in frequency of the ship is influenced by
the distance and time of the ship's voyage. Frequency
of KM Sabuk Nusantara 42 are 23-24 each year.
4.1.2 Operational Time of Ship (Hour)
The operating time of the ship affects the
effectiveness of the pioneer ship services. This is
because, inappropriate operation time of ships can
hamper community activities and productivity
considering that people in eastern Indonesia rely
heavily on ships as a means of transportation. Table 4
summarise operating time of KM Sabuk Nusantara
42, which serves the R-95 route.
Table 4: Operational Time of KM Sabuk Nusantara 42.
4.1.3 Load Factor of Ship (%)
Load factor of ship is the most important thing in
measuring the effectiveness of pioneer ship services.
The ship load factor is a value that shows the
usefulness of the load capacity available on the ship.
Through the load factor value, it can be seen what
percentage of vessel capacity is fulfilled. Pioneer
ships carry two types of cargo, namely passengers and
goods. Table 5 shows load factors of KM Sabuk
Nusantara 42.
O D
Dist Time (Hour) Fre
q
nm Sea Port RT
/
yea
r
Soron
g
Sausa
p
o
r
74 6.2 6 24
Sausapo
r
Saukorem 115 9.6 6 24
Saukorem Manokwari 71 5.9 6 24
Manokwari Windesi 117 9.8 6 24
Windesi Wasio
r
26 2.2 6 24
Wasio
r
Windesi 26 2.2 6 24
Windesi Manokwari 117 9.8 6 24
Manokwari Saukorem 71 5.9 6 24
Saukorem Sausa
p
o
r
115 9.6 6 24
Sausapo
r
Sorong 74 6.2 6 24
Soron
g
Yellu 93 7.8 6 24
Yellu Bintuni 220 18.3 6 24
Bintuni Babo 40 3.3 6 24
Babo Kokas 79 6.6 6 24
Kokas Babo 79 6.6 6 24
Babo Bintuni 40 3.3 6 24
Bintuni Yellu 220 18.3 6 24
Yellu Sorong 93 7.8 6 23
O: Origin, D: Destination, Dist: Distance
Fre
q
: Fre
q
uenc
y
, RT: Round Tri
p
senta 2019 - The International Conference on Marine Technology (SENTA)
46

Table 5: Load Factor of KM Sabuk Nusantara 42.
Origin Destination Load Facto
r
Sorong Sausapo
r
12%
Sausa
p
o
r
Saukore
m
4%
Saukore
m
Manokwari 0%
Manokwari Windesi 5%
Windesi Wasio
r
5%
Wasio
r
Windesi 7%
Windesi Manokwari 3%
Manokwari Saukore
m
8%
Saukore
m
Sausapo
r
0%
Sausa
p
o
r
Soron
g
2%
Soron
g
Yellu 0%
Yellu Bintuni 0%
Bintuni Babo 2%
Babo Kokas 3%
Kokas Babo 4%
Babo Bintuni 1%
Bintuni Yellu 1%
Yellu Sorong 0%
4.2 Sea Transportation Costs
Sea transportation costs consist of capital costs,
operating costs, voyage costs, loading and unloading
costs. This also applies to the operation of pioneer
ships, but the loading and unloading costs are not
charged because the loading and unloading vessels
use crane-owned equipment owned by the ship. In
this study, the components that exist in the cost of sea
transportation refer to the Ministerial Regulation No.
15 of 2017 which regulates the components of income
and costs that are calculated in the implementation of
pioneering sea transportation activities through the
assignment mechanism. Table 6 recapitulates
transportation costs of KM Sabuk Nusantara 42.
Table 6: Costs of KM Sabuk Nusantara 42.
Type Amount (Rp/year)
Capital 4,932,991,495
Operational 2,538,938,749
Vo
y
a
g
e 7,115,317,476
Total 14,587,247,720
Based on the calculation of sea transportation
costs, unit costs for each route can be obtained as
shown in Table 7.
Table 7: Unit Costs of R-95.
Origin
Destination
Unit Cost
Passenge
r
Cargo
(Rp
/
pax.nm) (Rp
/
ton.nm)
Sorong Sausapo
r
47,177 42,459
Sausa
p
o
r
Saukore
m
73,316 65,984
Saukore
m
Manokwari 45,264 40,738
Manokwari Windesi 74,591 67,132
Windesi Wasio
r
16,576 14,918
Wasio
r
Windesi 16,576 14,918
Windesi Manokwari 74,591 67,132
Manokwari Saukore
m
45,264 40,738
Saukore
m
Sausapo
r
73,316 65,984
Sausa
p
o
r
Soron
g
47,177 42,459
Sorong Yellu 59,290 53,361
Yellu Bintuni 140,256 126,230
Bintuni Babo 25,501 22,951
Babo Kokas 50,365 45,328
Kokas Babo 50,365 45,328
Babo Bintuni 25,501 22,951
Bintuni Yellu 140,256 126,230
Yellu Soron
g
59,290 53,361
4.3 Effectiveness of Pioneer Ship
Effectiveness shows success in terms of whether or
not the goals / objectives have been set. This also
applies to pioneer ships, where a pioneer ship is said
to be effective if it can reach its destination. In this
study, the effectiveness model was prepared using
Multivariate Analysis-Factor Analysis method, with
data processing tools using SPSS 22 software. The
subsequent subsections are the process of
determining the effectiveness model.
4.3.1 Kolmogorov Smirnov Test
Kolmogorov Smirnov Test is a stage that aims to test
the normality of data by comparing the distribution of
data that will be tested for normality with the standard
normal distribution. Table 8 shows the results of
Kolmogorov Smirnov's test on five effectiveness
measurement criteria.
Table 8: Result of Kolmogorov Smirnov test.
Criteria KS-0 KS-1 Result
x
1
0.24 0.32 Normal
x
2
0.17 0.32 Normal
x
3
0.16 0.32 Normal
x
4
0.29 0.32 Normal
x
5
0.10 0.32 Normal
Based on the KS test results, it appears that the
data used in this study are included in normally
distributed data.
Evaluation Models of Effectiveness and Efficiency of Pioneer Ship Services: Case Study of West Papua Region
47

Table 9: Result of Matric Correlation.
Ship_Frequenc
y
Time_ship Total_Passenge
r
Total_Cargo Load Factor_Ship
Ship_Frequenc
y
1,000 -0,039 0,587 0,264 0,369
Time
_
shi
p
-0,039 1,000 0,397 -0,312 -0,388
Total_Passenge
r
0,587 -0,397 1,000 0,683 0,844
Total
_
Car
g
o 0,264 -0,312 0,683 1,000 0,916
Load Factor_Ship 0,369 -0,388 0,844 0,916 1,000
Determinant = 0,018
4.3.2 Matrix Correlation Test
This matrix correlation test aims to determine the
relationship between variables. Correlation values
between variables can be seen from the determinant
value of the matrix. Variables are said to be unrelated
Table 10: Result of KMO – Bartlett’s test.
KMO and Bartlett's Test
Kaiser-Meyer-Olkin Measure of Sampling
Adequacy.
.626
Bartlett's Test of
Sphericity
Approx. Chi-Square
58.190
df
10
Sig.
.000
when the determinant value approaches the value 0.
Based on calculations, a determinant value of 0.018 is
obtained. The determinant value obtained is less than
1, so this indicates that multicollinearity is not
significant.
The results of the measurement of the
effectiveness and efficiency of pioneer ship services
on the R-95 route show that there are 7 route segments
that are classified as ineffective and there are 2 route
routes that are classified as efficient (see Table 9).
4.3.3 Variable Feasibility Test
Variable feasibility test is performed to find out
which variables are feasible to be used in factor
analysis. Before conducting the variable feasibility
test, a Kaiser Meyer Olkin and Bartlett test was
carried out. The Meyer Olkin and Bartlett Keizer Test
aims to find out whether the factor analysis method in
this study can be continued or not. The requirements
for a study can use the factor analysis method if the
KMO value> 0.5 and the Sig. on Bartlett’s Test <0.05
(See Table 10).
The next step in factor analysis is the variable
feasibility test. The feasibility of a variable can be
seen in the value of Measure of Sampling Adequacy
(MSA). Table 11 displays the results of the MSA test.
Table 11: Result of MSA’s test.
Anti-Image Matrices
Ship_Frequenc
y
Time
_
ship Total_Passenge
r
Total_Cargo Load Facto
r
_
Ship
Ship_Frequenc
y
0.587
a
-0.240 -0.551 -0.026 0.163
Time
_
ship -0.240 0.785
a
0.216 -0.055 0.065
Total_Passenge
r
-0.551 0.216 0.640
a
0.352 -0.686
Total_Cargo -0.026 -0.055 0.352 0.630
a
-0.858
Load Factor_Ship 0.163 0.065 -0.686 -0.858 0.598
a
a = Measures of Sampling Adequancy (MSA)
The MSA values in the above table are shown in
numbers with the sign "a". Based on the resulting
MSA value, the five variables that act as criteria for
measuring the effectiveness of pioneer ship services
have an MSA value > 0.5. Therefore, the five
variables are feasible to be used in measuring the
effectiveness of pioneer ship services.
Table 12 summarises communalities and total
variance explained, which explain the percentage of
the ability of each variable to explain an object.
Table 12: Communalities and Total Variance Explained.
Communalities Initial Eigenvalues
Initial Extraction* Total % Of Variance Cumulative %
Ship_Frequenc
y
1.000 0.304 3.073 61.461 61.461
Time_ship 1.000 0.247 0.986 19.713 81.173
Total_Passenge
r
1.000 0.857 0.701 14.015 95.188
Total_Cargo 1.000 0.758 0.197 3.949 99.137
Load Factor_Ship 1.000 0.907 0.043 0.863 100.000
*Extraction method: Principal Component Analysis
senta 2019 - The International Conference on Marine Technology (SENTA)
48

Table 13: Table of Component Matrix.
Component Matrix
a
Component
1
Shi
p_
Fre
q
uenc
y
.552
Time_ship -.497
Total
_
Passen
g
e
r
.926
Total_Cargo .870
Load Factor
_
Shi
p
.952
Extraction Method: Princi
p
al Com
p
onent
Anal
y
sis.
a. 1 components extracted.
The component column produces a loading factor
matrix whose value will be the coefficient of the
variable in explaining the object, where the object
described by the formed variable is the effectiveness
of the pioneer ship service. Degree of effectiveness of
pioneer ship is shown by the following equation.
𝑦
0,552𝑥
1
0,497𝑥
2
0,926𝑥
3
0,87𝑥
4
0,952𝑥
5
(1)
Where:
y : effectiveness of pioneer ship
x
1
: frequency of ship (each year)
x
2
: operational time of ship (hour)
x
3
: demand of passengers (person/year)
x
4
: demand of goods (tons/year)
x
5
: load factor of ship (%)
4.3.4 Effectiveness Scale
The effectiveness scale contains a range of values for
the level of effectiveness of a route (see Table 14).
Table 14: Effectiveness scale.
Nilai Effective Level
< 1.9 Ver
y
N
o
t
Effective
1 - 2.9
N
o
t
Effective
2 - 3.9 Effective Enou
g
h
3 - 4.9 Effective
> 5 Ver
y
Effective
4.4 Efficiency of Pioneer Ship Service
Table 15: Input and output.
Inpu
t
Variable Outpu
t
Variable
Passen
g
e
r
Cos
t
x
1
Passen
g
e
r
Tariff
y
1
Car
g
o Cos
t
x
2
Car
g
o Tariff
y
2
Efficiency of pioneer ship service measurement
model was prepared using the Data Envelopment
Analysis (DEA) method and processed using a solver
in a spreadsheet application. The following section
describes how to determine pioneer ship service
efficiency model.
4.4.1 Input and Output
In this study, there are input and output variables to
measure efficiency. The following variables are used
in the preparation of efficiency models (see Table 15).
4.4.2 Efficiency Measurement
The efficiency measurement that will be carried out
is oriented towards the input, without changing the
output produced. After determining the input and
output variables of the model, the next step is to
determine the UPK (Decision Making Unit). In this
study there were 18 UPKs, where the determination
of the UPK was based on the route of the route to be
measured for efficiency. Table 16 shows UPK for
each segment in R-95 route.
Table 16: Decision Making Unit of R-95 route.
Origin Destination UP
K
Sorong Sausapo
r
1
Sausa
p
o
r
Saukore
m
2
Saukore
m
Manokwari 3
Manokwari Windesi 4
Windesi Wasio
r
5
Wasio
r
Windesi 6
Windesi Manokwari 7
Manokwari Saukore
m
8
Saukore
m
Sausapo
r
9
Sausa
p
o
r
Soron
g
10
Sorong Yellu 11
Yellu Bintuni 12
Bintuni Babo 13
Babo Kokas 14
Kokas Babo 15
Babo Bintuni 16
Bintuni Yellu 17
Yellu Sorong 18
Next is to construct efficiency measurement
model which is then used to calculate level of
efficiency using MS Solver. The following equations
are the model for measuring the efficiency of pioneer
ship services.
𝑥
𝜆
𝑥
𝜃
,
𝑖1,2
𝑘1
𝑦
𝜆
𝑦
𝜃
,
𝑖1,2
𝑘1
(2)
∀𝜆
0
(3)
Evaluation Models of Effectiveness and Efficiency of Pioneer Ship Services: Case Study of West Papua Region
49
Where :
𝜃
: efficiency of DMU
𝜆
: coefficient of input and output
𝑥
: input (cost)
𝑦
: output (tariff)
i : varian of input (cost); i: 1, 2
j : varian of output (tariff); j: 1, 2
k : varian of DMU (route); k: 1, 2, ..., 18
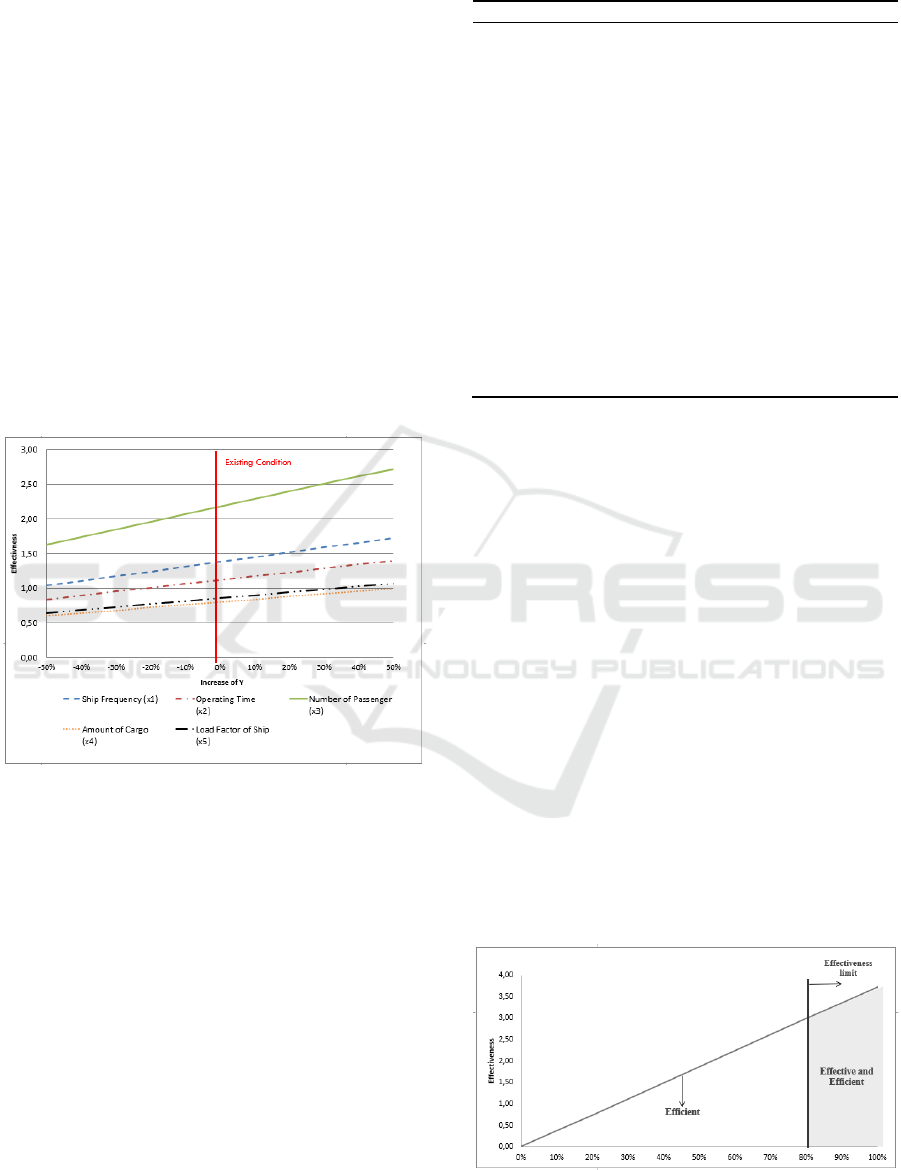
4.5 Sensitivity Analysis Effectiveness
Criteria
This analysis aims to find out which criteria have the
most significant influence on changes in the value of
effectiveness. Criteria that have a significant effect on
changes in the value of effectiveness will be seen on
the graph of the results of the analysis. Figure 5 shows
results of the sensitivity analysis of the criteria for
effectiveness.
Figure 5: Sensitivity Analysis Effectiveness Criteria.
Criteria for the number of passenger requests has
a very significant effect on the value of effectiveness
than the other four criteria. The second criterion that
influences the effectiveness of pioneer ship services
is the ship load factor. This ship load factor criteria is
currently only used by the Government in evaluating
pioneer ship services.
4.6 Effectiveness and Efficiency of R-95
In this research, the model (Equation 2 and 3) is used
to obtained level of effectiveness and efficiency of R-
95. The results are shown in Table 17.
The measurement shows that 7 (seven) route
segments are classified ineffective, while only 2 (two)
route routes are categorised efficient. In total, the
Table 17: Effectiveness dan Efficiency of R-95.
Origin Destination Effective Efficient Result
Sorong Sausapo
r
v x x
Sausa
p
o
r
Saukore
m
v x x
Saukore
m
Manokwari x x x
Mano
k
wari Windesi v x x
Windesi Wasio
r
v v v
Wasio
r
Windesi v v v
Windesi Manokwari v x x
Mano
k
wari Saukore
m
v x x
Saukore
m
Sausapo
r
x x x
Sausa
p
o
r
Soron
g
v x x
Soron
g
Yellu x x x
Yellu Bintuni x x x
Bintuni Babo v x x
Babo Kokas v x x
Kokas Babo v x x
Babo Bintuni x x x
Bintuni Yellu x x x
Yellu Sorong x x x
combination of effectiveness and efficiency gives that
only 2 (two) segments have adequate performance.
4.7 Correlation of Effectiveness and
Efficiency
Sensitivity analysis is performed to determine the
relationship between effectiveness and efficiency of
pioneer ship services. The analysis is done by
comparing the total costs incurred in the operation of
the ship, with the value of effectiveness. Through this
analysis, it will be known what percentage of cost
reduction can be done by ship operators while still
taking into account the level of effectiveness of the
ship. Table 9 shows results of the analysis of the
relationship of effectiveness and efficiency in pioneer
ship services.
The current total cost incurred for the operation of
the pioneer vessel KM Sabuk Nusantara 42 is 13
billion rupiah, of which 13 billion rupiah is assumed
at 100%. Based on the graph above, operators and the
Government can minimize ship costs by up to 20%.
Figure 6: Correlation of Effectiveness and Efficiency.
senta 2019 - The International Conference on Marine Technology (SENTA)
50

If the cost reduction is done beyond this limit, it can
reduce the effectiveness of the ship.
5 CONCLUSIONS
Based on research that has been done, the following
conclusions are obtained:
1. The West Papua region has 22 routes served by
pioneer vessels with passenger and cargo types,
namely: R-51, R-57, R-58, R-75, R-65, R-69, R-
72, R-77 , R-78, R-79, R-84, R-87, R-88, R-89, R-
90, R-91, R-92, R-93, R-94, R-95, R -96, R- 113,
where the routes are under the auspices of the
Ministry of Transportation and are operated by
BUMN and private companies that have won the
route auction.
2. Based on the analysis done, the following results
were obtained:
- Measuring the effectiveness of pioneer ship
services can be done using formulations:
y = 0.552x
1
-0,497x
2
+ 0.926x
3
+ 0.87x
4
+
0.952x
5
where:
y : effectiveness of pioneer ship
x
1
: frequency of ship (each year)
x
2
: operational time of ship (hour)
x
3
: demand of passengers (person/year)
x
4
: demand of goods (tons/year)
x
5
: load factor of ship (%)
Through this formulation, the effectiveness level
can be known through the effectiveness scale as
follows:
• < 1.9 : Very Ineffective
• 2 – 2.9 : Not Effective
• 3 – 3.9 : Effective Enough
• 4 – 4.9 : Effective
• > 5 : Very Effective
- Measurement of the efficiency of pioneer ship
services can be done using formulations:
𝜃
𝑥
𝜆
where:
𝜃
: efficiency of DMU
𝜆
: coefficient of input and output
𝑥
: input (cost)
i : varian of input (cost) ; i : 1, 2
k : varian of DMU (route) ; k : 1, 2, ..., 18
Through this formulation, it can be seen the
classification of efficiency values through the
following scale:
• 𝜃 = 1, efficient
• 𝜃 < 1, inefficient
3. Based on the results of measurements of the
effectiveness and efficiency of the pioneer ship
service on the R-95 route, it can be seen:
• Effectiveness
There are 11 routes classified as effective and 7
other route segments classified as ineffective.
The seven ineffective route segments, i.e.:
- Saukorem – Manokwari
- Saukorem – Sausapor
- Sorong – Yellu
- Yellu – Bintuni
- Babo – Bintuni
- Bintuni – Yellu
- Yellu – Sorong
• Efficiency
There are 2 (two) classified efficient route
segments, namely the Wasior - Windesi route
(and vice versa). While 16 other route segments
have efficiency values below 1, so 16 route
segments are classified as inefficient.
ACKNOWLEDGEMENTS
The author would like to thank PT. PELNI Sorong
Branch, KSOP Class I Sorong, and the Sorong
community who have assisted in the data collection
process for this research. Acknowledgments are also
addressed to the entire academic community of the
Department of Marine Transportation Engineering
and all those who helped in the work of this research.
REFERENCES
Ajibesin, A. A., Nsang, A., Oluwade, B. A., & Oladepo, O.
(2015). Input-oriented CCR DEA Model for Minimum
Energy Multicast : Empirical Study of a Computational
Method. Nigeria: University of Nigeria.
Aneta, V. (2009). Theoritical Anaylisis of Cost Efficiency
of General Cargo Transportation on Container Feeder
Lines in The Black Sea Region. Varna, Bulgaria:
Technical University.
Cooper, W. W., Seiford, L. M., & Zhu, J. (2004). Handbook
on Data Envelopment Analysis. Boston: Kluwer
Academics Publishers.
Ifadah, A. (2011). Analisis Metode Principal Component
Analysis (Komponen Utama) dan Regresi Ridge dalam
Mengatasi Dampak Multikolinearitas dalam Analisis
Regresi Linear Berganda. Semarang: Universitas
Negeri Semarang.
Evaluation Models of Effectiveness and Efficiency of Pioneer Ship Services: Case Study of West Papua Region
51

Kamal, M. S. (2017). Analisis Daya Saing Terminal
Petikemas Di Indonesia. Surabaya: Institut Teknologi
Sepuluh Nopember.
Pratidinarti, N. L. (2014). Model Pengukuran Kinerja
Logistik : Tinjauan Sektor Transportasi Laut. Surabaya:
Institut Teknologi Sepuluh Nopember.
Rambe, I. H., & Syahputra, M. R. (2017). Aplikasi Data
Envelopment Analysis (DEA) untuk Pengukuran
Efisiensi Aktivitas Produksi. Mathematics Education
and Science Vol. 2, 2.
Rencher, A. C. (2002). Methods of Multivariate Analysis
Second Edition. Canada: A John Wiley and Sons, Inc.
Publication.
Rio Jagarin Silaban, F. H. (2012). Analisis Penentuan
Variabel dari Biaya Kapal. Surabaya: Institut Teknologi
Sepuluh Nopember.
Sawindri, R. (2018). Analisis Penentuan Batas Pemberian
Subsidi untuk Kapal Perintis : Studi Kasus Bengkulu
Enggano & Enggano - Linau. Surabaya: Institut
Teknologi Sepuluh Nopember.
senta 2019 - The International Conference on Marine Technology (SENTA)
52
