
Annual Report Preparation Process in PT Energi Mega Persada, Tbk
to Face Industrial Revolution 4.0: Spearman’s Correlation
Coefficient
Mohammad Ridha and Sherin Ratna Pradita
Office Administration Laboratory, Vocational Education Program, Universitas Indonesia
Keywords: Annual Report, Spearman, industrial industry 4.0, integrated reporting, oil and gas industry, shareholder.
Abstract: This study aims to determine the Spearman’s Correlation Coefficient in the process of preparing annual
reports at PT. Energi Mega Persada, Tbk. Researchers observe this annual report as very useful for
companies engaged in the oil and gas industry as a source of information about company performance and
prospects as a basis for consideration in making investment decisions. Annual reports contain information
relating to company activities in general, accurate, open and up-to-date. The annual report also helps
companies increase the credibility and trust of investors or shareholders. An annual report is also a
promotional tool posted on the company’s website. Regular annual reports develop into integrated reporting
that is needed by companies to face the era of the Industrial Revolution 4.0. Stakeholders tend to want
annual reports that are easy to understand and can be accessed digitally. The researchers lower the factors in
the process of preparing annual reports to be the appearance, completeness, timeliness, reliability and
response. The respondents of this study were employees from 8 internal divisions. The researcher suspects
the existence of stable relationships between variables that are expected to show characteristics in the
preparation of annual reports. The results of this study are expected to determine the stages of preparing a
concise, complete and exciting annual report. This research is the development of existing literature related
to annual reports and integrated reports.
1 INTRODUCTION
Over the last few decades, the corporate annual
report has, for many modern corporations, been
transformed from a rather dull financial document to
a colourful marketing and public relations document
in which the financial statements are relegated to a
technical ‘appendix’. This transformation, it appears,
is a result of the changing corporate reporting
environment, in terms of technological, legislative
and regulatory change, as well as changing business
management practices. (Beattie, Dhanani & Jones,
2008). The company’s annual report is an instrument
to present relevant information to stakeholders in
order to be able to find out the company’s
development and achievements. Company leaders
need annual reports as a basis for making decisions
and determining the direction of the company going
forward. The annual report of Open Limited
Liability Company can publicly be seen.
Annual reports aim to provide a fair review of
the development of a company’s business and its
position. Transparent presentation of information in
annual reports is especially important for listed
companies. The consensus among financial
economists is that a productive disclosure
environment and low information asymmetry have
many desirable consequences, such as efficient
allocation of resources, capital market development,
market liquidity, decreased cost of capital, lower
return volatility and high analyst forecast accuracy.
(Pivac, Vuko & Cular, 2017). Annual reports in the
industrial revolution era 4.0 show the development
of more exciting information presentation. Graphic
design, photographs and tables are presented in a
more simple, clear and complete format.
Communities in this disruptive era tend to want a
series of information that can be easily digested but
still be complete and can be taken immediately.
In this practice, companies include extensive
voluntary disclosures regarding financial and non-
financial results, well beyond required financial
Ridha, M. and Ratna Pradita, S.
Annual Report Preparation Process in PT Energi Mega Persada, Tbk to Face Industrial Revolution 4.0: Spearman’s Correlation Coefficient.
DOI: 10.5220/0010700600002967
In Proceedings of the 4th International Conference of Vocational Higher Education (ICVHE 2019) - Empowering Human Capital Towards Sustainable 4.0 Industry, pages 511-519
ISBN: 978-989-758-530-2; ISSN: 2184-9870
Copyright
c
2021 by SCITEPRESS – Science and Technology Publications, Lda. All rights reserved
511

disclosures. Voluntary disclosure includes, for
example, carefully designed financial and non-
financial charts and graphs, impressive pictures of
products and leadership, and bold, impressive words
in print, such as improved quality and growth.
(Zeller, Stanko & Jin, 2012). Financial reports
usually become the main report in the annual report
because they contain measurable data such as
company profits. It can be seen here that annual
reports are often used as instruments to measure
company achievements in various perspectives.
Inclusion of the company’s vision and mission is to
illustrate that the process of organising company
activities is not deviant. Company achievement is
obtained from the comparison of targets and outputs.
In an excellent annual report, there is also an
overview of the company and executive summary.
Stakeholders demand for more information,
especially in the non-financial section of corporate
reporting has increased after the financial crisis
(Velte & Stawinoga, 2016). In response to this call,
organisations have increasingly been involved in the
provision of voluntary non-financial information as
part of their corporate reporting. (Appiagyei,
Djajadikerta & Xiang, 2016). Many annual reports
show more about the company’s achievement in the
quantity of activities, even though stakeholders want
to know the quality of these achievements.
Stakeholders also want data accuracy and logical
explanation.
Market participants, practitioners and regulators
alike argue that there is an essential need for more
significant investigation and understanding of
Intellectual Capital (IC) disclosure (or reporting) as
the usefulness of financial information in explaining
firm profitability continues to deteriorate. Bukh
(2005) [2], for example, asserts that traditional
disclosure mechanisms are not able to cope
adequately with the disclosure requirements of new
economy firms. (Bhasin, 2011). In this disruptive
era, the factors that need to be presented in annual
reports are not only financial resources but also
intellectual capital in the form of the development of
the competencies of their employees. Human
resources have become a determining factor for the
success of a company, so it is no longer considered a
factor of production.
The concern that traditional financial reports do
not adequately represent the multiple dimensions of
corporate value today has resulted in a search for
new financial metrics (Rappaport, 1998; Steward,
1999), and/or additional non-financial performance
measures (Kaplan and Norton, 1992 and 1996;
Sveiby, 1997). Associated with these developments
has
been a growing tendency for companies to
voluntarily disclose financial and non-financial
performance measures in their annual reports.
However, it is unclear whether this information
helps firms to gain competitive advantage and
improve company performance. (Braam &
Borghans, 2010). Decision-makers have considered
Non-financial reports. Its achievements can be
measured in terms of frequency of activities, the
number of participants, percentage increase
compared to last year. The financial statements
remain the primary exposure supported by
explanations from supporting resources.
Annual reports are undergoing a profound
transformation on the Web. The boundaries of Web-
based annual reports are dynamic and becoming less
distinct, giving the user many viewing options and
formats. The transformation is a result of companies
increasingly serving the business needs of virtual
global communities. (Haasbroek & Toit, 2003). In
the era of industrial revolution 4.0, digitalisation
played an important role. All activities cannot be
separated from the internet. Business processes,
human relations and business control can be done
online. The distance and time dimensions are no
longer the reason if there are obstacles. The process
of monitoring evaluation can also be done using
information and technology management systems.
Annual reports should be easily accessible to
stakeholders and other communities. The most
effective way to present annual reports to the entire
world is through the company’s website. The public
can easily access and upload the company’s limited
company annual reports open to the interests of
share purchase decisions and to science.
The call by stakeholders of firms for enhanced
reporting of corporate responsibility and other
information that impact business performance has
gained pace worldwide due to several impromptu
corporate collapses and financial crises. The
business environment has drastically changed and
has become complex whereby information spreads
through social media and internet networks as it
happens. (Juma, Orobia & Tumwebare, 2018).
Developments in the disruptive era require a
company to change according to the wishes of
society. Many new companies become competitors
and have a business process acceleration strategy. In
the end, there are winners in similar businesses. In
anticipation of intense competition, companies need
to convince stakeholders, especially shareholders.
ICVHE 2019 - The International Conference of Vocational Higher Education (ICVHE) “Empowering Human Capital Towards Sustainable
4.0 Industry”
512

The annual report is the main instrument to
showcase the overall success of the company.
The existence of new information, in addition to
the financial statements, will form new confidence
among investors. Companies that have revealed
more information is needed the investor will earn the
trust of the community. Increased public confidence
in the companies that have done the disclosure is
expected to drive the increase in stock price and
sales volume. (Gunawan & Lina, 2015). The
indicator of the company’s success is rising stock
prices and being able to face the economic crisis. Of
course, behind the rising stock prices, there are
planned business processes, measured and supported
by capital resources, facilities and human resources.
All series of company successes must be displayed
in full.
The concept of “integrated reporting” has been
gaining prominence during the last few years. In its
purest form, integrated reporting can be understood
as the convergence of the sustainability report and
the financial report into a single “narrative”—a
communication intended mainly for investors in
which top management provides its views on how
sustainability issues and initiatives are expected to
contribute to the long-term growth strategy of the
business. (Churret & Eccles, 2014). In its
development, annual reports become integrated
reports that are equipped with narratives to explain
quantitative data. The addition of graphics and
images is not just accessories, but rather to
strengthen the explanation.
The adoption of an integrated reporting
approach, overcoming the boundaries and
limitations of traditional information systems, is
expected to enhance the effectiveness of internal
control systems and to support the achievement of
financial, environmental and social results; in other
words, the sustainability of the overall performance,
thus boosting the value creation of the
organisation.Furthermore, such an approach is
expected to improve the value relevance of
traditional accounting information. (Loprevite &
Ricca, 2018). The researcher limits this research to
the preparation process for preparing the annual
report of PT. Energi Mega Persada, Tbk which is
engaged in oil and gas energy. After successfully
passing various economic conditions in Indonesia,
PT. Energi Mega Persada, Tbk is still a leading
company. There are still vast opportunities for
companies in the oil and gas energy sector to expand
overseas. Oil and gas energy is still the mainstay of
the Indonesian economy, both as a foreign exchange
producer and supplier of domestic energy needs. The
development of infrastructure and industry is
actively carried out in Indonesia, making the growth
in energy consumption an average of 7% in the last
ten years. (http://www.academia.edu, February 19,
2016). Nowadays, corporate annual reports (CARs)
are mostly used channels to disclose information to
stakeholders and are treated as a promotional tool
for the company. CARs involve many variables such
as stock exchanges and company industries. (Wang
& Li, 2012).
2 LITERATUR REVIEW
2.1 Administration
Preparations are required by the company’s internal
team and the Vendors on the stages of making the
Annual Report. This process takes about 3-4 months.
The administration is an activity business with the
implementation of wisdom to achieve a goal as
understanding in the book (“Modern Office
Administration” Drs. The Liang Genie (1995: 13)
Administration is a whole series of structuring
activities on work carried out by a group of people
in cooperation to achieve these objectives.
Activities: notes, correspondence, bookkeeping
light, type typing, agenda, which is clerical work.
Thus administration is a small part of the activities
of the administration.
Drs Soewarno Hardayaningrat quoted in his
book entitled “Introduction to the Study of
Administrative Sciences and Management” (1996:
2). The administration is the activity of note-taking,
letter-lettering, light bookkeeping, typing, and so on
that are technical (clerical work) according to the
process of making annual reports that require daily
administration to be summarised and made into an
annual report resulting from production,
information, financial data and reports, companies
obtained during the year all use administrative
activities.
2.2 Administrative Function in Making
Annual Reports
Compilation of annual reports uses administrative
functions as a guideline to carry out all activities for
preparing the Annual Report. “The functions of
Administration and management according to Luther
M. Gullick” are planning (planning), organising
(organising), staffing (procurement of labour),
directing (giving guidance), coordinating
Annual Report Preparation Process in PT Energi Mega Persada, Tbk to Face Industrial Revolution 4.0: Spearman’s Correlation Coefficient
513

(coordinating), reporting (reporting), budgeting
(budgeting ) The explanation is as follows:
1. Planning (planning), Namely in administrative
or administrative activities, definitely requires
proper and mature planning. For example data
collection, preparation of planning, data processing,
wherein these activities administration is needed.
2. Organising (organising)
Likewise with organising, where every activity
of the organisation must be in desperate need of
administration as an example in the determination of
officers or workers.
3. Staffing (procurement of labour)
It is the practice of finding, evaluating,
evaluating and establishing work relationships with
employees or labour and dismissing them if they are
no longer needed so that the workforce or employees
are determined according to their fields of expertise.
4. Directing (giving guidance)
Functions that relate to the effort in guiding,
giving suggestions, input to improve an activity that
is being carried out so that the task can be carried
out as much as possible, with satisfactory results.
5. Coordinating (coordination) That is a
coordinating process where all the interests and
objectives of the organisation implemented can be
united and can be synchronised with the place and
time.
6. Reporting (reporting) Namely how to inform
what has been done in all activities as one of the
responsibilities.
7. Budgeting (budgeting) That is how to plan
finances, how much budget is needed, where the
financing is, calculation of incoming and outgoing
money, and supervision carried out.
2.3 Understanding the Annual Report
The annual report is an achievement and
development of a company that is achieved within a
year. The annual report contains data and complete
information about the company consistently,
transparently and accurately. According to
(“Brigham Houston (2001: 38)”) the understanding
of the Annual Report (annual report) is the following
report published annually by the company to the
shareholders. This report contains necessary
financial reports and management opinions on the
company’s operations over the past year and the
company’s prospects in the future.
Whereas according to Government regulations,
namely OJK Regulations (“Financial Services
Authority Regulation Number /POJK.04/20 ..
Regarding the Annual Report of Issuers or Public
Companies”)
a. That the annual report of the Issuer or Public
Company is an essential source of information for
shareholders and the public in making investment
decisions
b. In order to improve the quality of information
disclosure on annual reports of Issuers or Public,
Companies to shareholders and the public;
c. Whereas based on the considerations as
referred to in letters a and b, it is necessary to issue a
Financial Services Authority Regulation concerning
the Annual Report of Issuers or Public Companies;
This annual report will be used at the General
Meeting of Shareholders (GMS) as consideration for
shareholders to assess the condition of the company
and also determine whether the shareholders buy or
sell their shares and provide company information
within a year (historical). In detail, the relationship
between the company’s social activities and the
community and the environment is conveyed to
external companies such as stakeholders, investors,
creditors and other parties in making economic
decisions.
2.4 Types of Annual Report
Information Disclosures
The annual report has several types of information
disclosures in the Annual Report. An annual report
containing real and mandatory information must be
available in the annual report and also exciting
things for shareholders to know more about
company information through this annual report.
According to (“Cahyani Nuswandari (2009: pp
48-57”) suggests two types of disclosures related to
annual reports, namely as follows:
“1. Mandatory Disclosure
2. Voluntary Disclosure
From the above quotation, two compulsory and
voluntary disclosures can be explained as follows:
ICVHE 2019 - The International Conference of Vocational Higher Education (ICVHE) “Empowering Human Capital Towards Sustainable
4.0 Industry”
514
1. Mandatory disclosure
Every issuer or public company registered on the
stock exchange must submit annual reports regularly
and other material information to Bapepam and the
public. Provisions concerning Obligations for
Submitting Annual Reports to Issuers and Public
Companies are regulated in rule number X.K.6
2. Voluntary Disclosure
Voluntary disclosure is the delivery of
information provided voluntarily by companies other
than mandatory disclosures. Voluntary disclosure is
information disclosure that exceeds the minimum
requirements of applicable capital market
regulations. Companies have the freedom to carry
out voluntary disclosures in annual reports, giving
rise to a variety of wide variety of voluntary
disclosures between companies.
Voluntary disclosure is one way to increase the
credibility of corporate financial reporting and to
help investors understand the company’s business
strategy (“Healy, Palepu 1993 in Sotomo, 2004”). In
the context of voluntary disclosure management
companies are free to choose to provide other
accounting information that is considered relevant in
supporting decision making by users of annual
reports (“Meek, Gary K, Clare B. Robert and Sidney
J. Gray, 1995 in Sutomo, 2004”).
2.5 Purpose of the Annual Report
According to (“Dewi (2010: 21”) the objectives of
the annual report are as follows:
1. Providing useful information for people who
understand business and economic activities in
making investment and credit decisions.
2. Providing information that is useful for
investors, creditors and other users in predicting
future cash flows.
3. Providing information about asset claims
against assets (liability and equity) and their
changes.
Investors or potential shareholders use the
Annual Report more often, while individual
investors more often use financial business
information. Annual report disclosures are related to
financial statements.
2.6 Annual Report Standards and
Regulations
Regulations in making Annual Reports are very
much needed because they are directly regulated by
the relevant institutions OJK, that made a
regulation regarding the obligation to
Chairperson of the Capital Market and Financial
Institution Supervisory Agency Number: Kep-134 /
BL / 2006 concerning Obligation to Submit Annual
Reports to Issuers and Public Companies by
stipulating Decision of the Chairperson of the new
Capital Market and Financial Institution Supervisory
Agency. For the standard content of the Annual
Report, there is a regulation Number X.K.6, number
2.
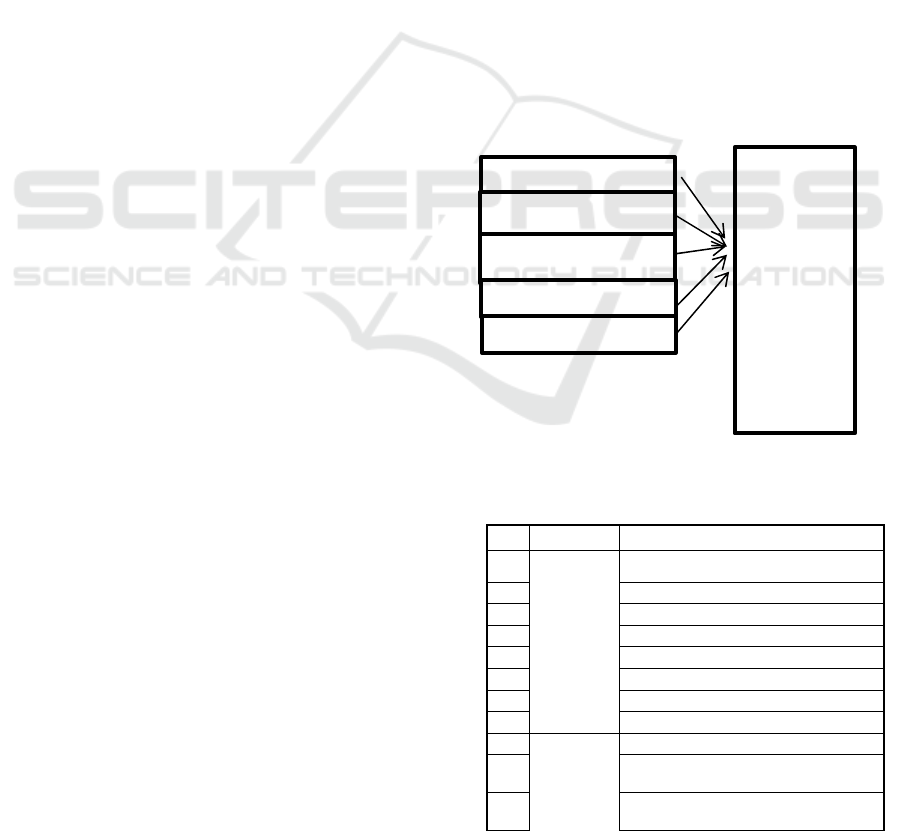
3 RESEARCH MODEL
The research model used is derived from the
Analysis of Factors in the Process of Preparing the
Annual Report at PT Energi Mega Persada Tbk.
Figure 1. Reserarch Model
Table 1 Attributes asked in the questionnaire.
No. Attribute
1
Appearan
ce
Good Indonesian and English
2 Printed with good quality
3 Font type and size are easy to read
4 State the company identity
5 Equipped with photos and tables
6 Report theme
7 The number of pages of the book
8 Linkages between images and writing
9 Equipped with statistical data
10
Complete-
ness
Compliance with Financial Services
Authority (OJK) regulations
11
Completeness of information
availability
APPEARANCE
TIMELINESS
RELIABILITY
COMPLETENES
RE
S
P
O
N
S
E
Service
Quality in
the
Process of
Preparing
the
Annual
Report at
PT Energi
Mega
Persada
Tbk
.
Annual Report Preparation Process in PT Energi Mega Persada, Tbk to Face Industrial Revolution 4.0: Spearman’s Correlation Coefficient
515
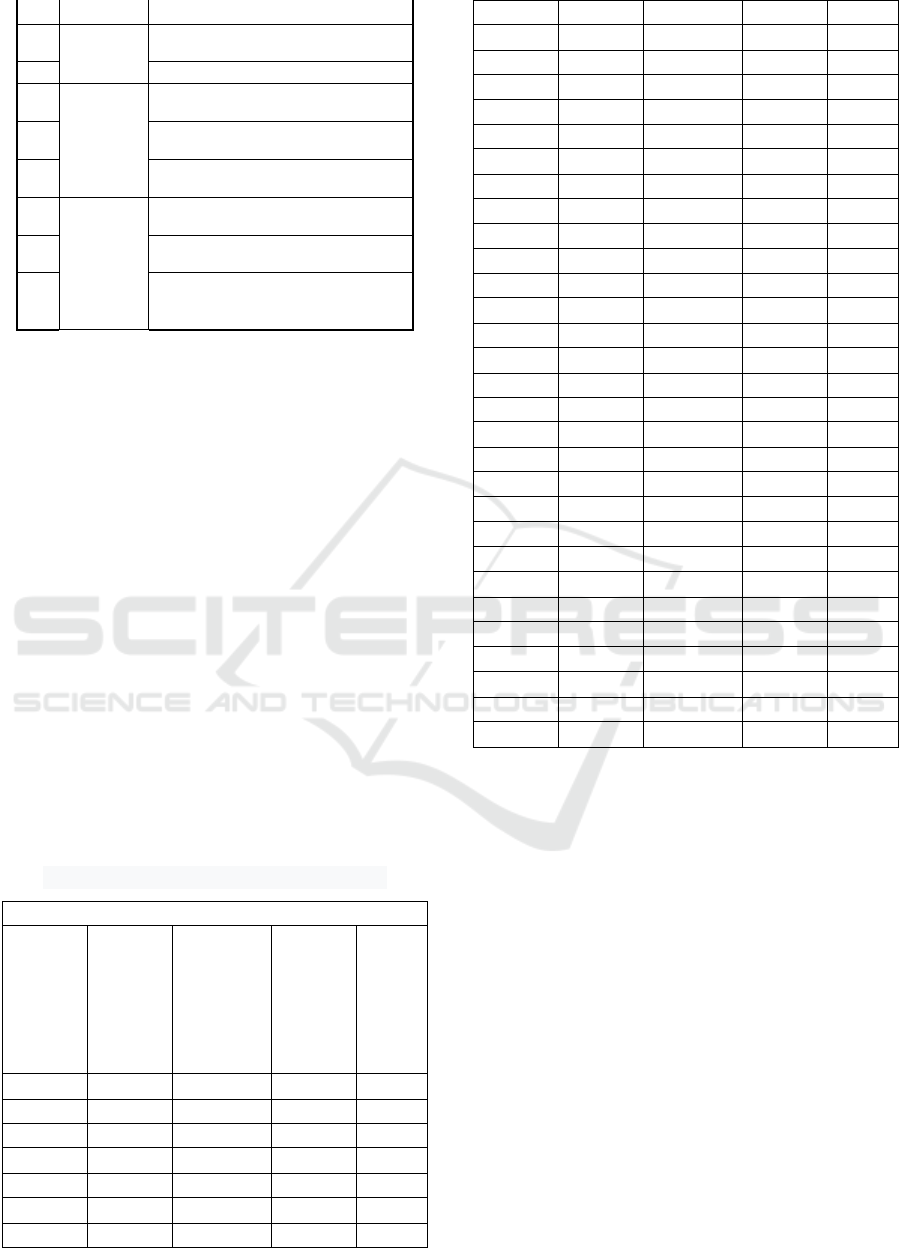
12 Completeness of company identity
13
Timelines
s
Accuracy of preparation schedule
14 Timeliness of data collection
15 Reliability
Presentation adjusted to the
transaction
16
Disclosure according to economic
reality
17
Information about financial
statements can be understoo
d
8
Response
The author’s willingness to show the
manufacturing procedure
9
The author’s willingness to respond
to the problem
2
0
Responses and willingness of the
writer in collecting data from each
division
4 ANALYSIS AND DISCUSSION
4.1 Testing of Research Hypotheses
4.1.1 Test Validity and Reliability
a. Validity test
A research instrument is said to be valid or valid
when it has high validity, and is able to be a measure
of what is desired and can reveal data from each
variable that is examined appropriately. In this study
to find out the results of the data validity test can be
seen in the Item-Total Statistics table in the
Corrected item-total Correlation column. To see the
value of r with a significance of 0.05 for the two-
tailed test and N = 29, df = (N-2), df = 29-2 = 27,
then obtained value (0.05; 27) = 0.3673, A items are
said to be valid if r count> r table.
The results of the validity test for each variable
can be seen in the following table:
Table 2: Test validity Item-Total Statistics.
Item-Total Statistics
Scale
Mean if
Item
Deleted
Scale
Variance
if Item
Deleted
Correct
ed
Item-
Total
Correla
tion
Cron
bach’
s
Alph
a if
Item
Delet
ed
App1 147.10 300.953 .633 .968
App2 147.14 301.337 .675 .968
App3 147.17 298.933 .732 .968
App4 147.07 301.924 .695 .968
App5 147.21 300.599 .731 .968
App6 147.34 304.734 .507 .969
App7 147.28 301.707 .604 .968
App8 147.31 303.507 .590 .968
App9 147.41 301.966 .667 .968
App10 147.52 301.473 .536 .969
App11 147.52 303.044 .644 .968
Com1 147.52 303.901 .604 .968
Com2 147.55 309.042 .387 .969
Com3 147.31 301.865 .818 .968
Com4 147.34 303.448 .766 .968
Com5 147.31 303.150 .666 .968
Com6 147.21 297.670 .865 .967
Com7 147.41 299.180 .794 .967
Com8 147.45 301.470 .718 .968
Com9 147.07 299.281 .751 .968
Com10 147.34 301.520 .643 .968
Com11 147.34 300.520 .637 .968
Com12 147.17 301.005 .700 .968
Com13 147.28 305.707 .479 .969
Com14 147.34 301.234 .655 .968
Com15 147.41 300.894 .659 .968
Com16 147.24 300.547 .688 .968
Com17 147.38 301.530 .572 .969
Com18 147.38 300.672 .648 .968
Time1 148.00 297.143 .621 .968
Time2 147.97 292.606 .738 .968
Rel1 147.62 302.458 .560 .969
Rel2 147.62 298.244 .728 .968
Rel3 147.38 295.887 .790 .967
Res1 147.66 299.805 .697 .968
Res2 147.55 296.042 .806 .967
Res3 147.45 294.756 .827 .967
Source: SPSS Data version 25.0 (2019)
From the results of the statistical validity test
data above, it can be seen that none of the statement
items is ruled out because the result r value> r Table
is thus the whole item of the Brand Image variable
statement is valid.
b. Reliability Test
Reliability test is a measure that shows stability
in measuring. Stability here means that the
questionnaire is consistent if it is used to measure
concepts or constructs from one condition to
another. In this technique measurement is done only
at one time, then compare with other questions or by
measuring the correlation between answers. In the
SPSS program, this method is carried out by the
Cronbach Alpha method, where a questionnaire is
said to be reliable if the Cronbach Alpha value is
more significant than 0.60.
ICVHE 2019 - The International Conference of Vocational Higher Education (ICVHE) “Empowering Human Capital Towards Sustainable
4.0 Industry”
516
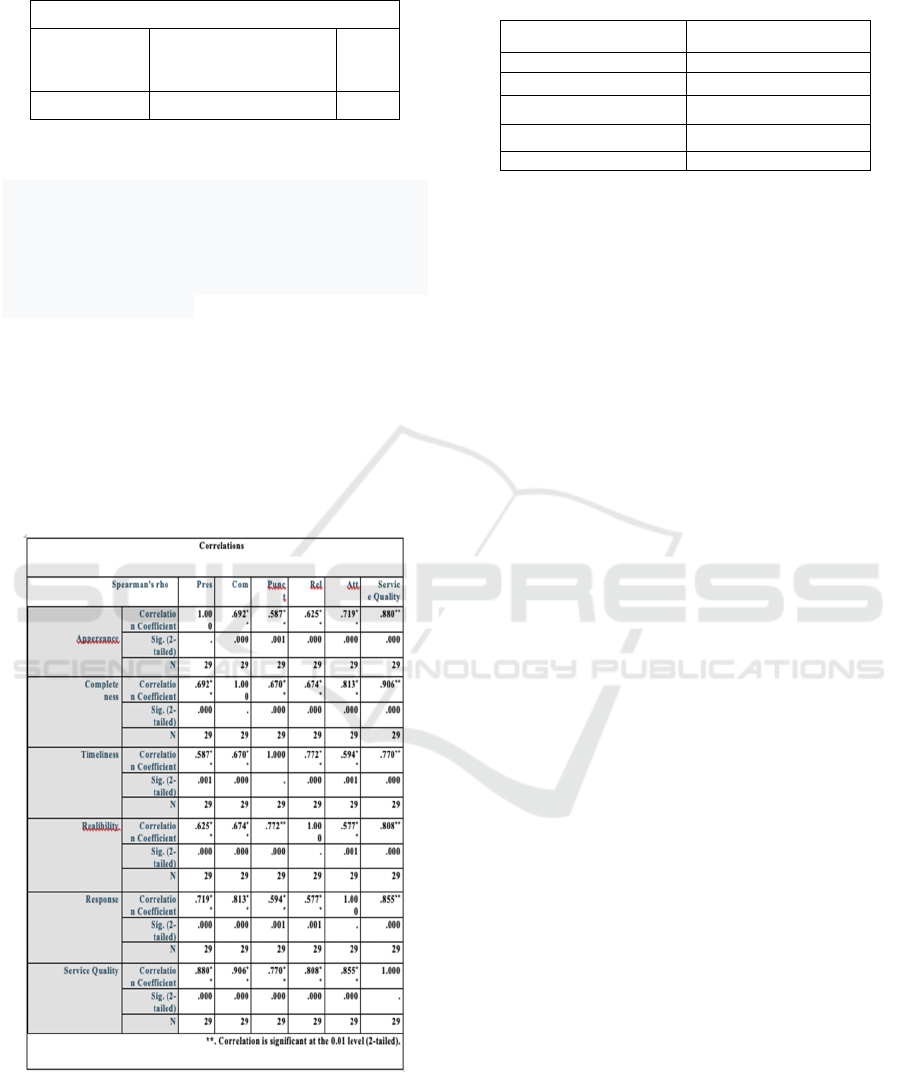
Table 3: Reliability Test
Reliability Statistics
Cronbach’s
Alpha
Cronbach’s Alpha
Based on Standardised
Items
N
of
Items
.969 .970 37
Source: SPSS Data version 25.0 (2019)
From the results of the reliability test statistical data
shows that the Cronbach’s alpha value is reliable,
because the Cronbach’s alpha value is above the
minimum limit of 0.60, so it can be concluded that
the measurement scale for service quality variables
has excellent reliability.
2. Partial Correlation Test (Spearman Correlation)
The data analysis technique used in this study is the
Spearman correlation test to test the relationship
between the variables studied. To find out the level
or degree of closeness of the relationship between
the variables studied, used a table of guideline
criteria for correlation coefficients, among others:
Table 4: Spearman Correlation Test
Table 5: Guidelines for Providing Interpretations of
Correlation Coefficients
Coefficient Interval Relationship Level
0,00 - 0,199 Very low
0,20 - 0,399 Low
0,40 - 0,599 Medium
0,60 - 0,799 Strong
0,80 - 1,000 Very strong
Source: Sugiyono (2012)
With the hypothesis H0: ρ = 0 (there is no
correlation between the two variables) VS H1: ρ ≠ 0
(there is a correlation between the two variables) the
following results are obtained:
1. From the data above, it can be seen that the
Spearman correlation value between
Presentation / Display and Service Quality
is = 0.880 because p-value = 0.000 is
smaller than α = 0.05, then H1 is accepted.
Conclusion there is a relationship Factor
appearance with service quality, where both
have a level of relationship “Very Strong”.
2. From the data above, it can be seen that the
Spearman correlation value between Completeness
and Service Quality is = 0.906 because p-value =
0.000 is smaller than α = 0.05, then H1 is accepted.
To conclude, there is a relationship between the
complete factor and the quality of service. Both of
which have a strong level of relationship.
3. From the data above, it can be seen that the
Spearman correlation value between Timeliness and
Service Quality is = 0.770 because p-value = 0.000
is smaller than α = 0.05, then H1 is accepted. The
conclusion is that there is a relationship between the
factor of timeliness and service quality, where both
have a level of “strong” relationship.
4. From the data above, it can be seen that the
Spearman correlation value between Reliability and
Service Quality is = 0.805 because p-value = 0.000
is smaller than α = 0.05, then H1 is accepted.
Conclusions there is a correlation between
Reliability Factors and Service Quality, where both
have a level of “Very Strong” relationship.
5. From the data above, it can be seen that the
Spearman correlation value between Attitudes /
Responses and Service Quality is = 0.855 because p-
value = 0.000 is smaller than α = 0.05, then H1 is
Annual Report Preparation Process in PT Energi Mega Persada, Tbk to Face Industrial Revolution 4.0: Spearman’s Correlation Coefficient
517

accepted. Conclusion there is a relationship between
Attitude / Response Factors and Service Quality,
where both have a level of “Very Strong”
relationship.
The researcher noticed that all factors had a
strong to a solid level of relationship to Service
Quality. However, the most substantial relationship
is the completeness factor in the annual report.
Stakeholders are very concerned about
comprehensive presentation, including executive
summary, development of each field, and future
company plans. The drafting team can be
categorised as having excellent performance if it has
completed all relevant quantitative, qualitative,
diagram and photo data. An essential aspect of the
annual report is displaying the latest data.
Completeness in preparing the annual report also
includes the ability of the drafting team to prepare
the template and be able to socialise it well. The
ability of social interaction is also needed in data
collection so that processing raw data into
interesting information can be carried out optimally.
Factors that have a relationship whose strength is
below other factors are timeliness. Stakeholders
assume that the period of annual report preparation
can be tolerated if the completion exceeds the
specified target. The withdrawal of the finalisation
of the annual report can be caused by the collection
of essential data which often needs to be reprocessed
and obtain the approval of the company leadership.
Data collection from branch offices in the regions
can also cause delays in the printing of annual
reports. The period of preparation can be arranged
more flexibly for the realisation of an annual report
that can display all activities and achievements in
full. But even though it is flexible, the company
must provide a final deadline, so that the annual
report can be used optimally for decision making, as
well as monitoring and evaluation material.
REFERENCES
Bananuka Juma, Laura Orobia, Zainab Tumwebare, The
Adoption of Integrated Reporting: A Developing
Country Perspective, Journal of Financial Reporting
and Accounting, 2018,
https://www.researchgate.net/publication/325789760
Beattie, V. and Dhanani, A. and Jones, M. (2008)
Investigating presentational change in UK annual
reports: a longitudinal perspective. Journal of Business
Communication 45(2):pp. 181-222., University of
Glasgow
Brigham, Eugene F. dan Houston, Joel F. 2001.
Fundamentals of Financial Management. Jakarta:
Salemba Empat
Cecille Churet, RobeccoSAM, Robert G. Eccles,
Integrated Reporting, Quality of Management, and
Financial Performance, Journal of Applied Corporate
Finance • Volume 26 Number 1, 2014
Creswell, John. 2015. Education Research Ed 5 : Planning,
Implementation. Jakarta: Penerbit Pustaka Pelajar
Decision of the Chairman of the Capital Market and
Financial Institution Supervisory Agency Number:
Kep-134 / BL / 2006 concerning the Obligation to
Submit Annual Reports for Issuers and Public
Companies.
Decision of the Chairman of the Capital Market and
Financial Institution Supervisory Agency Number
KEP-431 / BL / 2012 concerning Submission of the
Annual Report of Issuers or Public Companies
Financial Services Authority Regulation Number /
POJK.04/20 .. Regarding the Annual Report of Issuers
or Public Companies
F. Haasbroek, A.S.A. du Toit, Importance of digital annual
reports, South African Journal of Information
Management, Vol. 5 (1) March 2003
Geert Braam, Lex Borghans Board and auditor interlocks
and voluntary disclosure in annual reports, NiCE
Working Paper 10-111, December 2010, Nijmegen
Center for Economics (NiCE) Institute for
Management Research Radboud University Nijmegen
Gulick, Luther. 1937. Notes on the Theory of
Organization, dalam Shafritz, Jay M dan J. Steven
Ott. 1987. Classics of Organization Theory,
Brooks/Cole Publishing Company Pacific Grove,
California.
Handayaningrat, Soewarno. 1996. Introduction to
Administrative Studies and Management Studies.
Jakarta : Hj Masagung.
Hendra Gunawan, Evelyn Octa Lina, Mandatory and
Voluntary Disclosure of Annual Report on Investor
Reaction, International Journal of Economics and
Financial Issues, 2015, 5(Special Issue) 311-314., 2nd
AFAP INTERNATIONAL CONFERENCE ON
ENTREPRENEURSHIP AND BUSINESS
MANAGEMENT (AICEBM 2015),10-11 January
2015, Universiti Teknologi Malaysia, Kuala Lumpur,
Malaysia.
Huili Wang, Lixin Li, LEXICAL FEATURES IN
CORPORATE ANNUAL REPORTS: A CORPUS-
BASED STUDY European Journal of Business and
Social Sciences, Vol. 1, No. 9, pp 55-71, December
2012. URL: http://www.ejbss.com/recent.aspx ISSN:
2235 -767X )
K. Appiagyei, H. Djajadikerta and E. Xiang, 2016,
Integrated Reporting and Firm Performance : A
Research Framework, Conference Paper, School of
Business and Law, Edith Cowan University, 270
Joondalup Drive, Joondalup, Western Australia, 6027 ,
https://www.researchgate.net/publication/320163713
ICVHE 2019 - The International Conference of Vocational Higher Education (ICVHE) “Empowering Human Capital Towards Sustainable
4.0 Industry”
518

Madan Lal Bhasin Disclosure of Intellectual Capital in
Annual Reports: An Empirical Study of the Indian IT
Corporations Modern Economy, 2011, 2, 455-467
doi:10.4236/me.2011.24051 Published Online
September 2011 (http://www.SciRP.org/journal/me)
Copyright
Nuswandari, Cahyani. 2009. Financial Report Disclosures
in the Signaling Theory Perspective. Accounting
Study. Vol. 1, No.1. Hal 48- 57.
The Liang Gie, (1995) Modern Office Administration,
Yogyakarta: Libety Publishers and the Science and
Technology Study Foundation.
Snjezana Pivac, Tina Vuko, Marko Cular, Analysis of
annual report disclosure quality for listed companies in
transition countries Economic Research-Ekonomska
Istraživanja, 2017 VOL.30, NO.1, 721–731
https://doi.org/10.1080/1331677X.2017.1311231)
Salvatore Loprevite, Bruno Ricca, Daniela Rupo,
Performance Sustainability and Integrated Reporting:
Empirical Evidence from Mandatory and Voluntary
Adoption Contexts, Sustainability 2018, 10, 1351;
doi:10.3390/su10051351
Thomas Zeller, Brian Stanko, Han Jin, INVESTIGATING
PRESENTATIONAL CHANGE IN COMPANY
ANNUAL REPORTS: AN EXTENSION, Academy
of Accounting and Financial Studies Journal, Volume
16, Number 3, 2012, Loyola University Chicago
Annual Report Preparation Process in PT Energi Mega Persada, Tbk to Face Industrial Revolution 4.0: Spearman’s Correlation Coefficient
519
