
Employees’ Perception of Usefulness and Ease of Use of SAP
Information Systems: An Application of the Technology Acceptance
Model (TAM)
Sancoko, Mila Viendyasari, Athia Rahmah
Office Administration Laboratory, Vocational Education Program, Universitas Indonesia
Keywords: Perception, Information System, Technology Acceptance Model (TAM)
Abstract: This article aims to examine the relationship between perception of ease of use, perception of usefulness and
information technology acceptance of SAP application. This study use Davis Technology Acceptance Model
(TAM) as a theoretical framework. The method used is descriptive analysis method with a quantitative
approach, that is research which describes data collection on the result of the observation that has been done.
Data were collected from employees working in the spare part Departments. The findings concluded that the
use of SAP Information Systems are determined by employees’ perceptions on ease of use and usefulness of
the system. This study expands the existing literature by providing additional empirical supports on the use
of Technology Acceptance Model within the context of Indonesia. The results offer an insight into the factors
contributing to the acceptance of SAP application. This is important to ensure a sustained usage of the system
in the organisation. Information systems can help employees work more efficiently and effectively.
1 INTRODUCTION
The internet has become a new communication tool
that is used as an exchange of data. The number of
global Internet users increased from 23.2% in 2008 to
38.1% in 2013. With a global population of internet
users totaling 2.7 billion in 2013. Then in 2014, the
number of users increased to 2.9 billion and most
recently in 2015, internet users increased to 3 billion.
(Obeid & Ahmad, 2016). Information and
Communication Technology or ICT is a media that
supports data processing, information, storage,
transmission, and communication through various
types of facilities, especially the internet. The flexible
forms of ICT enable technology not only to bring
many benefits to businesses and organizations but also
become part of the movement of the organization's
activities. The willingness of people to use ICT is
influenced by social interaction and human factors.
The development of ICTs that so fast causes various
forms of knowledge and literacy to be obtained by
humans without knowing the boundaries of the place
(e.g., Home, school, work, and community) (Yu, et al.,
2017).
The influence of advances in information
technology on education is to open many learning
methods, the community is not required to be present
in the class. Information technology has made
information accessible from anywhere and by / to all
groups of people. Education has reached much of the
world and ICT has become an integral part of human
life. (Wikramanayake, 2004) In addition, the rapid
development of technology, especially the use of the
internet and computer technology, has brought
tremendous changes to the economy, society, and
culture. The basic activities used in business have
evolved from manual accounting to sophisticated
information technology. (Yusliza & T.Ramayah,
2012).
The influence of ICT also spread to various
companies in Indonesia, one of which was PT United
Tractor. PT United Tractors is a company engaged in
the largest distributor of heavy equipment in
Indonesia and has thousands of employees spread
across the Head Office and branches in all regions of
Indonesia. Within the organizational structure of PT
United Tractors is the Product Support and
Operations Department. Then under this Department,
there is the Part Division Unit which has the main
activities in the process of selling and buying. To
carry out these trading activities, employees are
required to use the SAP (System Application Product)
478
Sancoko, ., Viendyasari, M. and Rahmah, A.
Employees’ Perception of Usefulness and Ease of Use of SAP Information Systems: An Application of the Technology Acceptance Model (TAM).
DOI: 10.5220/0010700000002967
In Proceedings of the 4th International Conference of Vocational Higher Education (ICVHE 2019) - Empowering Human Capital Towards Sustainable 4.0 Industry, pages 478-482
ISBN: 978-989-758-530-2; ISSN: 2184-9870
Copyright
c
2021 by SCITEPRESS – Science and Technology Publications, Lda. All rights reserved
application. To access the SAP system United Tractor
employees must have a single identity and password.
An information system will run well if it receives
acceptance from employees. The author is interested
in knowing the perception of employee acceptance of
SAP information system applications using the Task
Acceptance Model (TAM) model.
2 LITERATURE REVIEW
2.1 Task Acceptance Model (TAM)
In the field of information system studies, there is a
need for researchers to know the actual level of use or
acceptance of IT systems in an organization. Some
methods used to measure acceptance of an
information system (Chen, et al., 2017), i.e:
a. Theory of Reasoned Action (TRA)
(Kurniawan, et al., 2013) was developed by Icek
Ajzen and Martin Fishbein. TRA is a model provide
a conceptual framework predict individual
performance in behaviour. In the TRA concept
mentioned that there were two factors determine the
intention to behave, viz individual attitude to
behavior (attitude toward behavior) and subjective
norms (subjective norms)
b. Unified Theory of Acceptance and Use of
Technology (UTAUT) (Hendrawati, 2013), In the
UTAUT research model, the intention to behave
(behavioral intention) and behavior to use technology
(use behavior) is influenced by people's perceptions
of performance expectations, business expectations (
efficiency expectancy), social influence, and
facilitating conditions which are moderated by gender
(gender), age (age), experience (voluntary), and
voluntariness.
c. Theory of Planned Behavior (TPB), is the
development of the Theory of Reasoned Action
(TRA). In this TPB a construct of perceived
behavioral control was added. This construct explains
that an individual has a great possibility to adopt a
behavior if the individual has a positive attitude
towards the behavior and gets approval from other
individuals who are close and related to the behavior
and believe that the behavior can be done with (Seni
& Ratnadi, 2017)
d. Technology Acceptance Model (TAM) is a
model for measuring the acceptance of an information
system by a user or users. TAM was developed by
Davis (1989) who adapted the Theory of Reasoned
Action (TRA) model made by Ajzen.
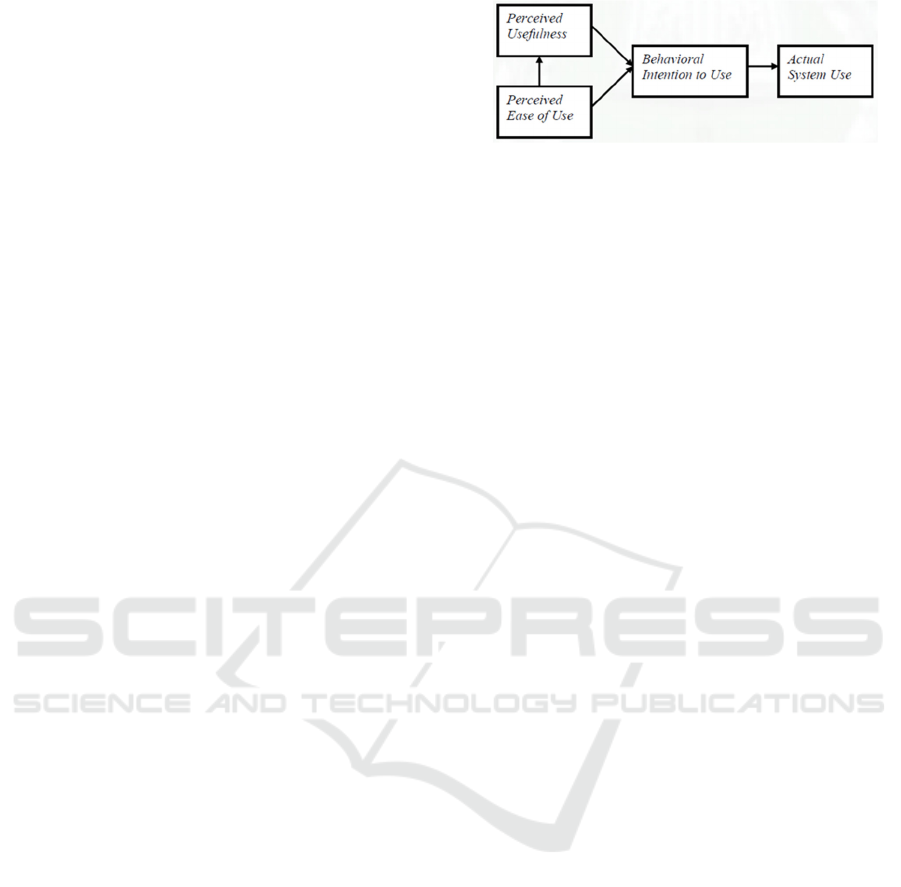
Figure 1: Technology Acceptance Model (Davis et.al 1989)
Based on figure 1 there are four components of
TAM, namely: ease to use, perception of usefulness,
behavioral intention to use and actual system use and
(Pindeh, et al., 2016). In this paper, the author will
only focus on the perception of ease to use, usefulness
perceptions.
2.2 Perceived Usefulness (PU)
In addition, Perceived of Usefulness (PU) (Misron, et
al., 2011) can specifically be defined to what extent
an information system can improve individual
performance on the job. In general, individuals tend
to adapt to new technologies if they find it useful to
achieve certain goals and help them to do their jobs
better.
2.3 Perceived Ease of Use (PEOU)
Davis (1989) defines PEOU as the extent to which
users believe that using the system is free of effort.
PEOU, unlike PU, is more related to individual
intrinsic motivation. The concept of perceived ease of
use shows the level at which someone believes that
the use of an information system is easy and does not
require the effort of the user to be able to use it. This
concept includes the clarity of the purpose of using an
information and convenience system for users. In a
study related to information systems, the higher of
ease to use received by users information system, will
increase level of perceived usefulness by the users of
system. (Osama Isaac, 2016)
3 METHODOLOGY
The method used in this research is descriptive
method of analysis with quantitative approach.
Descriptive method of analysis is a method that aims
to describe or give an idea of a research object that is
examined through samples or data that have been.
Descriptive research is research conducted to find out
the existence of independent variables, either one or
more variables (independent) without making
Employees’ Perception of Usefulness and Ease of Use of SAP Information Systems: An Application of the Technology Acceptance Model
(TAM)
479
comparisons or connecting with other variables
(Sugiyono, 2009).
To collected data, the author uses a questionnaire
with the Likert Scale. Likert scale is used by
researchers due to its simplicity in applied in social
science. Likert scale has four or more question items
combined to form a score/value that represents the
nature of the individual, for example knowledge,
attitudes, and behavior. (Budiaji, 2013).
This questionnaire adopted from Davis research.
Respondent in this research is SAP users in the
Division of Spare Part Unit. The answer consists of
four choices, namely: Strongly Agree (SS), Agree
(S), Disagree (TS), and Strongly Disagree (STS).
Scoring for Strongly Agree (SS) answers are given a
value of 4, and so on decreases until the Strongly
Disagree (STS) answer is given a value of 1.
The data analysis technique used in this research
is descriptive statistical analysis with steps which is
done as follows:
1. Determine the maximum score (SM), namely: the
ideal score achieved in an answer.
∑SM= The highest score of Likert Scale x
number of respondents.
(1)
Example; total respondents are 10, then multiply by
the highest likert scale, obtained 40
2. Determine the total score obtained (SO), namely:
The total results of data collection from respondents'
choices.
∑SO = choice of likert scale by
respondents x number of respondents
(2)
Example: total respondents 10, 5 people choose likert
scale 3, 5 people choose likert scale 4
∑SO = (3 x 5) + (4x5)
= 15 + 20
= 35
3. Determine the competency gap percentages (P)
with this formula:
P= ∑SO
∑SM
(3)
The calculation results are classified into four
categories, as follow table:
Table 1: Criteria Level
Interval (%) Category
>= 81,25 %- 100 % Strongly Agree
>= 62,50 %- <81,25 %
A
g
ree
>= 43,75 %- <62,50 % Disa
g
ree
>= 25 %- <43,75 % Stron
g
l
y
Disa
g
ree
4 RESULTS AND DISCUSSION
4.1 Respondent
Table 2: Description of Respondents
Variables
N
(%)
Age
20-30 years
24
(88.9)
31-40 years
2
(7.4)
>41 years
1
(3.7)
Sex
Male
23
(85.2)
Female
4
(
14.8
)
Education
High School
1
(
3.7
)
Associate Degree
(
D3
)
16
(
59.3
)
Bachelor’s degree
(
S1
)
8
(
29.6
)
Postgraduate (S2)
2
(
7.4
)
Length of Work
6–12 months
5
(
18.6
)
> 12 months
11
(
40.7
)
< 6 months
11
(
40.7
)
As shown in Table 2, 88.9% of respondents were
in the age range of 20-30 years. Then as many as 7.4%
of the respondents were at the age range of 31-40
years and as many as 3.7% aged over 41 years. Then
as many twenty three (85.2%) respondents were male
and four (14.8%) respondents were female.
For education indicators as many as one (3.7%)
respondents had high school (SMA/K) education,
sixteen (59.3%) had D3 education, eight (29.6%), had
S1 education, and two (11.1%) had S2 education. As
shown in table 1, five (18.6%) respondents had been
working for 6–12 months, eleven (40.7%) for more
than 12 months, and eleven (40.7%) for less than 6
months.
ICVHE 2019 - The International Conference of Vocational Higher Education (ICVHE) “Empowering Human Capital Towards Sustainable
4.0 Industry”
480
4.2 Perceived Usefulness of SAP
Information Systems
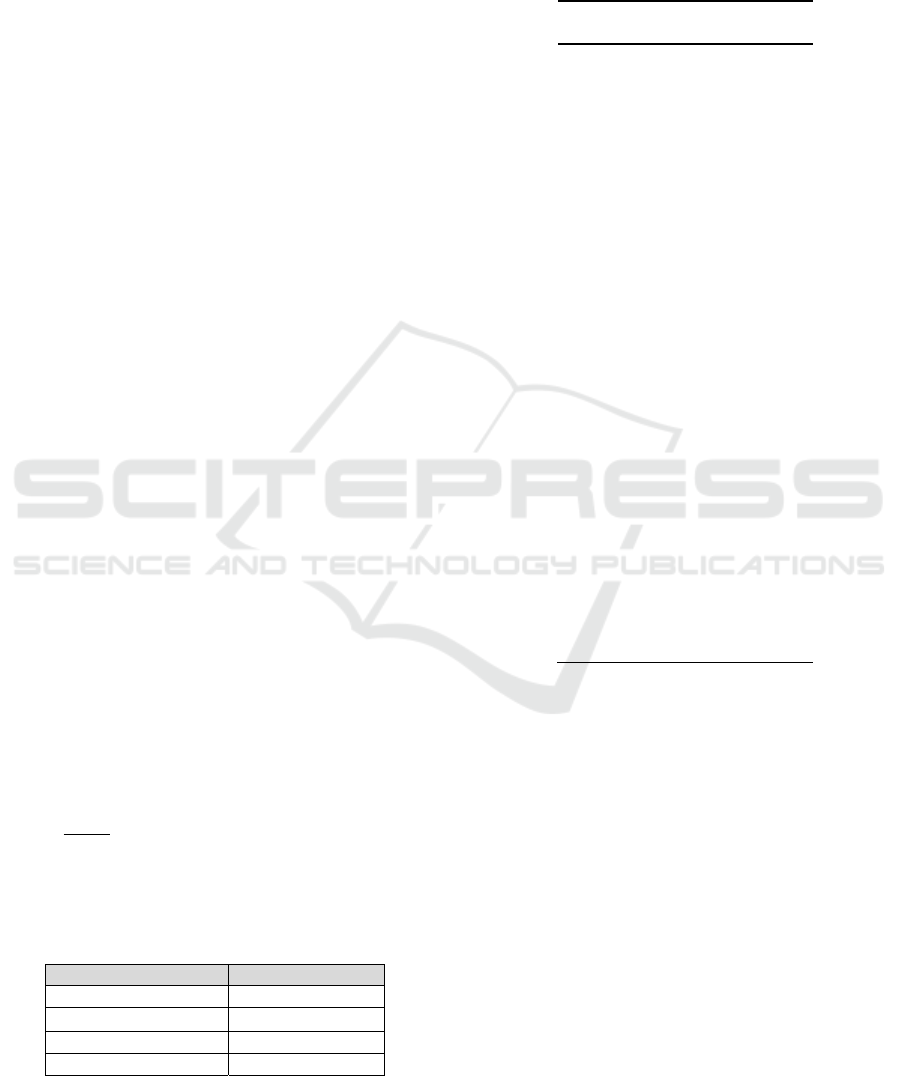
Figure 2: Percentage Perceived of Usefulness
Based on figure 2, it can be seen the distribution
of respondents' answers to indicators of perception of
usefulness. The majority of respondents chose the
answer "strongly agree" with these indicators. But
there is one indicator that needs improve: information
systems can increase “job performance”, score
“disagree” of 14.8 percent.
Using data analysis techniques the total score
obtained (SO) of 572. While the maximum score
(SM) of 648, so the percentage gap score (P) for
totally six indicator of 88 percent. With the
percentage obtained, indicator perceived
“usefulness” categorized “Strongly Agree.”
4.3 Perceived Easy to Use of SAP
Information Systems
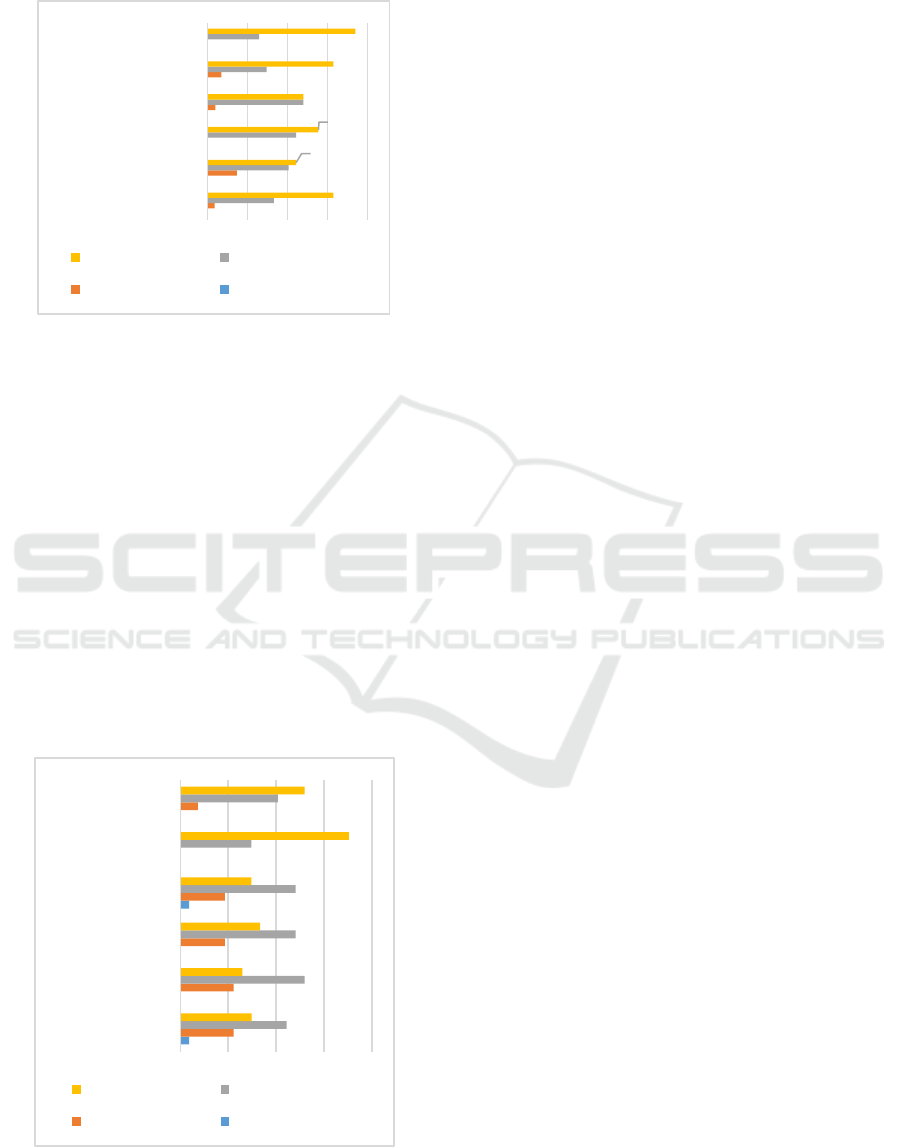
Figure 3; Percentage Perceived Easy to Use
Based on figure 3, it can be seen the distribution
of respondents' answers to indicators of perception of
easy of use. The majority of respondents choose the
answer "agree" with these indicators. There are 2
indicators that require improve that is “easy to use”
and “easy to learn” because there is a “strongly
disagree” score of 3.7 percent. Company need to
conduct intensive training to the use SAP information
system.
Using data analysis techniques the total score
obtained (SO) of 522. While the maximum score
(SM) of 648, so the percentage gap score (P) for
totally six indicator of 81 percent. With the
percentage obtained, indicator “easy to use”
categorized “Agree”.
5 CONCLUSIONS
Based on results the research of Technology
Acceptance Model (TAM) with 2 indicators, namely;
perceived ease to use and perceived usefulness,
majority of the respondents answered between
"Agree" to "Strongly Agree".
It can be concluded that the respondent accepts the
application of SAP management information systems
at United Tractor. This paper is preliminary research,
that’s descriptive research. This paper needs to
proceed to the statistical method (multiple
regression), especially the influence of PEOU and PU
on acceptance of IT.
REFERENCES
Budiaji, W., 2013. Skala Pengukuran dan Jumlah Respon
skala. Jurnal Ilmu Pertanian dan Perikanan, 2(2), pp.
127-133.
Chen, H. et al., 2017. An Extended Technology Acceptance
Model for Mobile Social Gaming Service Popularity
Analysis. Hindawi Mobile Information Systems,
Volume 2017.
Hendrawati, T., 2013. Analisa Penerimaan Sistem
Informasi Integrated Library System (INLIS): Studi
Kasus di Perpustakaan Nasonal RI. Visi Pustaka, 15(3),
pp. 153-164.
Kurniawan, D., Semuel, H. & Japarianto, E., 2013. Analisis
Penerimaan Nasabah Terhadap Layanan Mobile
Banking Dengan Menggunakan Pendekatan
Technology Acceptance Model Dan Theory Of
Reasoned Action. Jurnal Manajemen Pemasaran, 1(1),
pp. 1-13.
Misron, M. M., Shaffiei, Z. A., Hamidi, S. R. & Yusof, N.
M., 2011. Measurement of User’s Acceptance and
Perceptions towards Campus Management System
3,7%
14,8%
4,0%
7,0%
33,3%
40,7%
44,4%
48,1%
29,6%
25,9%
63,0%
44,4%
55,6%
48,1%
63,0%
74,1%
Work more quickly
job performance
increased…
effectiveness
makes job easier
useful
Strongly Agree Agree
Disagree Strongly Disagree
3,7%
3,7%
22,2%
22,2%
18,6%
18,6%
7,4%
44,4%
51,9%
48,1%
48,1%
29,6%
40,7%
29,7%
25,9%
33,3%
29,6%
70,4%
51,9%
Ease to Learn
Clear &
Understandable
Easy to Become
Skillful
Easy to Use
Flexible
Controllable
Strongly Agree Agree
Disagree Strongly Disagree
Employees’ Perception of Usefulness and Ease of Use of SAP Information Systems: An Application of the Technology Acceptance Model
(TAM)
481

(CMS) Using Technology Acceptance Model (TAM).
International Journal of Information Processing and
Management (IJIPM), 2(4), pp. 34-46.
Obeid, S. & Ahmad, M. A., 2016. A theoretical discussion
of electronic banking in Jordan by integrating
technology acceptance model and theory of planned
behavior.. International Journal of Academic Research
in Accounting, Finance and Management Sciences,
Volume 6, pp. 272-284.
Osama Isaac, Z. A. T. R. A. M. M. &. I. A., 2016. Perceived
Usefulness, Perceived Ease of Use, Perceived
Compatibility, and Net Benefits: an empirical study of
internet usage among employees in Yemen. Universiti
Teknologi MARA (UiTM), Malaysia, s.n.
Pindeh, N., Suki, N. M. & MohdSuki, N., 2016. User
Acceptance on Mobile Apps as an Effective Medium to
Learn Kadazandusun Language. Procedia Economics
and Finance, Volume 37, pp. 372-378.
Seni, N. N. A. & Ratnadi, N. M. D., 2017. Theory Of
Planned Behavior Untuk Memprediksi Niat Untuk
Berinvestasi. E-Jurnal Ekonomi dan Bisnis Universitas
Udayana, 6(12), pp. 4043-4068.
Sugiyono, 2009. Metode Penelitian Kuantitatif, Kualitatif
dan R&D. Bandung: Alfabeta.
Wikramanayake, G., 2004. Impact of Digital Technology
on Education. Colombo, s.n.
Yusliza, M. & T.Ramayah, 2012. Determinants of Attitude
Towards E-HRM: an Empirical Study Among HR
Professional. Procedia - Social and Behavioral
Sciences, Volume 57, pp. 312-319.
Yu, T. K., Lin, M. L. & Liao, Y. K., 2017. Understanding
factors influencing information communication
technology adoption behavior: The moderators of
information literacy and digital skills. Computers in
Human Behavior, Volume 71, pp. 196-208.
ICVHE 2019 - The International Conference of Vocational Higher Education (ICVHE) “Empowering Human Capital Towards Sustainable
4.0 Industry”
482
