
The Effect of Digitalization and Human Capital on Life Insurance
Demand in Indonesia
Karin Amelia Safitri
1
, Safrin Arifin
2
1
Department of Insurance Administration and Actuary, Program Pendidikan Vokasi Universitas Indonesia
2
Department of Physiotherapy, Program Pendidikan Vokasi Universitas Indonesia
Keywords: Digitalization, Human Capital, Life Insurance.
Abstract: The insurance industry has a vital role in contributing to the rate of economic growth of a country which is
directly related to the human resources and the implementation of industry revolution 4.0 through digital
transformation. This study aims to provide the evidence on the contribution of digitalization based on
communication and information technology, and human capital consisted of age dependency ratio, labour
force, and life expectancy on life insurance demand in Indonesia. This study used the 16 years of annual
data for the period from 2002-2017 and analyzed by using principal component regression for the research
method. The result indicated that digitalization and human capital have a significant effect on the demand
for life insurance products at 5%. The findings show that age dependency ratio has a negative relationship
with life insurance demand as hypothesized. The labour force, life expectancy, individuals using the internet
and broadband subscription have a positive impact on life insurance demand. Insurance industries are
recommended to develop the human capital and their digital equipment to expand the business.
1 INTRODUCTION
Life Insurance in Indonesia has become a necessity
in the life of modern society today. In Indonesia,
demand for life insurance continues to grow in line
with increased income and public awareness of the
importance of risk anticipation. The number of life
insurance companies is continuously increasing, and
so is the variety of products offered in the market to
meet the demand. Thus, the life insurance industry
began to contribute to the Indonesian economy even
though it was still categorized as relatively low.
Digitalization is the result of technological
developments that are currently developing very
rapidly. Its primary purpose is to provide
convenience and efficiency both in all aspects, such
as labour, costs, procedures and others.
Digitalization is very synonymous with the use of
electronics and computers. The presence of
computer devices further simplifies and accelerates
the growth of the digital world. Computerization is
not only limited to computing devices. Now
computerization can easily affect other devices, such
as televisions and smartphones, have been
computerized with the addition of operating systems
like conventional computer devices. Salatin (2014)
states that the development of electronic sales make
the insurance company becomes more toward
product orientation compared with customer
orientation. Previous research conducted in Kenya
where Waita and Nairobi (2014) found a positive
impact of technological developments on the growth
of microinsurance period. Indonesia is a developing
country. The last few years, the development of
technology is used in daily real life. This
development makes the researchers stated that there
is a significant influence on the existing insurance,
Lin et al., (2012) states that technology affects the
cost efficiency in the insurance industry that is only
available in developed countries but not in
developing countries.
Human capital is a combination of knowledge,
skills, and individual ability to carry out their duties
so that they can create value to achieve goals. The
goals are related to the vision and target of the
company. According to Campbell (1980), he said to
optimal the purchase of insurance. It is based on
human capital uncertainty. Ostaszewski (2003)
further stated that life insurance is a business of
securing human capital that overcomes the
uncertainty and lack of individual human capital.
364
Amelia Safitri, K. and Arifin, S.
The Effect of Digitalization and Human Capital on Life Insurance Demand in Indonesia.
DOI: 10.5220/0010685200002967
In Proceedings of the 4th International Conference of Vocational Higher Education (ICVHE 2019) - Empowering Human Capital Towards Sustainable 4.0 Industry, pages 364-369
ISBN: 978-989-758-530-2; ISSN: 2184-9870
Copyright
c
2021 by SCITEPRESS – Science and Technology Publications, Lda. All rights reserved

The objective of this study is to investigate the
impact of human capital and digitalization on the life
insurance demand. In this study, human capital is
measured by some variables, such as life
expectancy, labour force, age dependency as well as
the digitalization is also measured by the number of
individuals using internet and broadband
subscription.
2 METHODOLOGY
2.1 Data
The data used are secondary data that have
dependent variables and independent variables. The
dependent variable used is the number of life
insurance requests calculated based on the many
policies of life insurance (LI), that is, as the variable
y. Various measures of life insurance demand have
been used in empirical studies, such as premium
spending, insurance density and insurance
penetration (Beck and Webb, 2003). Dash (2018)
investigated the life insurance demand by using the
number of the policy holder to see the demographic
and socio-economic characteristics of the life
insurer. The independent variable used is human
capital measured by three indicators, namely life
expectancy (LE), labour force (LF), age dependency
ratio (AD), and digitalization which are measured by
two indicators namely the number of individuals
using the internet (ID), and the number of broadband
subscriptions (SB).
2.2 Methodology
The steps in data analysis are as follows:
1. Arrange the hypothesis in the form as follows.
a. H1: Life expectancy has a positive effect
on demand for life insurance
b. H2: The number of workers has a positive
influence on demand for life insurance
c. H3: Age dependency ratio has a negative
influence on life insurance demand
d. H4: The number of individuals who use
the internet has a positive influence on
demand for life insurance
e. H5: The amount of broadband
subscriptions has a positive influence on
the demand for life insurance
2. Explore data with descriptive statistics.
3. See the relationship of each variable X with the
variable Y using a scatter plot and see the value
of the correlation between independent
variables.
4. Perform a regression analysis to determine the
regression model with the least-squares method
5. Check the non-multicollinearity assumption by
looking at the VIF value, looking at the
coefficient of determination (R2)
6. Handling multicollinearity problems if the
assumptions of non-multicollinearity are the
regression of the main components that are
looking for eigenvalues and eigenvectors,
7. Calculating the score of the main components,
determine the number of principal components
to be used
8. Regressing between component scores
obtained with the dependent variable
9. Returns the regression equation to the standard
variable form
10. Calculate the standard error for each regression
coefficient and test using the t-test
11. Returns the regression equation to the original
variable form
12. Interpret the primary component regression
model.
2.3 Principal Component Regression
The standard form of multiple linear regression
model with independent variables is in the following
equation (Montgomery dan Peck, 1992).
𝑌
𝛽
𝛽
𝑋
⋯𝛽
𝑋
,
𝜀
1
With : 𝑌
is the independent variable for the 𝑖-th
observation, for
𝑖 1,2, … , 𝑛; 𝛽
,𝛽
,… 𝛽
These are the parameters;
𝑋
, 𝑋
,…,𝑋
,
Above is the dependent variables ; 𝜀
is the
residual (error) for the observed i-th which is
assumed to be normally distributed independently
and identical with the average 0 (zero) and variance
𝜎
.
The method used to estimate the model
parameters
Linear multiple regression is the least squares
method or often also called the ordinary least square
method (OLS). This OLS method aims to minimize
the sum of squares error, OLS estimators for 𝛽 are
as follows (Montgomery dan Peck, 1992).
𝛽
𝑋
𝑋
𝑋
𝑌 2
This study examines the effect of human capital
and digitalization on demand for life insurance. The
variable of human capital consists of life
expectancy, many workers, age dependency ratio.
While the digitalization variable consists of many
The Effect of Digitalization and Human Capital on Life Insurance Demand in Indonesia
365
individuals who use the internet and broadband
subscriptions. To test the hypothesis using multiple
linear regression with the analysis model used in this
study is:
𝐿𝐼
𝛼𝛽
𝐿𝐸 𝛽
𝐹𝐿 𝛽
𝐴𝐷 𝛽
𝐼𝐷
𝛽
𝐵𝑆 3
Multicollinearity is the linear relationship
between independent variables X in multiple
regression models. High multicollinearity causes the
probability of accepting the wrong hypothesis to
increase, and the value of R squared is high, but
none of the few coefficients is estimated to be
statistically significant. The correlation coefficient
between the X variable and the large VIF (Variance
Inflation Factors) value is a characteristic of
multicollinearity problems.
The principal component regression forms the
relationship between the dependent variable and the
principal component selected from the independent
variable (Ul-Saufie et al. 2011). The principal
component regression can solve the multicollinearity
problem (Montgomery dan Peck, 1992). The model
for principal component regression is as follows.
𝑌𝑤
𝑤
𝐾
𝑤
𝐾
⋯𝑤
𝐾
𝑣
4
With 𝐾
,𝐾
,…,𝐾
is principal component
explanatory variables, 𝑤
is intercept or intersection
point of the Y, 𝑤
,𝑤
,…,𝑤
is the principal
component regression coefficient, 𝑣 is an error
factor.
3 RESULT AND DISCUSSION
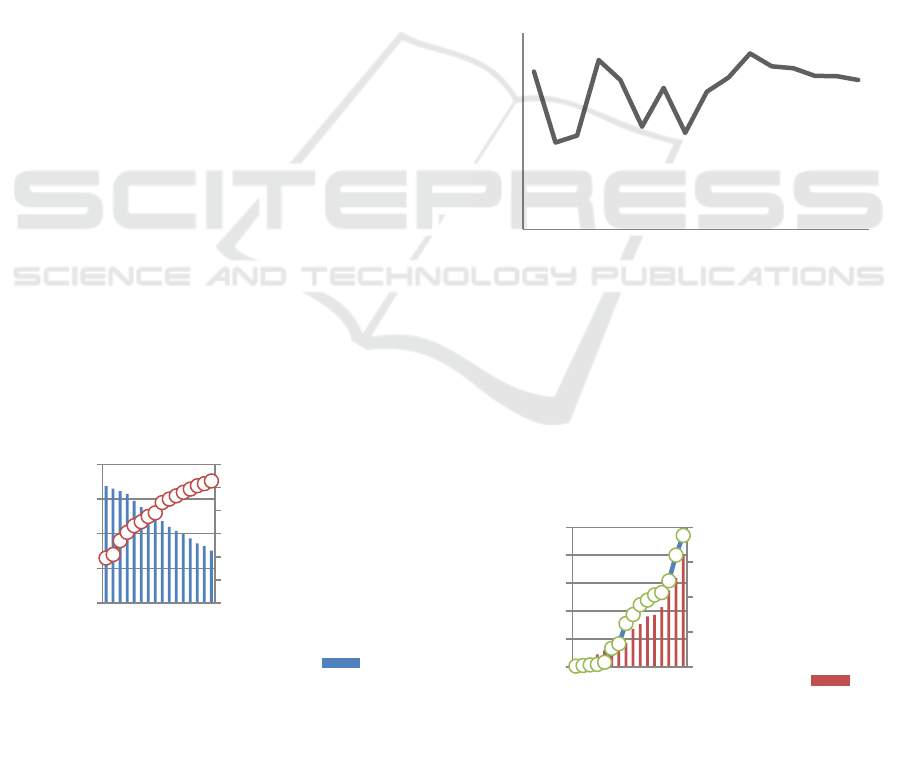
The time tren of age dependency ration and life
expectancy from 2002 till 2017 can be seen from the
figure below
Figure 1. The Age Dependency Ratio and Life Expectancy
2002-2017 in Indonesia
From Figure 1. It can be seen that age
dependency consistently decreases and life
expectancy continues to increase every year. Life
Expectancy (AHH) is an estimate of the average
additional age of a person expected to continue to
live. AHH can also be defined as the average
number of years a person has lived after the person
reached his x-th birthday. A commonly used
measure is the life expectancy at birth that reflects
the health condition at the time. Generally, regarding
AHH, the average number of years means that
someone has lived since the person was born.
Dependency Ratio is the ratio between the
population aged 0-14 years, plus the total population
65 years and over (both referred to as not the labour
force) compared to the number of population aged
15-64 years (labour force).
Below is figure 2, which shows the labour force
rate from 2002 to 2017.
Figure 2. Labor Force 2002-2017 in Indonesia
The labour force participation rates are the
number of persons who are employed and
unemployed but looking for a job divided by the
total working-age population. Labor Force
Participation Rate in Indonesia averaged 84,3
percent from 2002 until 2017, reaching an all-time
high of 87.9 percent in 2012 and a record low of
78.8 percent in 2003.
Figure 3. Individuals using Internet and Fixed Broadband
Subscription 2002-2017 in Indonesia
44
46
48
50
52
54
56
64
66
68
70
72
2002
2006
2010
2014
Life Expectancy
Age Depedency
age
depe
…
70
75
80
85
90
2002 2004 2006 2008 2010 2012 2014 2016
0
10
20
30
40
0
0,5
1
1,5
2
2,5
2002
2006
2010
2014
broadbandsubscription
IndividuuseInternet
Ind…
ICVHE 2019 - The International Conference of Vocational Higher Education (ICVHE) “Empowering Human Capital Towards Sustainable
4.0 Industry”
366

Broadband refers to an internet bandwidth
connection. The term bandwidth is generally used to
refer to data transfer speeds, in terms of computer
networks and internet connections. Data transfers are
usually measured in bits per second (bps). In
broadband internet connections, transfer speeds are
very high compared to dial-up internet connections.
There are various types of broadband internet
connections, depending on speed, cost and
availability (Figure 3).
Fixed broadband subscription refers to a fixed
subscription for high-speed access to the public
Internet (TCP / IP connection), at downstream
speeds equal to, or higher than, 256 kbit / s. This
subscription includes cable modems, DSL, fibre-to-
the-home / building, other fixed bandwidth (cable)
subscriptions, satellite broadband and terrestrial
fixed wireless broadband. This total is measured
regardless of payment method. This calculation
includes residential subscriptions and subscriptions
to organizations (Figure 4).
Figure 4. The Number of Life Insurance Policy Holder
2002-2017 in Indonesia
In this study, the number of life insurance
demand is calculated based on the number of
policies. The demand for life insurance is fluctuating
every year. The average increase in the number of
life insurance policies annually is 7.7%. In 2008, the
number of policies increased to 39.64% and a
decrease in the number of life insurance policies by
39.25%. Likewise, in 2015 there was an increase in
the number of life insurance policies by 35%. Below
is the table of descriptive statistics (Table 1).
Table 1. Descriptive Statistics
Variable Mean Dev S
t
. Min Max Med
Age depedency 51,36 1,88 48,53 54,13 51,26
Labor Force 84,28 2,92 78,84 87,92 85,33
Life
Expectancy
69,26 1,45 66,60 71,06 69,51
Internet 11,60 9,00 2,13 32,29 9,42
Broadban
d
0,85 0,78 0,02 2,36 0,86
Life Ins.
Demand
14,10 4,04 7,86 21,04 14,81
From the results of multiple linear regression
analysis obtained an R squared value of 80,1%,
indicating that the relationship between life
insurance demand with the independent variable was
80,1% while other factors caused the remaining
18,9%. Henceforth it is necessary to do simultaneous
tests and individual tests to see the effects
simultaneously and individually between the
independent variable and the dependent variable.
From the analysis results obtained the calculated F
value 8,07 with P-value 0,003, it can be said that the
independent variables simultaneously affect the
dependent variable. Table 3 shows the variance
inflation factors (VIF), which indicated the
multicollinearity problem.
Table 2. Variance Inflation Factors among Variables
N
o. Variable VIF
1A
g
e Dependenc
y
101,45
2 Labor Force 1,39
3 Life Expectancy 41,5
5
4 Individuals use
interne
t
26,1
9
5 Broadband
Subscription
55,4
5
According to Table 2., time series regression
model produced a tremendous value of VIF, which
is more than 1. Multicollinearity also can be detected
by calculating the correlation coefficient as Table 3
shown below.
Table 3. The Correlation Coefficient among Variables
Variables Labor
Force
Life
Ex
p
.
Indv.
Internet
Broadba
nd Subs.
Life
Ins.
A
g
e De
p
. -0,45 -0,9 -0,94* -0,97* -0,80*
Lab. Force 0,48 0,43 0,41 0,31
Life Ex
p
. 0,88* 0,92* 0,77*
Indv.
Intent
0,98* 0,71*
Broadband
Subs.
0,70*
From Table 3, almost all correlation coefficients
between the two variables are more significant than
0.5. This result also proves that there are
multicollinearity problems.
The next step is to perform a principal
component regression analysis. In this analysis, the
initial step taken is to transform the independent
variable 𝑋 into a variable Z by using the correlation
matrix because it is assumed that the units used in
the independent variable are not the same in order to
obtain new data with variable Z. After getting the
eigenvalue and the score of the principal component
0
5
10
15
20
25
2002
2005
2008
2011
2014
2017
life
insuranc
e
The Effect of Digitalization and Human Capital on Life Insurance Demand in Indonesia
367

then determine which principal component meets the
criteria of having eigenvalues greater than 1 (𝜆1).
PC1 is the principal components selected. Below is
the scree plot related to determining the eigenvalue
(Figure 5).
Figure 5. The Scree Plot of Eigen Value and the
Component Number
The next step is to regress the dependent variable
Y with the PC1, obtained a regression equation as
follows.
𝑌 14,10 1,50𝑃𝐶1 … 5
The regression equation obtained from the
standard variable is returned to the original variable
form (with the X variable) so that the primary
component regression model is obtained as follows.
𝑌 46,11 19,95𝑋
11,89𝑋
34,28𝑋
5,73𝑋
0,07𝑋
…6
The estimated regression coefficients of the
variables in Model 6 are reported in Table 4 below.
Table 4. The Coefficient and Calculated t-test of Principal
Components
Var. Z Coeff.
Dev. S
t
d 𝑠
𝑦
Calculated t
Z1 -0,73 0,043 -17,1721*
Z2 0,41 0,021 17,1721*
Z3 0,76 0,042 17,1721*
Z4 0,71 0,042 17,1721*
Z5 0,72 0,042 17,1721*
For the life insurance demand function, the test
statistics indicate that most of the variables are
statistically significant with the expected sign. It
suggests that in model 6, an increase of one percent
of age dependency is associated with a decrease of
about 19 percent in life insurance consumption. An
increase of 1 percent of forced labour is associated
with an increase of about 11,9 percent in life
insurance consumption. The coefficients of the
number of a broadband subscription, labour force,
life expectancy and individual using the internet
have positive signs and in each case are highly
statistically significant as expected. The coefficient
of age dependency have a negative impact and
statistically significant on life insurance demands as
hypothesized.
4 CONCLUSIONS
The growing demand for life insurance is
inseparable from the influence of the increasing
development on digital technology and human
capital. The age dependency ratio, labour force, life
expectancy, broadband subscriptions and individual
using internet services are the variables which
statistically affect the life insurance demand. It could
be a consideration for the policymakers of the
insurance industry to start developing the online
premium policy or the online claim system and their
human capital index.
REFERENCES
Apampa, O. R. 2010. Evaluation of ICT Penetration in
Selected Insurance Companies : The Lagos
Experience. J. Emerg. Trends Comput. Inf. Sci., vol. 1,
no. 1, pp. 24–30.
Beck, T.; Webb, I. 2018. Economic, Demographic and
Institutional Determinants of Life Insurance
Consumption Across Countries, World Bank
Economic Review. 17(1):51-88.
Campbell, R.A. 1980. The demand for life insurance: an
application of the economics of uncertainty. The
Journal of Finance. Vol. 35, No. 5, pp. 1155-1172.
Dash G. 2018. Determinants of life insurance demand:
evidences from India. Asia Pasific Journal of
Advanced Bussiness and Social Studies.
Lin, H. J., Wen, M. M., & Lin, W. T. 2012. The
relationships between information technology, e-
commerce, and e-finance in the financial institutions:
Evidence from the insurance industry. Lect. Notes
Comput. Sci. (including Subser. Lect. Notes Artif.
Intell. Lect. Notes Bioinformatics), vol. 7197 LNAI,
no. PART 2, pp. 194–206.
Montgomery D., Peck E. 1992. Introduction to Linear
Regression Analysis. John Wiley and Sons, New
York, NY.
Ostaszewski, K. 2003. Is life Insurance a human capital
derivatives business?. Journal of Insurance Issues, 26,
1, pp. 1-14.
Salatin, P., Yadollahi, F. and Eslamboichi, S. 2014. The
effect of ICT on the insurance industry in selected
countries,” Res. J. Econ. Bussiness ICT, vol. 9, no. 1.
Ul-Sulfie, A., Yahya, A. S., Ramli, N. A. 2011. Improving
multiple linear regression model using principal
component analysis for predicting pm10 concentration
in Seberang Prai, Pulau Pinang. International Journal
of Environmental Sciences. Vol. 2 No. 2.
ICVHE 2019 - The International Conference of Vocational Higher Education (ICVHE) “Empowering Human Capital Towards Sustainable
4.0 Industry”
368

Waita, M.C. & Nairobi, U. 2014. “the Relationship
Between Advancement in Technology, Competition,
Subsidies and the Growth of Microinsurance in
Kenya,” no. October.
The Effect of Digitalization and Human Capital on Life Insurance Demand in Indonesia
369
