
Effects of Smartphone Usage on Physical and Cardiorespiratory
Fitness in Millennials Cohort
Aditya Denny Pratama, Riza Pahlawi, Nur Fadilah Dewi and Radityo Kusumo Santoso
Vocational Education Program, Universitas Indonesia, Depok, Indonesia
Keywords: Smartphone, Cardiorespiratory Fitness, Blee p Test, Industry Revolution 4.0
Abstract: Research aims: This study attempts to investigate the effects of smartphone's uses on physical and
cardiorespiratory fitness among millennial's cohort. Methodology: This research uses quantitative and
qualitative methods using questionnaires. Data are collected from the millennial generation, namely
Vocational University students of Indonesia. Research Result: Pearson correlation test between duration using
a smartphone and the bleep test mileage variable showed a significant number (p) value of p = 0,000 (p <0.05).
This finding means that between the duration variable using a smartphone and the bleep test mileage variable
had a significant relationship. The results are reinforced by the relationship between duration and distance
variables having a correlation coefficient β -0,958, which means an increase in the duration of smartphone
use will result in a decrease in bleep test mileage. Research implication: Based on the results of this study in
accordance with existing research that the use of smartphones has a negative influence on the level of physical
and cardiorespiratory fitness among the millennial generation. Conclusion: Smartphone use, like traditional
sedentary behaviours, may disrupt physical activity and reduce cardiorespiratory fitness.
1 INTRODUCTION
In ordinary life, a person needs physical fitness.
Physical fitness is different for each person and is a
dynamic state, which requires maintenance and
coaching. Someone can be considered to be fit if he
can do his usual daily activities, his job, fulfilling his
duties and responsibilities in family and society, and
can enjoy recreation without feeling tired (Iagih et al.,
2016). By exercising, the function of the body's
organs can be optimised so that it can also optimise
fitness. With excellent fitness, a person can carry out
daily activities optimally, without feeling tired.
On the contrary, if a person's physical fitness is
not functional, he will feel tired even if he does not
do substantial activities. This difference in fitness
depends on each individual in maintaining fitness. In
order to get adequate body fitness, various ways can
be done, including maintaining a good lifestyle,
healthy diet, sufficient rest, and exercise regularly
(Fitzgerald, 2017).
Currently, we are in the industry 4.0 era, which is
dominated by online technology, especially the use of
increasingly dominating smartphones. The use of
smartphones today is not only intended as a two-way
communication tool such as exchanging text
messages or making calls but also changing into a
digital lifestyle quickly. Of the total population in the
world, it is estimated that almost 90% have access to
the internet, primarily through smartphones and
computers. This situation has been the consequence
that social media is an everyday consumption,
especially among millennials (Barkley and Lepp,
2016). Based on a survey conducted by Secure
Envoy, a company specialising in digital passwords,
which surveyed 1,000 people in the UK concluded
that nowadays students experience nomophobia,
which is anxiety and fear if they are not with their
smart phonebook. The survey results show, 66
percent of respondents claimed they could not live
without a smartphone. This percentage is prominent
in respondents aged between 18 and 24 years. As
many as 77 percent of respondents in this age group
experienced nomophobia. For millennials, this digital
lifestyle is used to access social media, stream various
kinds of entertainment, and is used to shop on e-
commerce (Bianchi and Phillips, 2005). With easy
internet access on a smartphone, it is possible to
spend hours in a state of motion (Barkley and Lepp,
2016). This condition will certainly cause health
problems such as increased cholesterol in the blood
and impaired glucose absorption, higher energy
336
Denny Pratama, A., Pahlawi, R., Fadilah Dewi, N. and Kusumo Santoso, R.
Effects of Smartphone Usage on Physical and Cardiorespiratory Fitness in Millennials Cohort.
DOI: 10.5220/0010683900002967
In Proceedings of the 4th International Conference of Vocational Higher Education (ICVHE 2019) - Empowering Human Capital Towards Sustainable 4.0 Industry, pages 336-340
ISBN: 978-989-758-530-2; ISSN: 2184-9870
Copyright
c
2021 by SCITEPRESS – Science and Technology Publications, Lda. All rights reserved

intake and waist circumference, and of course, a
higher risk of death. Many studies show that the lack
of physical activity caused by spending too much
time playing smartphones have deteriorating health
consequences that can disrupt physical activity
behaviour and can contribute to suppressing
cardiorespiratory health.
The purpose of this study was to assess the impact
between smartphone use, physical activity, and
physical fitness (e.g., Cardiorespiration fitness) with
a sample of students in the Physiotherapy Study
Program at the University of Indonesia Vocational
Education Program. The hypothesis in this study is
the use of smartphones will be positively associated
with static activities and inversely proportional to the
quantity of physical activity; in addition, the use of a
smartphone will be inversely proportional to
cardiorespiratory fitness. As such, we argue that the
use of smartphones can affect physical activity, as
well as cardiorespiratory fitness.
2 LITERATURE REVIEW
In general, what is meant by physical fitness is a
person's ability to do daily work efficiently without
excessive fatigue so that they can still enjoy free time
(Carnethon, 2003).
Factors that influence physical fitness in
connection with physical fitness, several factors need
to be known, namely: 1) Health problems, such as
health conditions, infectious and chronic diseases. 2)
Nutrition problems, such as lack of protein, calories,
low nutrition, and inadequate nutrition. 3) Physical
exercise problems, such as the age of starting
exercise, prelinguistic exercise frequency, training
intensity, and exercise volume. 4) Problems with
heredity, such as anthropometric and congenital
abnormalities (Panahi et al., 2016).
The research instrument used was the Multi-Stage
Fitness Test/Bleep Test. The aim is to measure the
level of efficiency of the function of the heart and
lungs (cardiorespiratory fitness), which is
demonstrated through the measurement of maximum
oxygen uptake (Carnethon, 2003).
Multi-Stage Fitness Test/Bleep Test is the right
way to find out the components of endurance through
testing. One form of field test used to determine
VO2max is the Multi-Stage Fitness Test. Compared
to other tests (Cooper and Blake tests), the
implementation of this test is relatively easier and
uses a less extensive area. This test can be done in a
group. The procedure for carrying out the bleep test
is as follows.
1. The bleep test is done by running a
distance of 20 meters back and forth,
which starts with a slow run in stages that
gets faster and faster until the athlete is
unable to keep up with the rhythm of
running time, meaning his maximum
ability at that level of back and forth.
2. Time for each level is 1 minute.
3. Level 1 a distance of 20 meters is taken in
8.6 seconds in 7 trips.
4. Level 2 and 3 a distance of 20 meters are
taken in 7.5 seconds in 8 trips.
5. Level 4 and 5 a distance of 20 meters are
taken in 6.7 seconds in 9 times back and
forth.
6. After a distance of 20 meters travelled, a
sound signal will be heard once at the end
of each level.
7. The start is done by standing, and both feet
behind the starting line. With the signal
"ready yes", athletes run in accordance
with the rhythm towards the boundary line
until one foot crosses the boundary line.
8. If the sound signal has not been heard, the
athlete has crossed the boundary line, but
to run back must wait for the audio signal.
Conversely, if there has been a sound
signal, the athlete has not reached the
boundary line, the athlete must speed up to
run past the boundary line and
immediately run back in the opposite
direction.
9. If two consecutive athletes are not able to
follow the rhythm of running time means
that their maximum ability is only at that
level and feedback.
10. If an athlete is unable to keep up with the
rhythm of running time, the athlete may
not stop, but continue to run slowly for 3-
5 minutes to cool down (Cooper Institute
for Aerobics Research, 1999).
Effects of Smartphone Usage on Physical and Cardiorespiratory Fitness in Millennials Cohort
337
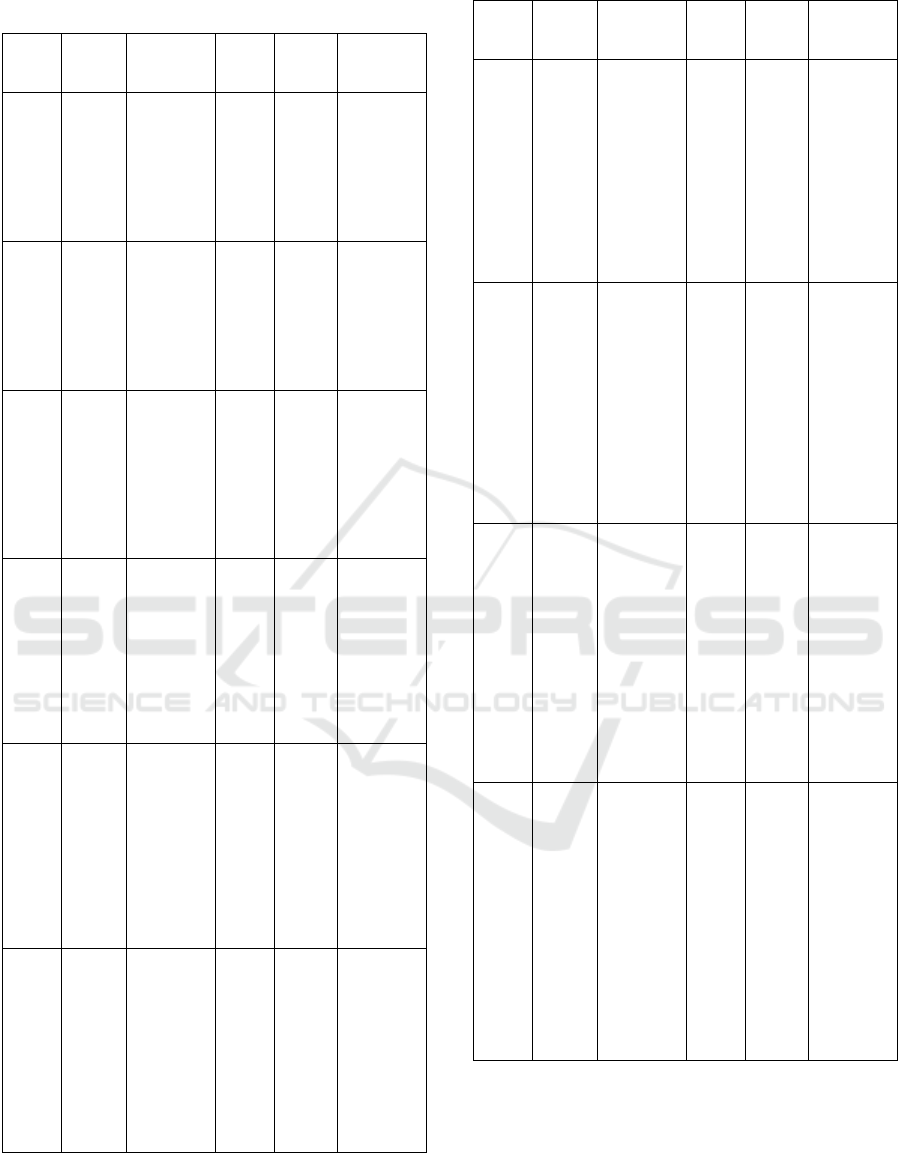
Table 1: Normal bleep test.
Level Back
and
forth
Prediction
VO2 Max
Level Back
and
forth
Prediction
VO2 Max
1
1
2
3
4
5
6
7
17,2
17.6
18,0
18,4
18,8
19,2
19,6
2
1
2
3
4
5
6
7
8
20,0
20,4
20,8
21,2
21,6
22,0
22,4
22,8
1
1
2
3
4
5
6
7
17,2
17.6
18,0
18,4
18,8
19,2
19,6
2
1
2
3
4
5
6
7
8
20,0
20,4
20,8
21,2
21,6
22,0
22,4
22,8
3
1
2
3
4
5
6
7
8
23,2
23,6
24,0
24,4
24,8
25,2
25,6
26,0
4
1
2
3
4
5
6
7
8
9
26,4
26,8
27,2
27,2
27,6
28,0
28,7
29,1
29,5
5
1
2
3
4
5
6
7
8
9
29,8
30,2
30,6
31,0
31,4
31,8
32,4
32,6
32,9
6
1
2
3
4
5
6
7
8
9
10
33,2
33,6
33,9
34,3
34,7
35,0
35,4
35,7
36,0
36,4
7
1
2
3
4
5
6
7
8
9
10
36,8
37,1
37,5
37,5
38,2
38,5
38,9
39,2
39,6
39,9
8
1
2
3
4
5
6
7
8
9
10
11
40,2
40,5
40,8
41,1
41,5
41,8
42,0
42,2
42,6
42,9
43,3
9
1
2
3
4
5
6
7
8
9
10
11
43,6
43,9
44,2
44,5
44,9
45,2
45,5
45,8
46,2
46,5
46,8
10
1
2
3
4
5
6
7
8
9
10
11
47,1
47,4
47,7
48,0
48,4
48,7
49,0
49,3
49,6
49,9
50,2
Level Back
and
forth
Prediction
VO2 Max
Level Back
and
forth
Prediction
VO2 Max
11
1
2
3
4
5
6
7
8
9
10
11
12
50,5
50,8
51,1
51,4
51,6
51,9
52,2
52,5
52,8
53,1
53,4
53,7
12
1
2
3
4
5
6
7
8
9
10
11
12
54,0
54,3
54,5
54,8
55,1
55,4
55,7
56,0
56,3
56,5
56,8
57,1
13
1
2
3
4
5
6
7
8
9
10
11
12
13
57,4
57,6
57,9
58,2
58,5
58,7
59,0
59,3
59,5
59,8
60,0
60,3
60,6
14
1
2
3
4
5
6
7
8
9
10
11
12
13
60,8
61,1
61,4
61,7
62,0
62,2
62,5
62,7
63,0
63,2
63,5
63,8
64,0
15
1
2
3
4
5
6
7
8
9
10
11
12
13
64,3
64,4
64,8
65,1
65,3
65,6
65,9
66,2
66,5
66,7
66,9
67,2
67,5
16
1
2
3
4
5
6
7
8
9
10
11
12
13
14
67,8
68,0
68,3
68,5
68,8
69,0
69,3
69,5
69,7
69,9
70,2
70,5
70,7
70,9
17
1
2
3
4
5
6
7
8
9
10
11
12
13
14
71,2
71,4
71,6
71,9
72,2
72,4
72,6
72,9
73,2
73,4
73,6
73,9
74,2
74,4
18
1
2
3
4
5
6
7
8
9
10
11
12
13
14
15
74,6
74,8
75,0
75,3
75,6
75,8
76,0
76,2
76,5
76,7
76,9
77,2
77,4
77,6
77,9
ICVHE 2019 - The International Conference of Vocational Higher Education (ICVHE) “Empowering Human Capital Towards Sustainable
4.0 Industry”
338

Level Back
and
forth
Prediction
VO2 Max
Level Back
and
forth
Prediction
VO2 Max
19
1
2
3
4
5
6
7
8
9
10
11
12
13
14
15
78,1
78,3
78,5
78,8
79,0
79,2
79,5
79,7
79,9
80,2
80,4
80,6
80,8
81,0
81,3
20
1
2
3
4
5
6
7
8
9
10
11
12
13
14
15
16
81,5
81,8
82,0
82,2
82,4
82,6
82,8
83,0
83,2
83,5
83,7
83,9
84,1
84,3
84,5
84,8
Source: (Cooper Institute for Aerobics Research, 1999)
3 METHODOLOGY
This research is a quantitative study using pre-post
preliminary examination data about the bleep test as
an examination that represents the quality of physical
activity and cardiorespiratory fitness, and survey and
analysis of descriptive data using a questionnaire as
the main instrument of data collection. The aim is to
obtain information about several respondents who are
considered to represent the millennial population.
The population of this research is 78 students of the
Vocational Education Program of UI Physiotherapy
Study Program.
4 RESULT
In this study, the examination of functional abilities
was carried out using a measuring instrument in the
form of a bleep test. A Heart Rate (HR) Pre Test is
performed first before a bleep test procedure. A
calculation of distance during and after the analysis
was carried out. After the bleep test, the post HR test
was taken (Table 1). In addition to the fitness test, the
sample also completes a questionnaire to assess how
long they use the smartphone and for what it is used.
Table 2 illustrates descriptive data from the results of
the questionnaire given to the sample.
The table above explains the descriptive data of
the research conducted. Of the 78 samples tested, it
can be seen that the distance travelled in the test
carried out the most is 960 meters (6/7 = 35.5), the
lowest distance is 220 meters (2/4 = 21.2). The lowest
HR Pre is 50 bpm, and the highest is 120 bpm, while
the lowest HR Post is at 52 bpm and the highest is 292
bpm. The questionnaire given to the sample aims to
assess how long it takes to use a smartphone in one
day, the result is the lowest duration is 70 minutes,
and the highest is at 190 minutes, with an average of
163.97 minutes.
Table 2: Average HR values, Mileage/distance, and
Duration of smartphone usage.
Variable N Min Max Avera
g
e±SD
HR Pre test
78
50 120 90.00±17.45
6
HR Post test
78
52 292 131.10±44.3
68
Mileage/distance
78
220 960 395.90±172.
480
Duration of
using smart
p
hone / da
y
78
70 190
163.97±33.2
27
Table 3: Questionnaire for smartphone use.
Question
The
answe
r
Frequency
Do you use a
smartphone to
monitor health?
No 33
Yes 45
Does using a
smartphone increase
or decrease your
p
hysical activity?
No 25
Yes 53
The table above illustrates descriptive data from
the questionnaire filled in by the samples.
Examination and questionnaire data were analysed to
obtain the correlation between the duration of using a
smartphone in one day with the distance when doing
a bleep test.
Table 4: Pearson correlation test results between duration
and distance travelled.
N Avera
g
e ± SD Si
g
nificant
(p)
Duration 78 163.97±33.227
0.000*
Distance 78 395.90±172.48
0
* Significant with a value of p <0.05
The correlation test was performed using the
Pearson correlation test. The significance number (p)
shows the value of p = 0.000 (Table 3). This result
means that the duration variable using a smartphone
and the bleep test mileage variable have a significant
correlation. The strength of the relationship between
research variables is indicated by Pearson coefficient
values contained in table 4.
Effects of Smartphone Usage on Physical and Cardiorespiratory Fitness in Millennials Cohort
339
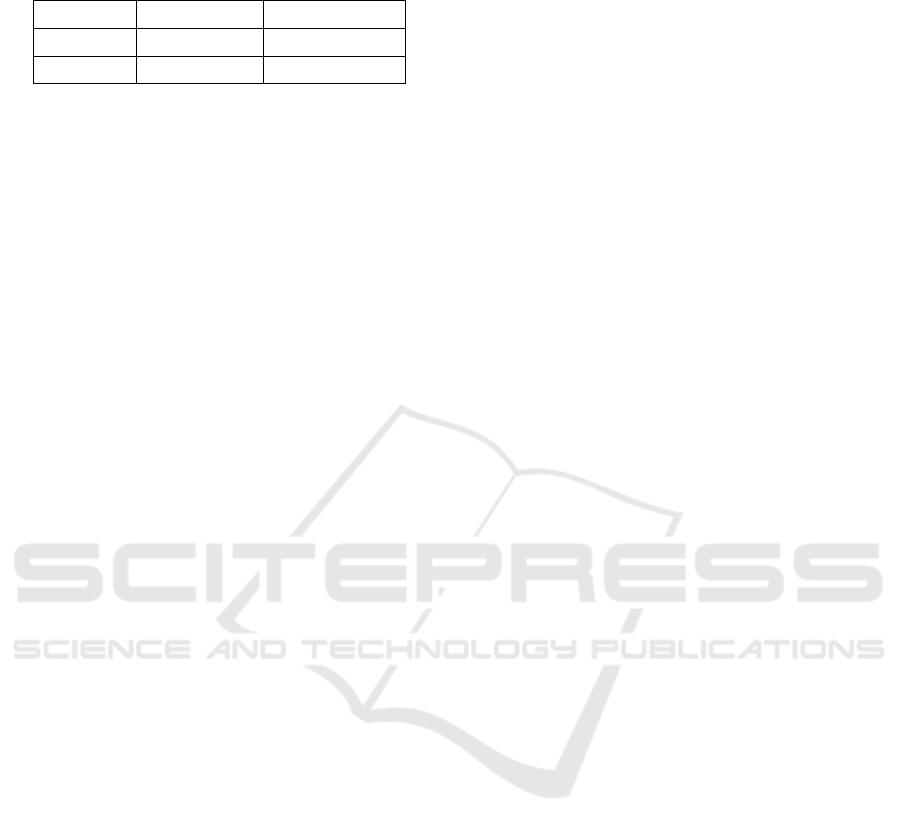
Table 5: Correlation coefficient values between duration
and distance travelled.
Duration Distance
Duration 1 -0,958*
Distance -0,958* 1
* Have a stron
g
relationshi
p
if the value close to 1
The relationship between duration and distance
variables has a correlation coefficient of -0.958. The
negative coefficient value illustrates that the two
variables have an inversely proportional relationship;
in other words, an increase in the duration of
smartphone use will result in a decrease in bleep test
mileage.
5 CONCLUSION
In conclusion, this study identified the impact of
smartphone use on cardiorespiratory physical activity
and fitness. The negative relationship between
smartphone use and physical fitness and
cardiorespiratory can be explained as follows: first,
excessive cellphone use can reduce the time to do
physical activities especially with the use of
smartphones with high frequency. Our findings
showed that high-frequency users are more likely to
be more minimal in physical activity compared to
low-frequency users (Strekalova, 2017). The users
used their cellphones for more static activities such as
Facebook, Twitter, video games, applications, and
surfing the internet. Second, the relatively high level
of smartphone usage can serve as a marker for
broader patterns of leisure behaviour that are not
dependent on cellphone use, such as watching
television, playing video games, and using computers
(Myers et al., 2002). Given that cellphones are always
present on campuses and their most common uses
such as sending text messages, updating social
networking sites, and surfing the internet are
common. The negative relationship between
cellphone use and fitness illustrated here deserves
further attention as Cardiorespiratory fitness (mirror
VO2 max) is an excellent indicator of an individual's
risk for several health problems (Carnethon et al.,
2003).
REFERENCES
Barkley, J., & Lepp, A. (2016). Mobile phone use among
college students is a sedentary leisure behavior which
may interfere with exercise. Computers In Human
Behavior, 56, 29-33.
Bianchi, A., & Phillips, J. G. (2005). Psychological
Predictors of Problem Mobile Phone Use.
Cyberpsychology & Behavior, 8(1), 39-51.
Carnethon MR, Gidding SS, Nehgme R. (2003).
Cardiorespiratory fitness in young adulthood and the
development of cardiovascular disease risk factors.
JAMA 2003, 290:3092–3100.
Cooper Institute for Aerobics Research. (1999).
Fitnessgram Test Administration Manual. Human
Kinetics, Champaign Illinois.
Fitzgerald, M., & McClelland, T. (2017). What makes a
mobile app successful in supporting health behaviour
change? Health Education Journal, 76(3), 373–381.
https://doi.org/10.1177/0017896916681179
Iyawa, G., Herselman, M., Science, A. B.-P. C. (2016).
Digital health innovation ecosystems: From systematic
literature review to conceptual framework. Elsevier.
Retrieved from
https://www.sciencedirect.com/science/article/pii/S18
77050916323171
Myers J, Prakash M, Froelicher V. (2002). Exercise
Capacity and Mortality among Men Referred for
Exercise Testing. N Engl J Med 2002, 346:793–801.
Panahi, S., Watson, J., & Partridge, H. (2016). Social media
and physicians: Exploring the benefits and challenges.
Health Informatics Journal, 22(2), 99–112.
https://doi.org/10.1177/1460458214540907
Strekalova, Y. A. (2017). Health Risk Information
Engagement and Amplification on Social Media.
Health Education & Behavior, 44(2), 332–339.
https://doi.org/10.1177/1090198116660310
ICVHE 2019 - The International Conference of Vocational Higher Education (ICVHE) “Empowering Human Capital Towards Sustainable
4.0 Industry”
340
