
The Effect of Self-Service Technology Service Quality and Customer
Satisfaction toward Loyalty and Behavioural Intentions on
E-banking Users
Hardika Widi Satria
1
and Darra Pradita Hidayat
2
1
Vocational Education Program of Universitas Indonesia, UI Campus Depok, Indonesia
2
Management Studies Program Faculty of Economics and Business, Perbanas Institute, Indonesia
Keywords: SST Service Quality, Customer Satisfaction, Customer Loyalty, Behavioural Intentions, E-banking,
Banking Industry
Abstract: Research aims: this study aims to examine the effect of self-service technology service quality and customer
satisfaction toward loyalty and behavioural intentions, particularly on e-banking users. Methodology: This
study uses a quantitative method based on a questionnaire. The research design used is hypothesis testing
that explains phenomena in the form of relationships between variables obtained based on data and facts.
This study is used to test hypotheses regarding the effect of SST Service Quality on Loyalty, Customer
Satisfaction and Behavioural Intentions, and the impact of Customer Satisfaction on Loyalty and
Behavioural Intentions. Practical Implications: This study gives an outlook of an effect between the
variable’s relationships toward the e-banking customer. It provides several suggestion and recommendations
for the industry of banking in Indonesia to maintain sustainable business toward industrial 4.0 era, which
rely heavily on the internet. This study can be an insightful lesson-learned that can be used to create another
better virtual banking experience services in Indonesia. Theoretical Implications: This study expands the
existing literature on self-service technology service quality, customer satisfaction, loyalty and behavioural
intentions by providing a theoretical support of e-banking services in the age of industrial revolution 4.0. It
illustrates how the theoretical approach could help the banking industry creating better service that tailored
to the customer needs and provide satisfaction to the customer.
1 INTRODUCTION
The Indonesian banking industry in the digital era
has experienced significant developments which can
lead to intense inter-bank competition. Therefore
each bank is expected to attract attention and interest
of the customer in various ways because the factors
that are used as a customer assessment in choosing a
bank is the reputation of the bank, friendliness of
staff, a reasonably close and convenient location,
Automatic Teller Machine (ATM) in an easily
accessible location and availability of parking space
(Aslam et al., 2011). A bank must be able to make
innovations from other banks to face intense
competition, where innovations made can be
adjusted to the expectations of customers so that
behavioural intentions and customers become loyal
(Loanata et al., 2015).
The banking industry will not succeed without
the existence of behavioural intentions and customer
loyalty. Therefore, with the development of
increasingly creative technological service
innovations, customers are expected to remain loyal
and even buy any service products provided by
banks (Azisyah, 2016). Lovelock (2012) states that
the service sector is an industry that must quickly
innovate; otherwise, it will sink in the banking
industry competition. The success of a bank to
maintain customers remain loyal is strongly
influenced by several marketing strategies such as
product innovation, the provision of cutting-edge
technology, the ease of the product and provide fast
self-service via e-banking (Azisyah, 2016). Various
facilities and strategies that are continually being
developed, especially self-service banking
technology, are expected to make customers have
behavioural intentions for a particular bank
(Azisyah, 2016).
304
Widi Satria, H. and Pradita Hidayat, D.
The Effect of Self-service Technology Service Quality and Customer Satisfaction toward Loyalty and Behavioural Intentions on E-banking Users.
DOI: 10.5220/0010675400002967
In Proceedings of the 4th International Conference of Vocational Higher Education (ICVHE 2019) - Empowering Human Capital Towards Sustainable 4.0 Industry, pages 304-318
ISBN: 978-989-758-530-2; ISSN: 2184-9870
Copyright
c
2021 by SCITEPRESS – Science and Technology Publications, Lda. All rights reser ved

This paper has formulated research problems in
detail to examine the effect of self-service
technology service quality on loyalty, behavioural
intentions, and customer satisfaction. Further, it will
also cover the effect of customer satisfaction on
loyalty and behavioural intentions.
The objective research of this paper is to find out
and analyse the effect of self-service technology
service quality on loyalty, behavioural intentions and
customer satisfaction. It will also expand to find out
and analyse the effect of customer satisfaction on
loyalty and behavioural intentions., the research will
be conducted in several limitations such as four
variables to make it clear and specific. The variables
are self-service technology service quality that
focuses on the outline, customer satisfaction, loyalty
and behavioural intentions. Research sampling is the
banking industry in general
2 LITERATURE REVIEW
2.1 Self Service Technology Service
Quality
Self-service technology is a technology intermediary
that occurs to customers, where customers do their
own services without assistance or dependence on
company employees (Rambat, 2013). Meuter (2000)
explained that self-service technology is a
technology that is made to make it easier for
customers to transact independently. Further, Hsiech
(2005) explains the factors that drive self-service
technology are product quality, services offered,
product costs, presentations and services, self-
service technology design, how companies manage
and prevent the failure of self-service technology
and the company’s ability to create self-innovation
service technology. According to Kasmir (2012) the
reason companies must use self-service technology
includes: (a) many services are carried out through
technology; (b) many companies have used self-
service technology; (c) can provide convenience and
comfort for customers.
2.2 Customer Satisfaction
Customer Satisfaction is a state of one’s feelings that
are obtained from the results of a comparison
between the assessment of final product
performance in relation to customer expectations
(Kotler & Keller, 2016). Tjiptono (2014) explains
that a customer will feel satisfaction or discomfort of
the response given to the evaluation that can be felt
between expectations and performance felt after use.
The purpose of measuring customer satisfaction is:
(a) to identify the needs of customers who are
considered necessary by the customer so that they
can influence whether satisfied or not; (b) to
determine the level of customer satisfaction on
company performance; (c) to compare customer
satisfaction with companies with customer
satisfaction with other companies; (d) to identify
priorities for improvement through analysing the
level of essential needs with satisfaction; (e) to
measure the customer satisfaction index which can
be used as an indicator that can be monitored the
progress of development from time to time.
According to Irawan (2009), some factors
influence customer satisfaction. Firstly, product
quality, customers will feel satisfied if the results of
the product quality assessment are to meet the
customers demand, adding value to customers’
satisfaction. Secondly, service quality, customers are
satisfied if the expected service is obtained, leading
to a good perception of the product or service.
Thirdly, emotional, satisfaction is obtained from
satisfying social values. Fourthly, price, products
with the relatively same quality and low price
provide more value for consumers. The more
expensive a product or service is, the higher
expectations expected by customers; (e) ease:
customers will be more satisfied if the products and
services obtained provide convenience and comfort.
2.3 Loyalty
Creating customer loyalty is needed to maintain the
success of a business because it can create
innovation in sales (Musfar and Vivi, 2012). Ishaq
(2014) mentions that loyalty is a process of customer
satisfaction which in the end will have an impact to
intentions. Customer loyalty is a commitment
obtained from customers experience buy or use a
product and service consistently by making repeated
purchases on the same brand even though the
customer gets influence from other competitors
(Oliver, 2015).
Olivier (2015) describes four stages regarding
loyalty, namely; (a) cognitive loyalty: the initial
stage where more emphasis on customer confidence
in a brand and is usually based on recent experience
so that this stage can also be called the lowest stage;
(b) affective loyalty: the second stage which is
assessed based on the accumulation of customers in
the use of the company’s products and at this stage
the customer is quite easy to move to another brand
or try products from other companies; (c) conative
The Effect of Self-service Technology Service Quality and Customer Satisfaction toward Loyalty and Behavioural Intentions on E-banking
Users
305
loyalty: a stage of loyalty where the customer is
committed to buying back the product and at this
stage is usually influenced by positive experiences
that are repeatedly felt by the customer and usually
at this stage the customer is more committed to the
company; (d) action loyalty: the final stage of
loyalty and at this stage is more about performance
factors such as how a brand can be liked by
customers so that the customer has the intention and
act to buyback.
2.4 Behavioural Intentions
Behavioural intentions are a desire of the customer
to behave as having, using or disposing of the
product purchased so that the customer decides to
find out information or notify others of the
experience (Mowen, 2012). Schiffman and Kanuk
(2010) explain that behavioural intentions are an
indicator to assess whether customers will remain
loyal or will move to products and services from
other companies.
Zhillin et al. (2009) mention three dimensions of
behavioural intentions namely; (a) recommendation:
behavioural intentions at the recommendation stage
are more about encouraging surrounding relatives to
use goods or services from the company, in other
words, the customer has carried out indirectly
marketing activities and brought other customers to
the company; (b) repurchase intention: behavioural
intentions on this dimension are by using products
twice, or more on the same products and services;
(c) pay more: behavioural intentions that will occur
are a result of customer satisfaction on a product so
that even if there is a price change, the customer
willing to pay more for it.
2.5 Hypothesis
H1: There is a positive influence between Self
Service Technology Service Quality on Loyalty.
Self-service technology can affect loyalty if
companies can improve service quality by creating
new and exciting things to create loyalty (Iqbal,
2017). Other research explains that with the self-
service technology innovation that is profitable for
customers, it will create loyal customers (Azisyah,
2016).
H2: There is a positive influence between Self
Service Technology Service Quality on Customer
Satisfaction.
Iqbal (2017) carried out a test to see whether
self-service quality influences customer satisfaction
and the results obtained is that it has a significant
impact because by increasing the convenience of
using self-service technology the customer will be
created satisfaction. Customer satisfaction comes
from customer expectations, by providing services
that meet customer expectations it will improve
customer satisfaction (Azisyah, 2016).
H3: There is a positive effect between Self Service
Quality on Behavioural Intentions.
Iqbal (2017) states that self-service quality has a
significant impact on behavioural intentions because
behavioural intentions can be created if the company
can provide quality self-service. While other studies
also explain the same thing where quality self-
service quality can create behavioural intentions
(Winata, 2015).
H4: There is a positive influence between Customer
Satisfaction on Loyalty.
Customer satisfaction is one of the essential
factors of loyalty because it will make the customer
loyal (Iqbal, 2017). Winata (2015) stated that
customer satisfaction has a significant influence on
loyalty, by increasing customer satisfaction, loyalty
will also increase.
H5: There is a positive influence between Customer
Satisfaction on Behavioural Intentions.
Loanata et al. (2015) explain that customer
satisfaction has a significant and significant effect on
behavioural intentions because it can encourage or
influence behavioural intentions themselves, the
higher customer satisfaction, the higher behavioural
intentions will be created. Other research also
confirms that customer satisfaction influences
behavioural intentions (Winata, 2015).
Figure 1: Conceptual Framework
ICVHE 2019 - The International Conference of Vocational Higher Education (ICVHE) “Empowering Human Capital Towards Sustainable
4.0 Industry”
306

3 METHODOLOGY
3.1 Research Approach and Design
This study refers to Iqbal et al. (2017). The research
design used is hypothesis testing, where this study
aims to test hypotheses and generally is a study that
explains phenomena in the form of relationships
between variables obtained based on data and facts.
This study is used to test hypotheses regarding the
effect of SST Service Quality on Loyalty, Customer
Satisfaction and Behavioural Intentions, and the
impact of Customer Satisfaction on Loyalty and
Behavioural Intentions. The unit of analysis used in
this study is that individuals who use e-banking will
be asked directly through a questionnaire.
3.2 Variables and Measurements
There are four variables to be measured in this
study, namely SST Service Quality, Customer
Satisfaction, Loyalty, and Behavioural Intentions.
SST Service Quality variables are measured using
several dimensions, including Functionality,
Enjoyment, Security, Design, Assurance,
Convenience and Customization. Functionality
dimensions are measured using five statement items.
Enjoyment dimensions are measured using four
statement items. The Security Dimension is
measured using two statement items. Design
dimensions are measured using two statement items.
The Assurance Dimension is measured using two
statement items. Convenience dimensions are
measured using three statement items.
Customisation dimensions are measured using three
statement items. Customer Satisfaction variable is
measured by using three statement items. Loyalty
variables are measured using five statement items.
Behavioural Intentions variable is measured by
using three statement items.
The items used were adapted from the research
developed by Lien and Hsieh (2011) to measure the
dimensions of the SST Service Quality variable. It
was adapted from the research of Fornell et al.,
(1996) to measure the Customer Satisfaction
variable. Items used were adapted from research
developed by Cronin (2000) to measure Loyalty and
Behavioural Intentions variables. Each item of the
variable measured uses a five-point Likert scale,
where “1” means “Strongly Disagree”, up to “5”
which means “Strongly Agree”.
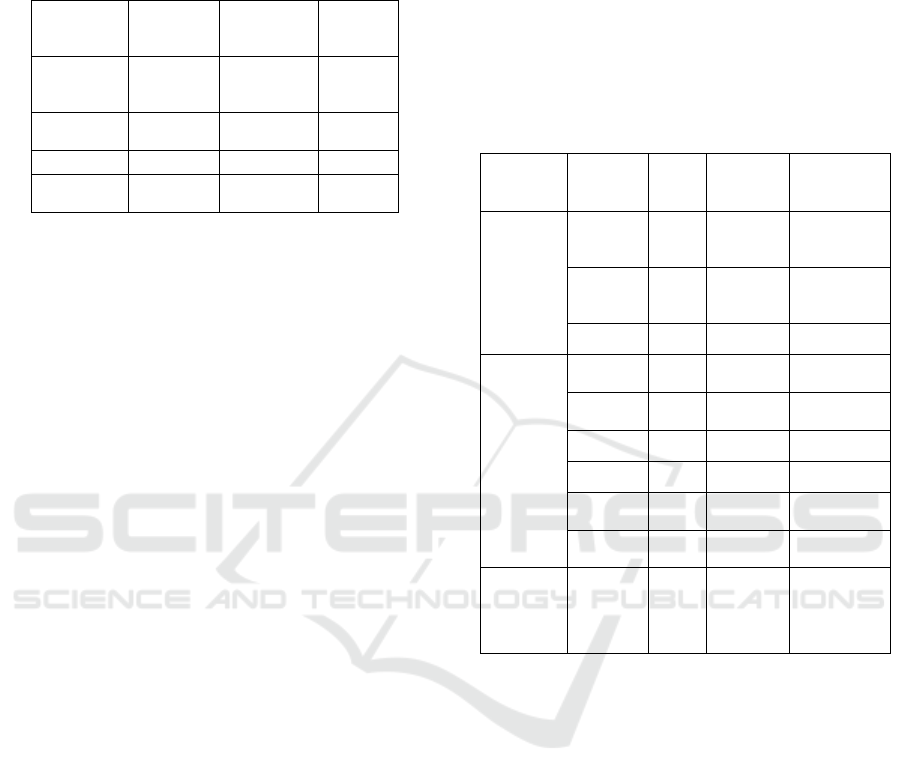
Table 1: Matrix Variables and Measurements
Variable Items Source
SST Service
Quality
Functionality:
1. I can do
financial needs
transactions
with a short
period through
e-banking SST.
2. The service
process of e-
banking SST is
transparent.
3. Using SST e-
banking
requires a little
effort.
4. I can do
financial
services
smoothly
through e-
banking SST.
5. Every service
function from
e-banking SST
is excellent
(free of errors).
Enjoyment:
1. Attractive e-
banking SST
operations.
2. I feel I can use
SST e-banking
well.
3. SST e-banking
has an
interesting
additional
function.
4. SST e-banking
provides all
information
that is relevant
to me.
Security:
1. I feel safe in
financial
transactions
through e-
banking SST.
2. The privacy
policy is clearly
stated when I
use e-banking
SST.
Design:
1. The layout of
the SST e-
banking is
aesthetically
attractive.
2. The bank
seems to use
Lehtinen,
1991; Lien
and Hsieh,
2011
The Effect of Self-service Technology Service Quality and Customer Satisfaction toward Loyalty and Behavioural Intentions on E-banking
Users
307
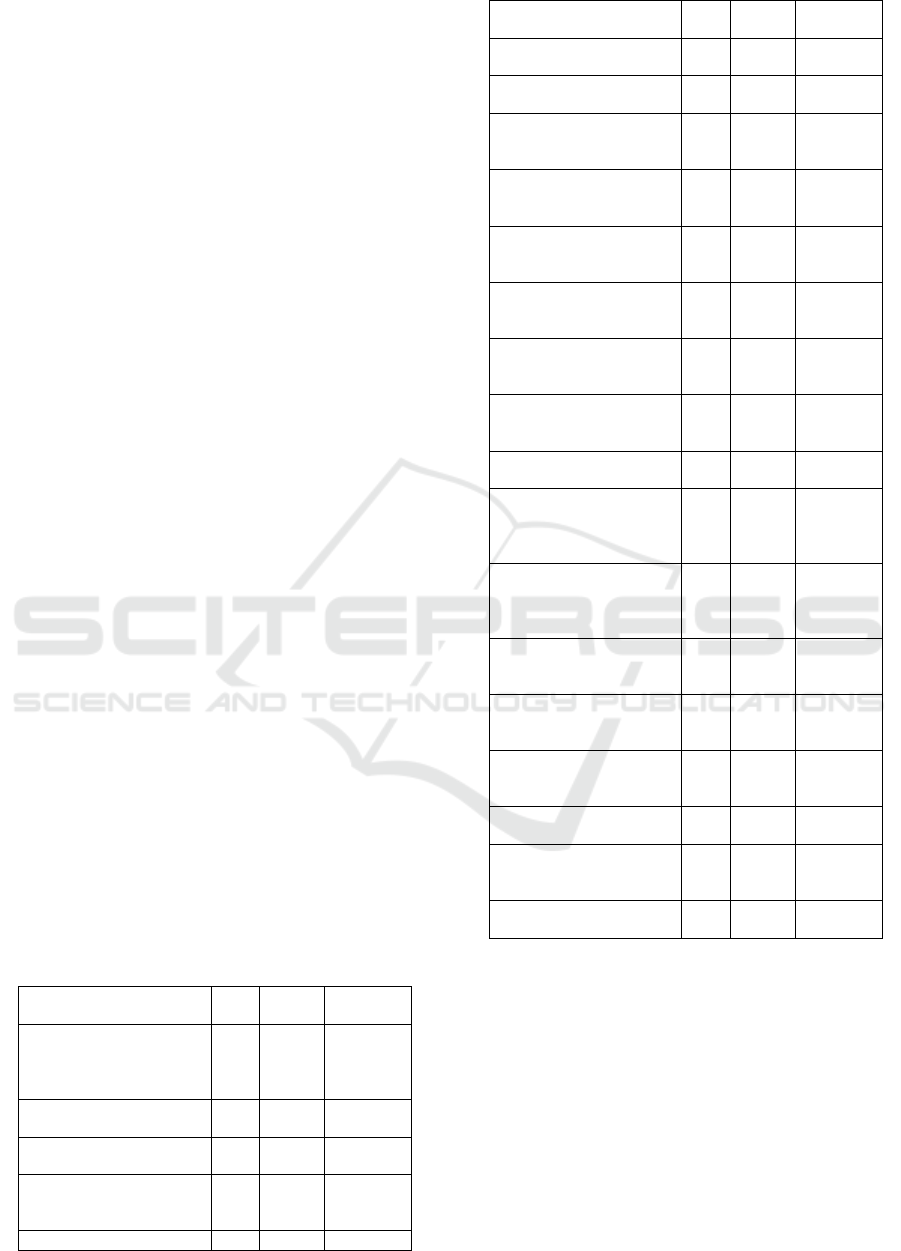
Variable Items Source
the latest
technology for
e-banking SST
Assurance:
1. Bank X is a
well-known
SST e-banking
provider.
2. Bank X is a
company that
has an excellent
reputation for
e-banking SST
service
providers.
Convenience:
1. Operation of
SST e-banking
services from
Bank X is
convenient for
customers.
2. Bank X’s SST
e-banking is
not easily
erroneous when
used.
3. It is effortless
and convenient
to use Bank X
SST e-banking.
Customisation:
1. SST e-banking
Bank X
understands my
specific needs.
2. Bank X’s SST
e-banking
really attracted
me.
3. SST e-banking
Bank X has
features that
can be tailored
to my needs.
Customer
Satisfaction
1. 2. I am satisfied
with the
technology
services offered
by Bank X.
3. The self-
service
technology
offered by
Bank X
exceeded my
expectations.
4. The self-
service
technology
offered by
Bank X is very
close to my
idea.
Kotler,
2016
Variable Items Source
Loyalty 1. 2. I will continue
to use SST e-
banking
services from
Bank X.
3. I will
recommend
SST e-banking
Bank X to my
friends.
4. If I need
independent
financial
services, then I
will use SST e-
banking from
Bank X.
5. I will comment
positively
about SST e-
banking from
Bank X to
others.
6. SST e-banking
from Bank X is
my first choice.
Griffin,
2013
Behavioural
Intentions
1. 2. My chances of
using
independent
technology
from Bank X
will be high.
3. The possibility
of me to
recommend
SST e-banking
from Bank X to
friends will be
high.
4. If I must
choose in the
use of e-
banking SST,
then I will
choose SST e-
banking from
Bank X.
Schiffman
and
Kanuk,
2012
3.3 Research Population
The sampling method in this study is non-probability
sampling which is a technique that does not provide
equal opportunities and opportunities for each
element or member of the population to be sampled.
The sampling technique using purposive sampling
technique is a technique for determining samples
with specific considerations, where consideration is
based on certain characteristics that are considered
to have a close relationship with the characteristics
of a population that has been previously known
ICVHE 2019 - The International Conference of Vocational Higher Education (ICVHE) “Empowering Human Capital Towards Sustainable
4.0 Industry”
308
(Sekaran, 2012). In other words, the sample units
contacted are adjusted to specific criteria applied
based on the research objectives. The characteristics
of respondents needed in this study are customers
who use e-banking at least three times a month in
one year.
The data used in this study is primary data,
namely, data collected directly by researchers who
are given directly to the selected sample to answer
the problem or purpose of the study. In this study
carried out through distributing questionnaires to
160 respondents (Sekaran, 2012). After being
collected, 160 respondents who were valid to be
processed were explained as follows:
Table 2: Respondent Gender
Gender Total Respondent Percentage (%)
Male 89 55,6
Female 71 44,4
Total 160 100
Table 3: Respondent Age
Age Total Respondent Percentage (%)
< 20 years old 13 8,1
21 – 25 years old 36 22,5
25 – 30 years old 50 31,3
30 – 35 years old 38 23,8
> 35 years old 23 14,4
Total 160 100
Table 4: Respondent Education Background
Educational Background Total Respondent Percentage (%)
Senior High School 24 15
Vocational Higher Education 28 17,5
Bachelor Degree 90 56,3
Post Graduate Degree 18 11,3
Total 160 100
Table 5: Respondent Profession Background
Profession Total Respondent
Percentage
(%)
Student 24 15
Private Employees 96 60
Civil Servant 21 13,1
State-owned
Enterprises
Employees
10 8
Entrepreneur 9 5,6
Total 160 100
Table 6: Respondent Monthly Income Background
Monthly Income Total Respondent Percentage (%)
< Rp 3.000.000 23 14,4
Rp 3.000.000 – Rp
4.999.000
33 20,6
Rp 5.000.000 – Rp
6.999.000
49 30,6
Rp 7.000.000 – Rp
8.999.000
29 18,1
> Rp 9.000.000 26 16,3
Total 160 100
Table 7: Respondent Monthly E-banking Use Background
Monthly
E-banking Use
Total Respondent Percentage (%)
3 – 4 times 102 63,8
5 – 7 times 35 21,9
8 – 10 times 14 8,8
> 10 times 29 18,1
Total 160 100
3.4 Validity Test
Validity test is a test in the valid or valid measure of
a questionnaire. A questionnaire is valid only if the
question in the questionnaire can reveal something
that will be measured by the questionnaire (Ghozali,
2013). The analytical tool for testing the validity of
this study is factor analysis using the Kaiser-Meyer-
Olkin (KMO) value approach. Fundamental testing
decision making on the validity of factor analysis,
namely:
If the value of ¬KMO> α (0.05) à, then
the item statement is valid.
If the value of ¬KMO <α (0.05) à, then
the item statement is invalid.
The results of testing the validity of the SST
Service Quality variables performed are as follows:
Table 8: Validity Test Results for Construct Quality
Services for SST
No. Statement item KMO Decision
1.
I can do financial needs transactions
with a short period through e-banking
SST.
0,778 Valid
2. The service process of e-banking is
transparent.
0,850 Valid
3. Using SST e-banking requires a little
effort.
0,886 Valid
4. I can do financial services smoothly
through e-banking SST.
0,910 Valid
5.
Each service function of the SST-
banking SST is excellent (free of
errors
)
.
0,817 Valid
6. Attractive e-banking SST operations.
0,854 Valid
7. I feel I can use SST e-banking well.
0,781 Valid
8. SST e-banking has interesting
0,731 Valid
The Effect of Self-service Technology Service Quality and Customer Satisfaction toward Loyalty and Behavioural Intentions on E-banking
Users
309
additional functions.
9. E-banking SST provides all
information that is relevant to me.
0,929 Valid
10. I feel safe in financial transactions
throu
g
h e-
b
ankin
g
SST.
0,904 Valid
11. The privacy policy is clearly stated
when I use e-
b
ankin
g
SST.
0,904 Valid
12. The layout of the SST e-banking is
esthetically attractive.
0,912 Valid
13. Bank X seems to use the latest
technolo
gy
for e-
b
ankin
g
SST.
0,879 Valid
14. Bank X is a well-known SST e-
b
ankin
g
p
rovider.
0,732 Valid
15. Bank X is a company that has an
excellent reputation for e-banking
SST service
p
roviders.
0,533 Valid
16. Operation of SST e-banking services
from Bank X is convenient for
customers.
0,926 Valid
17. Bank X SST e-banking is not easily
erro
r
ed when used.
0,834 Valid
18. It is effortless and convenient to use
Bank X e-
b
ankin
g
SST.
0,844 Valid
19. Bank X e-banking SST understands
m
y
s
p
ecific needs.
0,786 Valid
20. Bank X banking system attracts me.
0,860 Valid
21. Bank X e-banking SST has features
that can be tailored to m
y
needs.
0,836 Valid
From the table above, each KMO value on the
statement item SST Service Quality variable has a
value of more than 0.5, which means that each item
statement is valid. This value means that all
statement items are suitable for measuring SST
Service Quality variables.
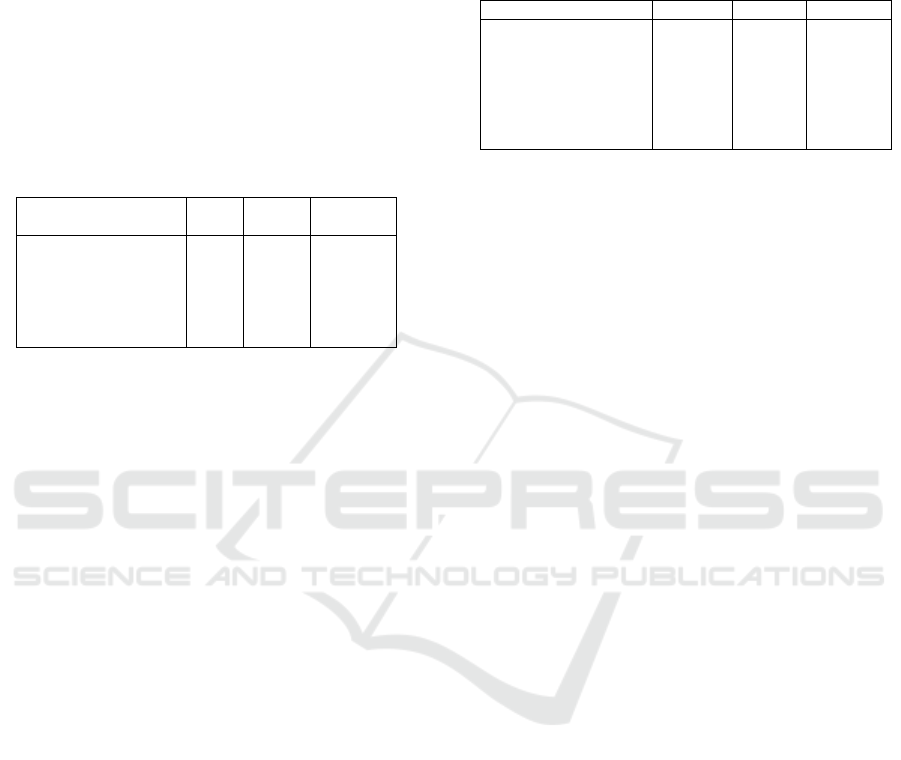
Table 9: Validity Test Results for Customer Satisfaction
Constructions
No. Statement item KMO Decision
1.
I am satisfied with the
independent technology
services offered by Bank X.
0,681 Valid
2.
The self-service technology
offered by Bank X exceeded
my expectations.
0,697 Valid
3.
The self-service technology
offered by Bank X is very
close to my idea.
0,667 Valid
From the table above, each KMO value on the
variable item statement of Customer Satisfaction has
a value of more than 0.5, which means that each
item statement is valid. This value means that all
statement items are suitable for measuring Customer
Satisfaction variables
Table 10: Validity Test Results for Loyalty Constructions
No. Statement item KMO Decision
1.
I will continue to use SST e-
banking services from Bank
X
0,822 Valid
2.
I will recommend Bank X e-
b
anking SST to my friends.
0,763 Valid
3.
If I need independent
financial services, then I will
0,716 Valid
use SST e-banking from
Bank X
4.
I will comment positively
about SST e-banking from
Bank X to others.
0,667 Valid
5.
SST e-banking from Bank X
is my first choice.
0,736 Valid
From the table above, each KMO value on the
item statement Loyalty variable has a value of more
than 0.5, which means that each item statement is
valid. This value means that all statement items are
appropriate for measuring Loyalty variables
Table 11: Validity Test Results for Constructs of
Behavioural Intentions
No. Statement item KMO Decision
1.
I will continue to use SST e-
banking services from Bank
X
0,822 Valid
2.
I will recommend Bank X e-
b
anking SST to my friends.
0,763 Valid
3.
If I need independent
financial services, then I will
use SST e-banking from
Bank X
0,716 Valid
4.
I will comment positively
about SST e-banking from
Bank X
0,667 Valid
5.
SST e-banking from Bank X
is my first choice.
0,736 Valid
From the table above, each KMO value in the
item statement of Behavioural Intentions variable
has a value of more than 0.5, which means that each
item statement is valid. This value means that all
statement items are appropriate for measuring
Behavioural Intentions variables.
3.5 Reliability Test
Reliability test is a test to measure a questionnaire
which is an indicator of a construct. A questionnaire
is said to be reliable if someone’s answer to the
statement is consistent or stable over time (Ghozali,
2013). The reliability test of each construct can be
seen from the value of Cronbach’s Alpha, as the
coefficient of the reliability test. An indicator is
considered reliable if it has Cronbach’s Alpha of 0.6
or more (Hair, 2013). Fundamental decision-making
reliability is as follows:
If the Cronbach’s Alpha value is 60
(0.60), then the statement in the
questionnaire is appropriate to use.
If the Cronbach’s Alpha value is <0.60,
the statement in the questionnaire is not
suitable to use.
ICVHE 2019 - The International Conference of Vocational Higher Education (ICVHE) “Empowering Human Capital Towards Sustainable
4.0 Industry”
310
The reliability test results for each construct are
shown in the following table:
Table 12: Reliability Test Results
Construct
Number
of Items
Statement
Cronbach’s
Coefficient
Alpha
Decision
SST
Service
Quality
21 0,881 Reliable
Customer
Satisfaction
3 0,722 Reliable
Loyalty 5 0,750 Reliable
Behavioral
I
ntentions
3 0,704 Reliable
Based on the table above, Cronbach’s
Coefficient Alpha in the construct used in the study
has met the criteria of reliability. Thus, if all
constructs in the study have a Cronbach’s
Coefficient Alpha of at least 0.60 or more, then the
respondent’s answer to the statements used to
measure each construct is consistent, and the
construct is reliable.
3.6 Data Analysis Method
The analytical method used in this study is the
Structural Equation Model (SEM). Structural
Equation Model (SEM) is a statistical tool used to
complete multilevel models simultaneously which
cannot be solved by linear regression equations.
SEM can also be considered as a combination of
regression analysis and factor analysis (Ghozali,
2013). In SEM analysis techniques, the program can
use the AMOS program version 24.
Before analysing the hypothesis proposed, the
model conformity test is first carried out. Model
suitability testing is done by looking at the
measurement criteria, namely (Hair, 2013):
1. Absolute Fit Measure used to measure the
overall fit model. The criteria are to look
at the Chi-square value, Significant
Probability and Root Mean Square Error
of Approximation (RMSEA).
2. Incremental Fit Measure is a measure
used to compare models proposed with
other models specified by researchers.
The criteria are by looking at the
Goodness-of-fit Index (GFI), Normed Fit
Index (NFI), Turker-Lewis Index (TLI),
Relative Fit Index (RFI), Comparative Fit
Index (CFI), and Incremental Fit Index
(IFI).
3. Parsimonious Fit Measure is an
adjustment to the measurement of fit to be
compared between models with a
different number of coefficients. The
criteria are to see the value of Normed
Chi-square (CMIN).
The results of the Goodness of Fit Model
measurement results are shown in the table below:
Table 13: Goodness of Fit Model
Type of
measure
ment
Measur
ement
Valu
e
Expecte
d value
Conclusion
Absolute
Fit
Measures
Chi-
Square
313,2
91
Expected
to be
small
Poor fit
Sig.
Probabil
ity
0,000
≥ 0,05 Poor Fit
RMSEA 0,148
≤ 0,10 Poor Fit
Incremen
tal Fit
Measures
GFI 0,852
≥ 0,90
Marginal
F
i
t
NFI 0,853 ≥ 0,90
Marginal
F
i
t
TLI 0,742 ≥ 0,90 Poor Fit
RFI 0,761 ≥ 0,90 Poor Fit
CFI 0,921 ≥ 0,90
Goodness of
F
i
t
IFI 0,932 ≥ 0,90
Goodness of
F
i
t
Parsimon
ious Fit
Measure
Normed
Chi-
Square
3,601
Lower
limit 1,
upper
limit 5
Goodness of
Fit
The test results of model suitability (goodness of
fit) show the Chi-Square value of 313,291. It can be
concluded that the value of Chi-Square is a poor fit.
Significance Probability of 0,000 so that it can be
concluded that poor fit. The RMSEA value is 0.148,
which means that poor fit is due to the expected cut-
off limit of ≤ 0.10. The testing of the goodness of fit
for an incremental fit measure is done by looking at
the values of GFI, NFI, TLI, RFI, CFI and IFI with
cut-off values that have the criteria ≥ 0.90. The value
obtained from processing SEM data on GFI and NFI
is 0.852 and 0.853, which means marginal fit
because the cut off value approaches the criteria
value. For TLI and CFI, it is 0.742 and 0.761, which
means that the weak fit data. The value of CFI and
IFI has a value of 0.921 and 0.932. It means the
goodness of fit because the value exceeds the cut-
off.
The Normed Chi-Square value of the criteria is
the lower limit of 1 or the upper limit of 5, and the
The Effect of Self-service Technology Service Quality and Customer Satisfaction toward Loyalty and Behavioural Intentions on E-banking
Users
311
indicator value is 3.601, so it can be concluded that
the model is the goodness of fit. That is, with
various approaches used to produce conclusions the
model produced in the goodness of fit. From the
measurements for the model of suitability (goodness
of fit), it can be concluded that the testing model is
feasible because some items achieve marginal fit
criteria and even meet the criteria of goodness of fit.
Therefore, further hypothesis testing can be
continued.
4 RESULT AND DISCUSSION
4.1 Descriptive Statistics
In this study, the first analysis carried out was the
descriptive statistical analysis. Descriptive statistics
aim to provide a description or description of data in
terms of minimum values, maximum values, mean
values and standard deviation (Hair, 2013). In the
descriptive analysis of the data described as follows,
the mean value is the average value of all
respondents to the variables under study, while the
standard deviation that shows the variation of
respondents’ answers. There is no limit on the
standard deviation value, but the standard value of
deviation that keeps away from zeros indicates that
the spread of data (respondent’s answer) is varied,
whereas if the standard deviation value is given
close to zero, then the respondent’s answers do not
vary. The minimum value is the lowest answer
(scale) chosen by the respondent, and the maximum
value is the highest answer (scale) chosen by the
respondent. In this study, the descriptive statistics
used are the mean and standard deviation. The
results of the descriptive statistics calculation of the
independent and bound variables are seen in the
table below:
Table 14: Descriptive Statistics Variable SST Service
Quality
Statement Item N Mean
Standard
Deviation
I can do financial needs
transactions with a short
period through e-banking
SST.
160 3,700 0,690
The service process of e-
b
anking is transparen
t
.
160 3,350 0,841
Using SST e-banking
requires a little effort.
160 3,513 0,824
I can do financial services
smoothly through e-
b
anking SST.
160 3,269 0,895
Every service function of 160 3,706 0,813
SST-banking is excellent
(erro
r
-free).
Attractive e-banking SST
operations.
160 3,619 0,776
I feel that I can use SST e-
b
anking well.
160 4,306 0,604
SST e-banking has
additional attractive
functions.
160 4,281 0,646
E-banking SST provides
all information that is
relevant to me.
160 3,531 0,854
I feel safe in financial
transactions through e-
b
anking SST.
160 3,313 0,877
The privacy policy is
clearly stated when I use
e-
b
anking SST.
160 3,456 0,882
The layout of the SST e-
banking is esthetically
attractive.
160 3,306 0,869
Bank X seems to use the
latest technology for e-
b
anking SST.
160 4,038 0,751
Bank X is a well-known
SST e-
b
anking provider.
160 4,088 0,730
Bank X is a company that
has an excellent reputation
for e-banking SST service
providers.
160 3,338 1,312
Operation of SST e-
banking services from
Bank X is convenient for
customers.
160 3,481 0,883
Bank X’s SST e-banking
is not easily erroneous
when used.
160 3,806 0,781
It’s easy and convenient
to use Bank X’s SST e-
b
anking.
160 3,631 0,829
Bank X’s SST e-banking
understands my specific
needs.
160 3,331 0,923
Bank X’s SST banking
attracted me.
160 2,969 0,914
Bank X’s SST e-banking
has features that can be
tailored to my needs.
160 2,881 0,980
Total Average SST
Service Quality
160 3,567 0,464
The magnitude of the mean or average value and
standard deviation is for the SST Service Quality
variable. Service Quality variable shows an average
of 3.567. Based on the average value, it can be
interpreted that the respondent can conduct financial
needs transactions with a short period through e-
banking SST and free from errors. In addition, the
use of SST e-banking is easy to use and has a variety
of new services. Bank X is a company that is well-
known and has a good reputation chosen by
customers because it has the latest technology for
the improvement of maximum service quality. The
ICVHE 2019 - The International Conference of Vocational Higher Education (ICVHE) “Empowering Human Capital Towards Sustainable
4.0 Industry”
312
standard deviation value of 0.464 shows the spread
of varied data.
Table 15: Descriptive Statistics of Customer Satisfaction
Variables
Statement Item N Mean
Standard
Deviation
I am satisfied with the
standalone technology
services offered by
Bank X as a whole.
160 3,194 1,073
The self-service
technology offered by
Bank X exceeded my
expectations.
160 3,663 0,958
The self-service
technology offered by
Bank X is very close
to my idea.
160 3,369 0,956
Total Average
Customer
Satisfaction
150 3,408 0,799
The magnitude of the mean or average value and
standard deviation is for the Customer Satisfaction
variable measured in this study. The Customer
Satisfaction variable shows an average of 3.408.
Based on the average value, it can be interpreted that
overall the customer is entirely satisfied with the
new technology offered by Bank X, in line with
expectations and the self-service technology offered
in accordance with the ideas and thoughts of the
customers as customers. The standard deviation
value of 0.799 shows the spread of varied data.
Table 16: Descriptive Statistics of Loyalty Variables
Statement Item N Mean
Standard
Deviation
I will continue to use
SST e-banking services
from Bank X.
160 3,481 0,883
I will recommend SST
e-banking Bank X to
my friends.
160 3,806 0,781
If I need independent
financial services, then
I will use SST e-
b
anking from Bank X.
160 3,631 0,829
I will comment
positively about SST e-
banking from Bank X
to others.
160 3,331 0,923
SST e-banking from
Bank X is my first
choice.
160 2,969 0,914
Total Average
Loyalty
160 3,444 0,614
The magnitude of the mean or average value and
standard deviation is for the Loyalty variables
measured in this study. Loyalty variables show an
average of 3.444. Based on the average value, it can
be interpreted that respondents will recommend the
use of e-banking-based independent financial
services to friends, customers will also continue to
use e-banking in the future because it makes it very
easy for customers to transact wherever and
whenever. So, e-banking services have become the
primary choice for them. The standard deviation
value of 0.614 shows the spread of varied data.
Table 17: Descriptive Statistics Behavioral Intentions
Variables
Statement Item N Mean
Standard
Deviation
My chances of using
technology
independently from Bank
X will be high.
160 2,881 0,980
My chances of
recommending SST e-
banking from Bank X to
my friends will be high.
160 3,194 1,073
If I have to choose in
using SST e-banking,
then I will choose SST e-
b
anking from Bank X.
160 3,663 0,958
Total Average
Behavioral Intentions
160 3,246 0,796
The magnitude of the mean or average value, and
the standard deviation is for the Behavioural
Intentions variable measured in this study. The
Behavioural Intentions variable shows an average of
3.246. Based on the average value, it can be
interpreted that the possibility to continue using e-
banking remains high, besides that it is possible to
invite friends to use e-banking and confidence in
choosing e-banking, namely by choosing the best
Bank X as e-banking. The standard deviation value
of 0.796 shows the spread of varied data.
4.2 Hypothesis Testing
After testing the suitability of the model, hypothesis
testing is done using a structural equation model
analysis (SEM). The primary decision-making
hypothesis is as follows:
If p-value <0.05, Ho is rejected
If p-value> 0.05 then Ho fails to be rejected
(Ho accepted)
The primary decision-making hypothesis test is
to compare the magnitude of the p-value with a
significant level of 5% (alpha 0.05). If the p-value is
more than alpha 0.05, the null hypothesis (Ho) fails
to be rejected which means there is no significant
relationship between the two variables and vice
The Effect of Self-service Technology Service Quality and Customer Satisfaction toward Loyalty and Behavioural Intentions on E-banking
Users
313
versa if the p-value is lower than alpha 0.05, the null
hypothesis (Ho) is rejected.
Hypothesis 1
The null hypothesis (Ho) and the alternative
hypothesis (Ha) are as follows:
Ho1: There is no positive influence on the Self-
Service Technology Service Quality on
Loyalty.
Ha1: There is a positive influence on the Self-
Service Technology Service Quality on
Loyalty.
Table 18: Hypothesis 1 Testing Results
Hypothesis Esti
mate
p-
value
Decision
H1: There is a positive
influence on the
Self Service
Technology
Service Quality on
Loyalty
0,89
7
0,000 Ha1
supported
Based on the results of statistical tests, the p-
value is 0,000 <0,05, so Ho1 is not supported, and
Ha1 is supported. This means that there is a
significant influence of the Self-Service Technology
Service Quality on Loyalty. Regression coefficient
value of 0.897 indicates that the influence between
Self Service Technological Service Quality on
Loyalty is positive, which means that the higher the
level of Self-Service Technology Service Quality,
the loyalty will also increase.
H1: There is a positive influence on the Self-Service
Technology Service Quality on Loyalty.
Based on the testing of the first hypothesis, it can
be concluded that “There is a positive influence on
the Self-Service Technology Service Quality on
Loyalty” can be supported. The test results show that
the Self-Service Technology Service Quality has a
positive influence on loyalty. Self-service
technology can affect loyalty if the company can
improve service quality by creating new and exciting
things to create customer loyalty (Iqbal, 2017). With
the innovation of self-service technology that is
profitable for customers, the loyalty that customers
will give will also increase because the use of self-
service technology is effortless, it can be used
anywhere, and the level of error in usage is also
reduced due to the privacy policies provided by the
company - each user (Azisyah, 2016).
Hypothesis 2
Ho2: There is no positive influence on the Self-
Service Technology Service Quality on
Customer Satisfaction.
Ha2: There is a positive influence on the Self-
Service Technology Service Quality on
Customer Satisfaction.
Table 19: Hypothesis 2 Testing Results
Hypothesis Estimate p-value Decision
H2: There is a positive
influence on the
Self Service
Technology
Service Quality on
Customer
Satisfaction.
0,740 0,000 Ha2
supported
Based on the results of statistical tests, the p-
value is 0,000 <0,05, so Ho2 is not supported, and
Ha2 is supported. This value means that there is a
significant influence between the Self-Service
Technology Service Quality on Customer
Satisfaction. The regression coefficient value of
0.740 indicates that the influence between Self
Service Technology Service Quality on Customer
Satisfaction is positive, which means that the higher
the level of Self-Service Technology Service
Quality, the Customer Satisfaction will also
increase.
H2: There is a positive influence on the Self Service
Technology Service Quality on Customer
Satisfaction.
Based on the testing of the second hypothesis, it
can be concluded that H2, which reads “There is a
positive influence on the Self Service Technology
Service Quality on Customer Satisfaction.” Can be
supported. The test results show that the Self Service
Technology Service Quality has a positive influence
on Customer Satisfaction. This result shows that
there is a significant influence between the Self
Service Technology Service Quality on Customer
Satisfaction. Customer satisfaction comes from
customer expectations by providing appropriate
services will improve customer satisfaction
(Azisyah, 2016). All financial needs carried out by
the customer, if it is in accordance with the needs
and desires of the customer itself, it will have an
impact on satisfaction. When customers feel that the
operation of self-service technology runs smoothly
and attractively in terms of aesthetics, customers feel
made happy by the service provider. Feelings of
pleasure arising from customers will create
satisfaction for customers. Self-service quality that
affects customer satisfaction and has a significant
impact because, by increasing comfort in the use of
ICVHE 2019 - The International Conference of Vocational Higher Education (ICVHE) “Empowering Human Capital Towards Sustainable
4.0 Industry”
314
self-service technology, customer satisfaction will
be created (Iqbal, 2017).
Hypothesis 3
Ho3: There is no positive effect of the Self-
Service Technology Service Quality on
Behavioural Intentions.
Ha3: There is a positive influence on the Self-
Service Technology Service Quality on
Behavioural Intentions
Table 20: Hypothesis 3 Testing Results
Hypothesis Estimate p-value Decision
H3: There is a positive
influence on the
Self Service
Technology
Service Quality on
Behavioral
Intentions.
0,448 0,016 Ha3
supported
Based on the results of statistical tests, the p-
value 0.016 <0.05 means that Ho3 is not supported
and Ha3 is supported. This value means that there is
a significant influence between the Self-Service
Technology Service Quality on Behavioural
Intentions. The regression coefficient value of 0.448
shows that the effect of Self-Service Technician
Service Quality on Behavioural Intentions is
positive, which means that the higher the level of
Self-Service Technology Service Quality, the
Behavioural Intentions will also increase.
H3: There is a positive effect of Self-Service
Technic Service Quality on Behavioural
Intentions.
Based on the testing of the third hypothesis, it
can be concluded that H3, which reads “There is a
positive influence on the Self-Service Technology
Service Quality on Behavioural Intentions” can be
supported. The test results show that Self Service
Technology Service Quality has a positive influence
on Behavioural Intentions. Self-service quality has a
significant impact on behavioural intentions because
behavioural intentions can be created if the company
can provide quality self-service (Iqbal, 2017). Self-
service technology is basically to make it easier for
customers to transact. Convenience in the operation
of self-service technology is the basis for making
someone have positive behavioural intentions.
Quality self-service quality can create behavioural
intentions (Nelwan, 2014).
Hypothesis 4
Ho4: There is no positive influence on customer
Satisfaction on Loyalty.
Ha4: There is a positive influence on customer
Satisfaction on Loyalty.
Table 21: Hypothesis 4 Testing Results
Hypothesis Estimate p-value Decision
H4: There is a
positive influence
on Customer
Satisfaction on
Loyalty.
0,683 0,000 Ha4
supported
Based on the results of statistical tests, the p-
value is 0,000 <0,05, so Ho4 is not supported, and
Ha4 is supported. This value means that there is a
significant influence between Customer Satisfaction
on Loyalty. The regression coefficient of 0.683
shows that the effect of Customer Satisfaction on
Loyalty is positive, which means that the higher the
level of Customer Satisfaction, the loyalty will also
increase.
H4: There is a positive influence on customer
Satisfaction on Loyalty.
Based on the testing of the fourth hypothesis, it
can be concluded that H4, which reads “There is a
positive influence on Customer Satisfaction on
Loyalty” can be supported. The test results show that
Customer Satisfaction has a positive effect on
loyalty. Customer satisfaction is one of the most
critical factors of loyalty because of increasing
satisfaction. It will make the customer loyal and
loyal to his choice (Iqbal, 2017). Satisfaction arises
when the desire offered by the service provider is
given as a whole and in accordance with the wishes
of the customers. Customer satisfaction has a
significant influence on loyalty, namely by
improving the quality of service, loyalty in the form
of a product/service will also increase (Winata,
2015).
Hypothesis 5
Ho5: There is no positive effect of Perceived Value
on Brand Loyalty.
Ha5: There is a positive effect of Perceived Value on
Brand Loyalty.
Table 22: Hypothesis 5 Testing Results
Hypothesis Estimate p-value Decision
H5: There is a
positive
effect of
Perceived
Value on Brand
Loyalty
0,975 0,000 Ha5
supported
The Effect of Self-service Technology Service Quality and Customer Satisfaction toward Loyalty and Behavioural Intentions on E-banking
Users
315

Based on the results of statistical tests, the p-
value is 0,000 <0,05, so Ho5 is not supported, and
Ha5 is supported. This value means that there is a
significant influence between Customer Satisfaction
on Behavioural Intentions. The regression
coefficient of 0.975 shows that the effect of
Customer Satisfaction on Behavioural Intentions is
positive, which means that the higher the level of
Customer Satisfaction, the Behavioural Intentions
will also increase.
H5: There is a positive influence on customer
Satisfaction on Behavioral Intentions.
Based on the testing of the fifth hypothesis, it can
be concluded that H5, which reads “There is a
positive influence on Customer Satisfaction on
Behavioral Intentions” can be supported. The test
results show that Customer Satisfaction against
Behavioral Intentions. Customer satisfaction can be
formed by paying attention to the behaviour of
prospective buyers. When someone feels satisfied
with what has been obtained, then the intention of
customers to be able to use products/services in the
future will increase (Loana et al., 2015). The
possibility of continuing to use products/services
that have been chosen will be more substantial when
the service provider gives what the customer wants
according to their needs. Lin and Hsieh (2006)
determined that satisfaction and intention behaviour
had a positive effect. Collier and Sherrell (2010)
empirically prove that the form of customer
satisfaction positive intention to experience using
self-service technology regarding future use will
increase.
5 CONCLUSIONS
Based on the results of the study, it can be concluded
that:
1. There is a positive effect of Self-Service
Technology Service Quality on Loyalty. This
effect shows that the higher the Self-Service
Technology Service Quality, the loyalty will
also increase. The innovation of self-service
technology that benefits the customer, the
loyalty that customers will give will also
increase because the use of self-service
technology is effortless, can be used
anywhere. The usage level of error is reduced
due to the privacy policies provided by the
company for each user.
2. There is a positive effect of Self-Service
Technology Service Quality on Customer
Satisfaction. All financial needs carried out
by the customer, if it is in accordance with
the needs and desires of the customer itself, it
will have an impact on satisfaction. When
customers feel that the operation of self-
service technology runs smoothly and
attractively in terms of aesthetics, customers
feel made happy by the service provider.
Feelings of pleasure arising from customers
will create satisfaction for customers.
3. There is a positive effect of Self-Service
Technology Service Quality on Behavioural
Intentions. Self-service technology is
basically to make it easier for customers to
transact. Convenience in the operation of
self-service technology is the basis for
making someone have positive behavioural
intentions. Quality self-service quality can
create behavioural intentions.
4. There is a positive influence on Customer
Satisfaction on Loyalty. Satisfaction arises
when the desire offered by the service
provider is given and in accordance with the
wishes of the customers. Customer
satisfaction has a significant influence on
loyalty, namely by improving the quality of
service so that loyal feedback on a
product/service will also increase.
5. There is a positive influence on Customer
Satisfaction on Behavioural Intentions.
Customer satisfaction can be formed by
paying attention to the behaviour of
prospective buyers. When someone is
satisfied with what has been obtained, then
the intention of customers to be able to use
products or services in the future will
increase. The possibility of continuing to use
products or services that have been chosen
will be more substantial when the service
provider gives what the customer wants
according to their needs.
5.1 Managerial Implication
The results show that the higher the Self-Service
Technology Service Quality, the loyalty will also
increase. Therefore, managers of SST e-banking
service companies must be able to use SST e-
banking properly. This result aims to anticipate if
there are customers who want to use e-banking but
cannot operate it, then the service provider must be
able to explain how to use SST-banking well and
ICVHE 2019 - The International Conference of Vocational Higher Education (ICVHE) “Empowering Human Capital Towards Sustainable
4.0 Industry”
316

correctly. In addition, there is an increase in features
that can be tailored to customer needs in order to
improve service quality by adding services such as
transfers to other banks or between banks using
foreign currencies.
The results showed that the higher the Self-
Service Technology Service Quality, Customer
Satisfaction will also increase. Therefore, managers
need to add additional e-banking functions that are
attractive such as trading services for
businesspeople, goods auction services (houses,
cars, land). In addition, managers must also promote
SST e-banking services to the fullest, hold promos
and prizes to attract customers to use e-banking SST.
This value aims to increase customer satisfaction.
The results showed that the higher the Self-
Service Technology Service Quality, the higher the
Behavioural Intentions. Therefore, managers need to
convince customers that the e-banking SST that has
been chosen as the best SST, because it is easy to
use, product and service offerings are also complete
and in accordance with the wishes of the customers.
Managers must also ensure that customers continue
to use SST-banking by communicating with
customers. Asking whether there are complaints or
suggestions in supporting the improvement of
service quality is one way to find out whether the
customer has the intention to continue using the
SST-banking service or not.
The results show that the higher the Customer
Satisfaction, the loyalty will also increase. Self-
service technology provided by the service provider
company is in line with customer expectations, it is
expected that managers can maintain the quality of
service so that customers are more loyal to the
service provider company. In addition, managers
need to improve overall independent technology
services. One way is to check the system regularly
and provide monthly reports to oversee the system
from e-banking.
The results showed that the higher the Customer
Satisfaction, the Behavioural Intentions would also
increase. Managers need to listen to the ideas of
customers in order to improve self-service
technology. This condition is so that the intention or
behaviour of customers becomes positive and
customers feel heard about the ideas given for the
development of e-banking SST. In addition,
managers must give a positive impression to
customers, so that customers can provide
recommendations to friends, family and relatives to
participate in using services from SST e-banking.
REFERENCES
Alrubaiee, L., & Alnazer, N. (2010). Investigate the
Impact of Relationship Marketing Orientation on
Customer Loyalty: The Customer’s Perspective.
International Journal of Marketing Studies, 2, 155-
174.
Azisyah, D., A. (2016). Pengaruh Self Service
Technology, Kualitas Layanan, Hubungan Pemasaran
Terhadap Kepuasan dan Loyalitas Nasabah pada Bank
BNI di Surabaya. Jurnal Manajemen Sekolah Tinggi
Ilmu Ekonomi Surabaya.
Cronin, J. J., Brady, M. K., & Hult, G. T. M. (2000).
Assessing the effects of quality, value, and
customer satisfaction on consumer behavioural
intentions in service environments. Journal of
Retailing, 76(2), 193–218.
Engel, et al., (2000). Perilaku Konsumen. Edisi Keenam.
Jilid I. Jakarta: Binarupa Aksara.
Fitzsimmons, J., F., M. (2008). Service Management. New
York: McGraw-Hill. Inc.
Fornell, C., Johnson, M. D., Anderson, E. W., Cha, J., &
Bryant, B. E. (1996). The American customer
satisfaction index: nature, purpose, and findings.
Journal of Marketing, 60(4), 7–18.
Ghozali, Imam. (2013). Aplikasi Analisis Multivariate
dengan Program SPSS Edisi Ketujuh. Semarang:
Badan Penerbit Universitas Diponegoro.
Griffin, R. W., & Moorehead, G. (2013). Organisational
Behavior: Managing People and Organisations,
Eleventh Edition. USA: South-Western, Cengage
Learning.
Hair, J.F., Anderson, R.E., Tatham, R.L. & Black, W.C.
(2013). Multivariate Data Analysis, 10th ed. Prentice-
Hall Publisher, Upper Saddle River, New Jersey.
Hsieh, H., F. dan Shannon, S., E. (2005). Three
Approaches to Qualitative Content Analysis.
Qualitative Health Research, 15 (2).
http://infobanknews.com/empat-tahun-pengguna-e-
banking-meningkat-270/. Diakses Bulan April 2018.
https://Sharingvision.com/pertumbuhan-internet-banking-
di-indonesia/. Diakses bulan April 2018.
Iqbal, M. S., Hassan, M. U., Sharif, S., & Habibah, U.
(2017). Interrelationship among corporate image,
service quality, customer satisfaction, and customer
loyalty: Testing the moderating impact of complaint
handling. International Journal of Academic
Research in Business and Social Sciences, 7(11),
667–688.
Iqbal, M., M. (2017). Minat untuk Menggunakan Go-Pay
pada Layanan Go-Ride. Jurnal Manajemen dan Bisnis.
Semarang.
Irawan, B., S. (2012). Manajemen Pemasaran Modern.
Edisi ke 2. Yogyakarta: Liberty Offset.
Ishaq, M. I. (2014). Perceived Value, Service Quality,
Corporate Image and Customer Loyalty: Empirical
Assessment from Pakistan. Serbian Journal of
Management, Vol. 7. No. 1.
Kasmir. (2012). Manajemen Perbankan Jakarta: Raja
Grafindo Persada.
The Effect of Self-service Technology Service Quality and Customer Satisfaction toward Loyalty and Behavioural Intentions on E-banking
Users
317

Kotler, Philip and Kevin Lane Keller. (2016). Marketing
Management 15th Edition, Pearson Education, Inc.
Lehtinen, U., & Lehtinen, J. R. (1991). Two approaches to
service quality dimensions. Service Industries
Journal, 11(3), 287–303.
Liestyana, Y. (2009). Persepsi Nasabah Tentang Layanan
Perbankan: Pengaruh Service Failure dan Service
Recovery Terhadap Behavioral Intention. Jurnal
Keuangan dan Perbankan. Vol. 13, hal. 165-175.
Lin, J.-S. C., & Hsieh, P.-L. (2011). Assessing the self-
service technology encounters:Development and
validation of SSTQUAL scale. Journal of Retailing,
87(2), 194–206.
Loanata, I., A., dan Dasmasela, K., N. (2015). Analisa
Pengaruh Service Quality Terhadap Behavioral
Intentions Dengan Customer Satisfaction Sebagai
Variabel Intervening di Amaris Hotel Surabaya.
Journal Universitas Kristen Petra: Surabaya.
Lovelock, C. dan Wright, H., L., K. (2011). Manajemen
Pemasaran Jasa. Jakarta: PT. Indeks
Gramedia Group.
Meuter, L., M., et al., (2000). Self Service Technology:
Understanding Customer Satisfaction with
Technology Based Service Encounter. Journal of
Marketing. Vol 64 (No.3).
Mowen, J., C. (2012). Perilaku Konsumen Erlangga.
Jakarta.
Musanto, T. (2004). Faktor-Faktor Kepuasaan Pelanggan
dan Loyalitas Pelanggan: Studi Kasus pada CV.
Sarana Media Advertising Surabaya. Jurnal
Manajemen & Kewirausahaan. Vol. 6, No. 2.
September 2004.
Musfar, T. F. dan Novia, V. (2012). Pengaruh Experiential
Marketing Terhadap Customer Loyalty Pada
Pelanggan Restoran Koki Sunda di Pekanbaru. Jurnal
Ekonomi. Vol. 20 (4).
Mohsan, F., Nawaz, M. M., Khan, M. S., Shaukat, Z., dan
Aslam, N., (2011) Impact of Customer Satisfaction on
Customer Loyalty and Intention to Switch: Evidence
from Banking Sector of Pakistan, International Journal
of Business and Social Science, Vol. 2 (16).
Oliver, R. L. (2015). Whence Consumer Loyalty? Journal
of Marketing. 63 (4).
Rambat. L. (2013). Manajemen Pemasaran Jasa. Salemba
Empat: Jakarta.
Schiffman, L., G. dan Kanuk, L., L. (2010). Consumer
Behaviour. 10th Edition. Pearson Education.
Schiffman, L.G., & Kanuk, Lesley L. (2012). Consumer
Behavior. New Jersey: Pearson Prentince Hall.
Sekaran, Uma (2012). Research Method for Business: A
Skill Building Approach.New York: John Wiley &
Sons.
Tjiptono, F. (2014). Pemasaran Jasa – Prinsip, Penerapan
dan Penelitian: Yogyakarta.
Winata, L., H. (2015). Pengaruh Customer Satisfaction
Terhadap Customer Loyalty dan Intention To Switch
Nasabah BCA Cabang Darmo Surabaya. Jurnal Ilmiah
Mahasiswa Universitas Surabaya. Vol. 4, No. 2:
Surabaya.
Zeithaml, V. A. dan Bitner, M. J. (2013). Service
Marketing, Fifth Edition, USA: McGraw Hill Co. Inc.
Zeng, F., Zuohao, H. dan Zhilin. R., C. (2009).
Determinants of Online Service Satisfaction and Their
Impact on Behavioral Intentions. Total Quality
Management, Vol. 20. No. 9.
ICVHE 2019 - The International Conference of Vocational Higher Education (ICVHE) “Empowering Human Capital Towards Sustainable
4.0 Industry”
318
