
Effect of Brand Image and Customer Value on Gojek
Go-Ride Customer Satisfaction in Manado City
Cynthia Claudia Poli
1
and Riane Johnly Pio
2
1
Post Graduate Program, Universitas Sam Ratulangi, Manado, Indonesia
2
Business Administration Program, Universitas Sam Ratulangi, Manado, Indonesia
Keywords: Brand image, customer value, customer satisfaction
Abstract: The purpose of this study was to determine the effect of brand image and customer value on customer
satisfaction with Gojek Go-Ride transportation service users in Manado City. The population of this study
were students using Gojek Go-Ride transportation services in Manado City. The samples were 100 students
from Sam Ratulangi University using Gojek Go-Ride transportation services. Primary data was collected
using a questionnaire and analyzed using Structural Equation Modeling (SEM) with Partial Least Square
(PLS) method using SmartPLS software. The results showed that partially the brand image had an effect on
customer value and customer satisfaction. Customer value has a significant effect on customer satisfaction,
so the management of Gojek Go-Ride must be able to increase customer value, and improve brand image by
providing maximum service to customers.
1 INTRODUCTION
In transportation services, there is an increasing
number of vehicles, both vehicles, passenger cars,
buses, freight cars, and motorcycles each year. Of
the four modes of transportation, the Central Agency
on Statistics data shows that the highest number of
motorbikes from 2015 to 2017, reaching 14,149,526
units, an increase of 14%.
Motorcycles today has a function as public
service vehicles which were used to transport people
or goods and charge a fee agreed. The transport of
this type is known as a motorcycle taxi or ojek in
Indonesia. Along with the development of
technology, there are currently online application-
based transportation innovations that introduce
motorcycle taxi booking services via smartphones.
One of the online transportation service companies
of the motorbike is Gojek.
Gojek is the company leading the revolution in
the motorcycle taxi industry and pioneered mobile
application-based motorcycle taxi services through
its Go-Ride service. The use of Gojek is progressing
included in Manado. Based on customer data, Gojek
was award as a Top Brand Award, because Gojek
was at the highest percentage in 2016 amounted to
80.8%. However, the following year in 2017 and
2018 Gojek decreased, by 59.2% and 44.9%
respectively. The Top Brand Award surveyed, one
of the cities was Manado, so it can be assumed that
Gojek in Manado decreased customers.
1.1 Objectives
The objectives of this study are:
1. To analyze the influence of brand image on
customer satisfaction users of Gojek Go-
Ride transportation services.
2. To analyze the influence of brand image on
customer value users of Gojek Go-Ride
transportation services.
3. To analyze the influence of customer value
on customer satisfaction users of Gojek Go-
Ride transportation services.
2 LITERATURE REVIEW
2.1 Brand Image
According to Kotler and Keller (2009), brand image
is the perception and belief held by consumers, as
reflected by the association that facilitates in the
customer’s memory, which can always be
266
Claudia Poli, C. and Johnly Pio, R.
Effect of Brand Image and Customer Value on Gojek Go-Ride Customer Satisfaction in Manado City.
DOI: 10.5220/0010673600002967
In Proceedings of the 4th International Conference of Vocational Higher Education (ICVHE 2019) - Empowering Human Capital Towards Sustainable 4.0 Industry, pages 266-271
ISBN: 978-989-758-530-2; ISSN: 2184-9870
Copyright
c
2021 by SCITEPRESS – Science and Technology Publications, Lda. All rights reserved
understood when listening to slogans and
remembering consumers imagined. According to
Tjiptono (2015), brand image is a series of
associations perceived by individuals all the time,
resulting in the direct or indirect experience of a
brand. Schiffman and Kanuk (2000) suggested the
factors forming the brand image, namely the quality
or quality, can be trusted or relied upon, the risk,
price and own image.
2.2 Customer Value
According to Kotler (2005), customer value is the
difference between total customer value and total
customer cost where total customer value is a set of
benefits expected by customers from a particular
product or service, and total customer costs are a set
of costs expected by customers incurred to evaluate,
obtain, use and discard the product or service. The
concept of customer value gives a picture of a
company’s customers who consider what they want
and believe that they benefit from a product that they
get (Lapierre, 2000). According to Sweeney and
Soutar (2001), customer value consists of four
dimensions, namely emotional value, social value,
quality/performance value.
2.3 Customer Satisfaction
According to Tjiptono (2008), customer satisfaction
is the difference between expectations and perceived
performance or results. Satisfied customers will
show great opportunities to make repeat purchases
or buy other products in the same company in the
future. They will also express the goodness of the
product and the company concerned to others.
Customers experience various levels of satisfaction
and dissatisfaction after experiencing each service
according to the extent to which their expectations
are met or exceeded. Because satisfaction is an
emotional state, their post-purchase reaction can be
anger, dissatisfaction, aggravation, neutrality,
excitement or pleasure (Lovelock and Wright,
2005). According to Kotler (2009), satisfied
customers have characteristics, are loyal to the
product; there is positive word of mouth
communication, the company becomes the primary
consideration when buying other brands.
3 FRAMEWORK AND
RESEARCH HYPOTHESIS
3.1 Prior Research
Research from Tsai et al., (2010) with the title The
Effect of Customer Value, Customer Satisfaction,
and Switching Cost on Customer Loyalty: An
Empirical Study of Hypermarkets in Taiwan. The
results showed that customers with more positive
perceptions about the value of products/services
have more favourable evaluations, higher
satisfaction, and loyalty. Greater satisfaction
combined with more significant concern over non-
monetary switching costs also increases customer
loyalty to hypermarkets.
Suliyanto (2013) with the title Effect of
Customer Value and Customer Satisfaction on
Customer Loyalty: Switching Cost as a Moderation
Variable. The results showed that customer value
had a positive effect on customer satisfaction,
customer value and customer satisfaction had a
positive effect on switching cost loyalty did not
moderate the relationship between customer value
and customer satisfaction on loyalty.
Andries et al., (2019) with the title The Influence
of Online Community Experience on Brand Image
and Brand Engagement in the Formation of Value
Co-Creation (Study at Gojek Community in
Manado). The results showed that there was an
online community experience relationship through
brand image and brand engagement towards value
co-creation. The implications of this research can
provide a deep understanding of online community
experiences, brand image, brand engagement and
value co-creation through online community studies
in Manado.
3.2 Framework and Hypothesis
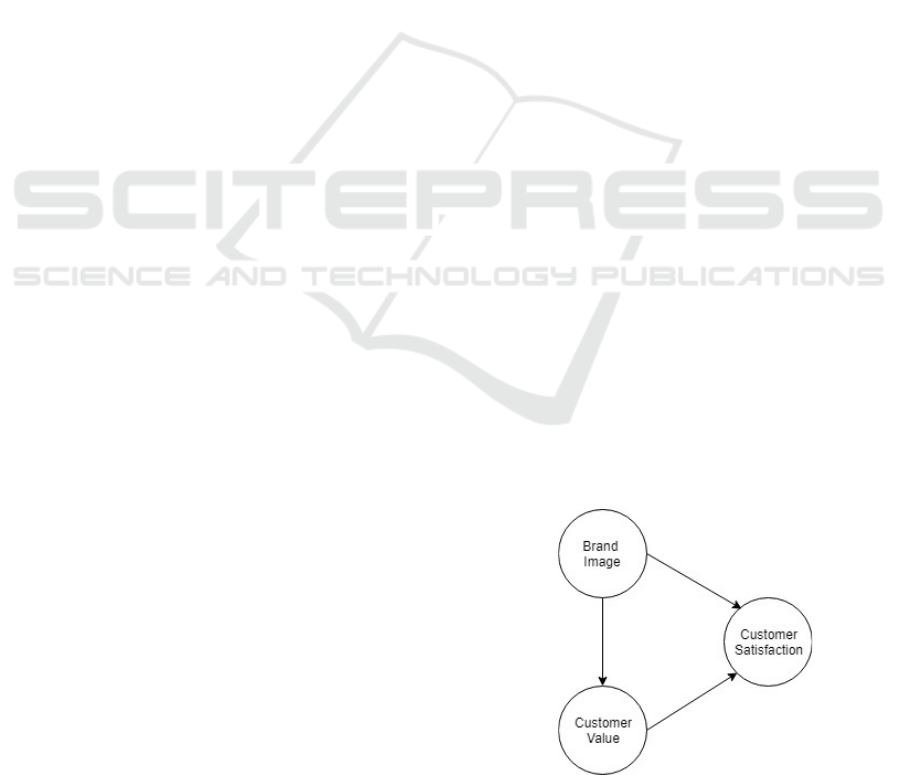
Figure 1: The Empirical Research Model.
Effect of Brand Image and Customer Value on Gojek Go-Ride Customer Satisfaction in Manado City
267
As stated in Figure 1, the hypothesis is:
H1: Brand image influence on Gojek Go-Ride
customer satisfaction.
H2: Brand image influence on Gojek Go-Ride
customer value.
H3: Customer value influence on Gojek Go-Ride
customer satisfaction.
4 METHODOLOGY
This type of research is quantitative research,
namely research that analyzes data quantitatively
/statistically, to test the hypotheses that have been
set then interpret the results of the analysis to obtain
conclusions. The study was conducted at Sam
Ratulangi University with its address on Jalan
Kampus, Bahu, Kleak, Malalayang, Kota Manado.
The population in this study were students of
Sam Ratulangi University, Manado. While the
sample is part of the number and characteristics
possessed by the population. The sample is Sam
Ratulangi University Manado Student, who uses
Gojek Go-Ride transportation. If a large population
and research are not possible to study everything in
the population, for example, limited funds,
workforce and time, then research can use samples
drawn from that population (Sugiyono, 2008). The
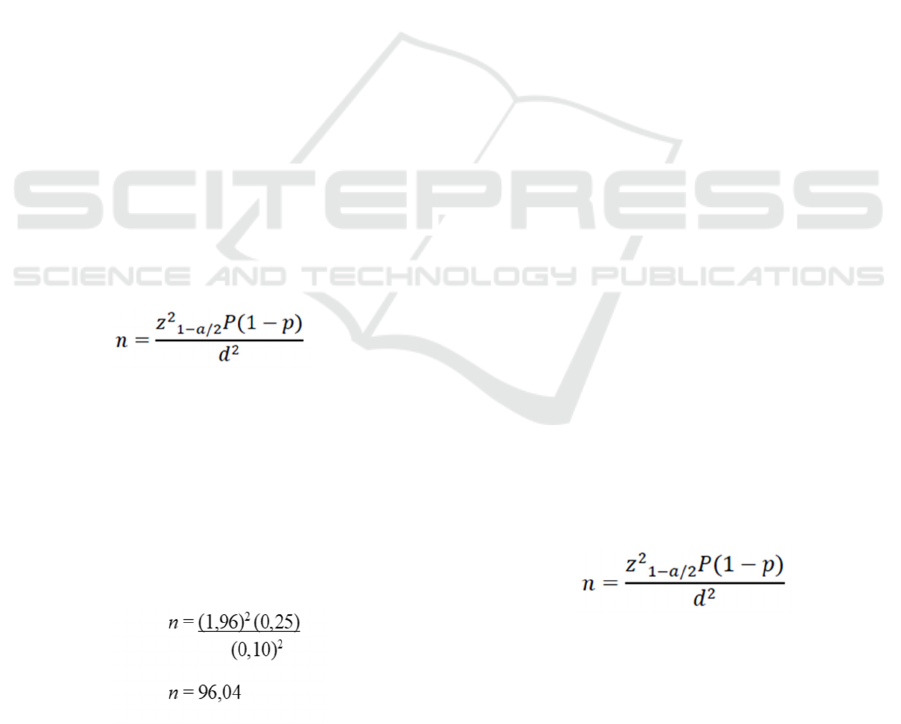
population in this study is vast in number then to
determine the number of samples using the formula
Lemeshow:
(1)
N : number of samples
z
2
1-α/2
: normal standard values., (α: 0,05,
and Z: 1,96)
P(1-p) : estimated population proportion (P: 0,5,
and P(1-p): 0,25)
d : tolerated deviations (10%)
Through the formula above, the number of samples
to be used is:
(2)
Based on the calculation results, the sample obtained
using the above formula was 96.04 but rounded up
to 100 people.
SmartPLS software was applied to assist the
Partial Least Square (PLS) analysis in order to
determine the effect of brand image variables on
customer satisfaction, customer value variables on
customer satisfaction, trust variables on customer
satisfaction, and customer satisfaction variables on
customer loyalty. The steps used for analyzing the
data after taken questionnaire were a variable table
of brand image distribution, a variables table of
customer value distribution, a trust distribution
variables table, a variable table of customer
satisfaction distribution, a variable table of customer
loyalty distribution, construct path diagram and
computational process.
5 RESULT
5.1 Validity
This study uses an instrument in the form of a
questionnaire using a Likert scale of five answer
choices, from strongly disagreeing choices to
strongly agreeing to choices. Before data from
questionnaire collection can be used for further
analysis, testing the validity of the instrument is
needed. For testing validity, convergent validity and
measurement models can be seen from the
correlation between the indicator scores with the
variable scores. Indicators are considered valid if
they have AVE (Average Variance Extracted) values
above 0.5 or show all outer dimensions have loading
values> 0.5 so that it can be concluded that the
measurement meets the convergent validity criteria
(Chin, 1995). Based on the results of the validity test
for the three variables studied, namely Brand Image,
Customer Value, and Customer Satisfaction are all
valid.
5.2 Reliability
(3)
Cronbach’s alpha and composite reliability values
are used to view the reliability test to test the
reliability of the instrument. Cronbach’s alpha value
and composite reliability value will be declared
reliable if it has a value> 0.7 (Vinzi et al. 2010).
Based on the results of the reliability test for the
three variables studied, namely Brand Image,
ICVHE 2019 - The International Conference of Vocational Higher Education (ICVHE) “Empowering Human Capital Towards Sustainable
4.0 Industry”
268
Customer Value, and Customer Satisfaction are all
reliable.
5.3 PLS Analysis Result
PLS analysis is an interpretation of a structural
model. This model presents the relationships
between research variables. The coefficient indicates
the magnitude of the relationship between one
variable with another. A significant influence
between the two variables is determined if the P-
value is <0.05. In PLS, there are two influences,
namely direct influence and indirect influence.
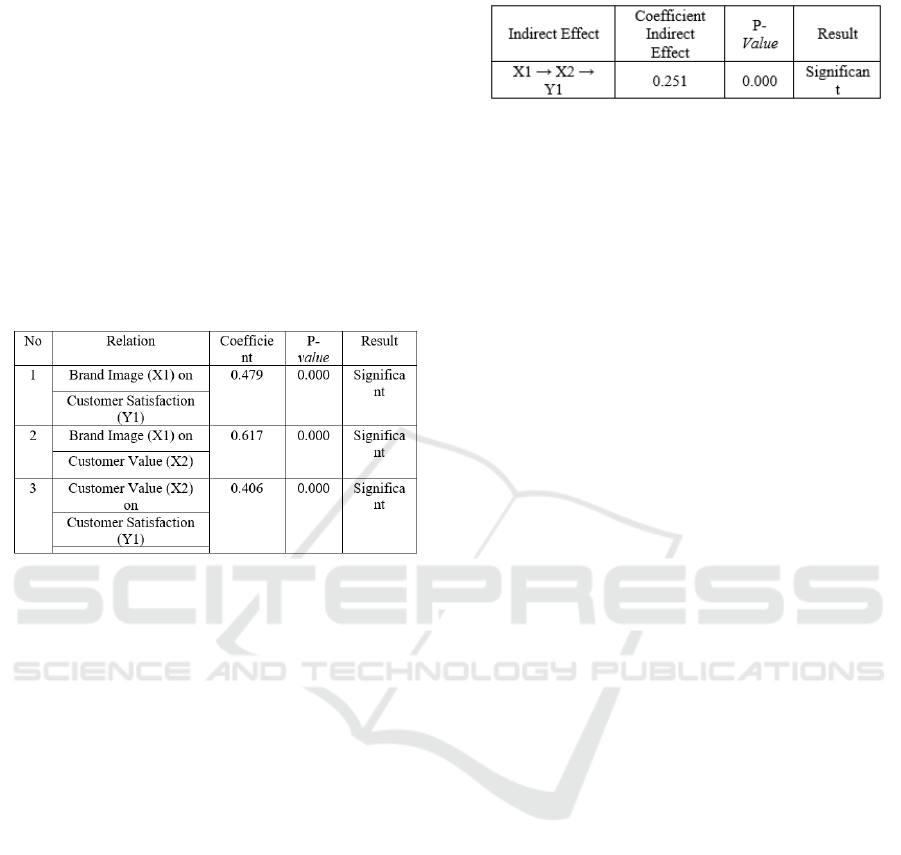
Table 1: PLS Results Direct Effect.
The direct effect test results, as presented in Table 1,
are as follows:
a. Effect of Brand Image (X1) on Customer
Satisfaction (Y1), obtained a structural
coefficient of 0.479 and P-value 0.000. Because
the P-value <0.05, indicates that there is a
significant influence between Brand Image (X1)
on Customer Satisfaction (Y1),
b. Effect of Brand Image (X1) on Customer Value
(X2), obtained a structural coefficient of 0.617
and P-value 0.000. Because the P-value <0.05,
indicates that there is a significant influence
between Brand Image (X1) on Customer Value
(X2).
c. Effect of Customer Value (X2) on Customer
Satisfaction (Y1), obtained a structural
coefficient of 0.406 and P-value 0.000. Because
the P-value <0.05, indicates that there is a
significant influence between Customer Value
(X2) on Customer Satisfaction (Y1).
In addition to testing the direct effect, PLS is
also known as an indirect effect. The following are
the results of indirect effects:
Table 2: PLS Results Indirect Effect.
Based on Table 2, there is an indirect effect as
follows:
The indirect effect between Brand Image (X1) on
Customer Satisfaction (Y1) through Customer Value
(X2), obtained the coefficient of the indirect effect
of 0.251 and P-value of 0.000 because P-value <0.05
then there is a significant indirect effect.
6 DISCUSSION
6.1 Effect of Brand Image on Customer
Satisfaction
For the results of the hypothesis found that Brand
Image has a significant effect on Customer
Satisfaction. The coefficient marked positive
indicates that the higher the Brand Image Variable
will affect the increase in Customer Satisfaction.
Brand image is something that is embedded in the
minds of customers. The better the perception in the
minds of customers of the brand image, customer
satisfaction will also be higher. Kambiz (2014)
suggests that customers feel satisfied with products
with a sharp brand image. A positive customer
image of a brand allows the customer to feel
satisfaction. This effect can be interpreted that the
better the brand image, the higher the customer
satisfaction.
Also found an indirect effect of 0.251, which is
significant. The coefficient marked positive
indicates that the higher the Brand Image Variable
will affect the increase in Customer Loyalty through
Customer Satisfaction.
6.2 Effect of Brand Image on Customer
Value
For the results of the hypothesis found that Brand
Image has a significant effect on Customer Value.
The coefficient marked positive indicates that the
higher the Brand Image Variable will affect the
increase in Customer Value. Customers will buy
products or services from companies that are felt to
be able to provide the highest value for customers in
meeting their needs.
Effect of Brand Image and Customer Value on Gojek Go-Ride Customer Satisfaction in Manado City
269

A high brand image will create high customer
value and reduce risk perception so that it will
increase consumer purchase intentions for a product
and ultimately motivate consumers to make
purchasing decisions. The results of this study are
following the findings by Hamidizadeh et al. (2011)
found that the image has a positive effect on
customer value.
6.3 Effect of Customer Value on
Customer Satisfaction
For the results of the hypothesis found that
Customer Value has a significant effect on Customer
Satisfaction. The coefficient marked positive
indicates that the higher the Customer Value
Variable will affect the increase in Customer
Satisfaction. Perception of value is very influential
on customer satisfaction. The more customers see
the benefits of services outweigh the costs or costs
incurred to obtain a service, the higher their
perception of the value of service, which in turn will
result in greater satisfaction. This research is also
following the theory put forward by Gale (1994) that
customer value is a perception of the value of the
quality offered is relatively high from competitors
will affect the level of customer satisfaction.
7 CONCLUSION
The result showed that the effect of brand image on
customer satisfaction was significant. The brand
image influenced high and low customer
satisfaction. Also, there is a significant indirect
influence of brand image on customer satisfaction
through customer value users of Gojek Go-Ride
transportation services. The influence of customer
value on customer satisfaction was significant, thus
high and low customer satisfaction was influenced
by customer value users of Gojek Go-Ride
transportation services; The influence of customer
value on customer satisfaction was significant. Thus
the high and low customer loyalty was influenced by
customer satisfaction users of Gojek Go-Ride
transportation services.
It is suggested that Gojek must maintain and
enhance a better brand image. As a consequence,
future customers will put more trust in their brand,
especially Go-Ride services. There is a need to
maintain a positive image of Gojek. This image
would be achieved by service accuracy and vigorous
social and mass promotions. Gojek must continue to
increase customer’s value in various dimensions.
The dimensions include price, quality, emotional
and social value to increase customer’s value and
satisfaction.
REFERENCES
Andries, H., Areros, W. A., & Pio, R. J. (2019). “The
Influence of Online Community Experience on Brand
Image and Brand Engagement in the Formation of
Value Co-Creation (Study at Go-Jek Community in
Manado)”. Advances in Economics, Business and
Management Research, volume 74. Pp: 138-143.
Chin, W.W. (1995). Partial Least Squareis to LISREL as
Principal Componwnta Analysis is to cammon Factor
Analysis. Technology Studies
Gale, Bradley. T. (1994). Managing Customer Value:
Creating Quality and Service That Customers Can
See. New York: The Free Press.
Hamidizadeh., Reza, M., Nasrin, J., Abbasali, H., &
Abolghasem, E. (2011). “The Effect of Demographic
Characteristics on Antecedents and Consequences of
Customer Satisfaction in Banking Industry”. Canadian
Social Science, 7(4). Pp: 198-203.
Kotler, P. (2005). Manajemen Pemasaran, Jilid 1. Jakarta:
Indeks.
Kotler, P. (2009). Manajemen Pemasaran. Edisi 13.
Jakarta: Erlangga.
Kotler, P., & Keller, K.L. (2009). Manajemen Pemasaran,
Jilid I. Edisi ketigabelas. Jakarta: Erlangga.
Lapierre, J. (2000). “Customer-Perceived Value in
Industrial Contexts”. Journal of Business & Industrial
Marketing, Vol.15. Pp: 122-140.
Lovelock, C.H., & Wright, L.K. (2005). Manajemen
Pemasaran Jasa. PT. Indeks Kelompok Gramedia.
Jakarta
Schiffman, L.G., & Kanuk, L. L. (2000). Perilaku
Konsumen. Edisi ke Tujuh. Printice Hall New Jersey.
Sugiyono. 2008. Metode Penelitian Kuantitatif, Kualitatif
dan R&D. Bandung: Alfabeta.
Sulibhavi, B., & Shivashankar, K. (2017). “Brand Image
and Trust on Customers Loyalty: A Study on Private
Label Brands in Hubli-Dharwad Conglomerate City of
Karnataka”. Int. Journal of Engineering Research and
Application ISSN: 2248-9622, Vol. 7, Issue 9, (Part-
6). Pp: 01-06.
Suliyanto. (2013). “Pengaruh Nilai dan Kepuasan
Pelanggan Terhadap Loyalitas Pelanggan: Swiching
Cost Sebagai Variabel Moderasi”. Jurnal Ekonomi dan
Bisnis, Vol. 12, No. 1. Hal: 11-18.
Sweeney, J. C., & Soutar, G. N. (2001). “Consumer
Perceived Value: The Development of a Multiple
Item Scale”. Journal of Retailing, 77(2). Pp: 203-220.
Tjiptono, F. (2008). Strategi Pemasaran. Edisi III.
Yogyakarta: Andi.
Tjiptono, F. (2015). Strategi Pemasaran. Edisi 4.
Yogyakarta: Penerbit Andi.
Tsai, M.T., Tsai, C.L., Chang, H.C. (2010). “The Effect of
Customer Value, Customer Satisfaction, and
ICVHE 2019 - The International Conference of Vocational Higher Education (ICVHE) “Empowering Human Capital Towards Sustainable
4.0 Industry”
270

Switching Costs on Customer Loyalty: An Empirical
Study of Hypermarkets in Taiwan”. Social Behavior
and Personality an International Journal, 38(6). Pp:
729-740.
Vinzi, V.E., Chin, W.W., Henseler, J., & Wang, H.
(2010). Handbook of Partial Least Square Concept,
Method and Application. Springer-Verlag Berlin
Heidelberg.
Effect of Brand Image and Customer Value on Gojek Go-Ride Customer Satisfaction in Manado City
271
