
Social Media Marketing’s Influence on Customer Loyalty:
A Case Study of Siloam Hospital
Radityo Kusumo Santoso
1
, Nur Fadillah Dewi
2
1
Office Administration and Secretary Department, Vocational Education Program, Universitas Indonesia
2
Hospital Administration Department, Vocational Education Program, Universitas Indonesia
Keywords: Social media, customer loyalty, customer, marketing, hospital
Abstract: Rapid technological developments are affecting the intersection of life and the nation’s economy, disrupting
the way humans interact and communicate. This change affects how economic activities are conducted
place, especially in marketing, where customer retention is the most crucial objective. This study thereby
determines whether social media influences consumer loyalty by employing a quantitative approach with
multiple regression. Data were collected by distributing questionnaires to 32 respondents who were
inpatients at Siloam Hospital.
1 INTRODUCTION
The rapid development of technology has affected
the intersection of life and national economy; it has
also disrupted the way people communicate. The
disruption of the way consumer information is
distributed comes from the transition from print
media to digital media. This transition has further
modified the communication modes employed while
socializing in the community. The Indonesian
Association of Internet Service Providers reports
that in 2017 the number of Internet users in
Indonesia stood at 143.26 million users—an increase
of 10 million users over 2016 (132.7 million users).
It also indicated that the majority of Internet users
have 72.41% more access to people in urban areas.
According to We Are Social, which produces
reports on social media, there are now 130 million
active social media users on various social media
platforms in Indonesia.
This change in how people consume new
information affects how economic activities are
performed, especially in the field of marketing,
where creating customer loyalty to a brand is of
primary importance. According to Park and Seo
(2018), social media is defined as an online
application program, platform, or media that ease
interactions, joint work, or content sharing.
Social media has mostly been recognized as an
effective mechanism, contributing to a company’s
marketing goals and strategy, especially in customer
engagement, customer relationship management,
and communication (Filo, Lock, and Karg, 2015).
Alongside the generalization of social media in the
society, researchers have studied the use of social
media in society by asking users why they use social
media, how much time they spend using it, and how
much social media do they use over a given period
(Bolton et al., 2013). According to the 90-9-1 rule
for the use of social media, 90% of social media
users only display content, 9% use social media to
add comments, and only 1% add new content.
Further, social media users can be entered as active
users.
Social media plays a vital role in a company’s
marketing activities in terms of developing
individual customer relationships, and it offers
opportunities to reach customers (Kelly, Kerr, and
Drennan, 2010). In the business environment,
companies are expected to use social media in
several aspects, particularly in interacting with
customers, by facilitating information retrieval,
interactivity, promotion, and manipulating
customer’s purchasing behaviours (Zeng and
Gerritsen, 2014).
Bennet S. reported that approximately 93% of
companies had used innovative platforms and tools
in their efforts to communicate with and serve their
customers worldwide
(http://www.adweek.com/digital/45-social-media-
stats). With the increase of marketing with social
258
Kusumo Santoso, R. and Fadillah Dewi, N.
Social Media Marketing’s Influence on Customer Loyalty: A Case Study of Siloam Hospital.
DOI: 10.5220/0010673500002967
In Proceedings of the 4th International Conference of Vocational Higher Education (ICVHE 2019) - Empowering Human Capital Towards Sustainable 4.0 Industry, pages 258-265
ISBN: 978-989-758-530-2; ISSN: 2184-9870
Copyright
c
2021 by SCITEPRESS – Science and Technology Publications, Lda. All rights reserved

media in various sectors, a large amount of research
has been conducted related to the activities of social
media marketing (SMM); most of the research
focuses exclusively on the effects of SMM on
customer satisfaction or behavioural intent (Sano,
2015). Several studies have suggested that the
degree of customer loyalty is often higher if they
favoured the company image and reputation
(Nguyen and Leblanc, 2001). Social media has
attracted the attention of practitioners or researchers
to have a better understanding regarding how such
applications can be successfully implemented to
improve both image and reputation (Billings, 2014;
Hardin, 2014; Hutchins, 2014).
A need to learn more about the key requirements
arises for a successful implementation of such
technology. Further, the required amount of
investment in such applications requires to be
determined (Hutchins, 2014). In this respect,
Hutchins has staunchly emphasized the importance
of researching the role of social media in different
contexts to expand existing knowledge of issues
important in social media’s context (Hutchins,
2014).
Furthermore, the role of Facebook in improving
customer loyalty was proven by Gamboa and
Gonçalves (2014). According to this research,
Facebook fans of the Zara brand had a higher
confidence level, were more satisfied, experienced a
higher value, and accordingly expressed more
loyalty to Zara than those who did not follow the
brand on Facebook. In general, customer satisfaction
is often defined and measured to reflect specific
settings and levels determined by every aspect of the
purchasing process (Czepiel and Rosenberg, 1977).
Customer satisfaction was considered an essential
element for achieving customer loyalty (Oliver,
1999; Zeithaml, Berry, and Parasuraman, 1996a).
The research mentioned above background has led
to this study, which researches the influence of
SMM activities on customer loyalty.
2 LITERATURE REVIEW
2.1 SMM
According to Neti’s (2011) study, SMM consists of
attempts to use social media to persuade consumers
of a company to purchase its products or services.
SMM is a type of marketing that uses online
communities, social networking, and marketing
blogs. Moreover, there are three advantages to
SMM. First, SMM provides marketers with the
ability to not only promote current products or
services but also to address consumer complaints
and suggestions. Second, SMM makes it easy for
marketers to identify various peer groups or
influencers among different groups. Third, the use of
SMM can be said to have zero cost because most
social networking sites are not paid. For these
reasons, SMM can be used to improvise customer
loyalty (Neti, 2011).
The elements of social media are also discussed
in several studies. Kim and Ko (2012) classify SMM
features as entertainment, interaction, trend,
personalization, and word-of-mouth advertising and
apply these features to luxury brands. Sano (2014)
employed research on applied interaction,
trendiness, customization, and perceived risk as to
the four SMM components while researching on the
tourism industry. Chang’s (2012) comparative study
of the performance characteristics of each medium
(e.g., portals, blogs, and SNS) lists customer
participation, representation of information, unique
differentiation, content compliance, use of
information, and customer feedback as the
characteristics of social media. Based on the
previous studies, the SMM components are defined
as entertainment, interaction, trends, personalization,
and perceived risk for this study.
Entertainment can be defined as fun and play
through social media (Agichtein, Donato Castillo,
and Gionis, 2008). Some people use social media as
their entertainment. Virtual communities exist to
further this interest (Bagozzi and Dholakia, 2002;
Manthiou, Chiang, and Liang (Rebecca) Tang,
2013). Virtual communities also include space for
consumers to discuss and exchange ideas, and
interactions through social media provide insight
regarding the users who contribute to these
platforms, which are usually associated with specific
brands. These users meet in cyberspace and discuss
specific products and/or brands (Muntinga,
Moorman, and Smit, 2011).
Moreover, virtual communities offer the latest
news and information, making it a tool for users to
search for the most practical products (Naaman,
Becker, and Gravano, 2011). Consumers tend to
trust information obtained through social media
rather than through advertising involved in
marketing or promotional activities. Therefore, there
is confidence in the different types of social media
that offer the latest product information (Mangold
and Faulds, 2009). The trend is, therefore defined as
providing the latest information about products or
services (Godey et al., 2016).
Social Media Marketing’s Influence on Customer Loyalty: A Case Study of Siloam Hospital
259
The level of adaptation indicates what new
changes satisfy customer’s needs (Schmenner,
1986). Customization in social media is derived on
the basis of contact with individual users. This
custom is a vast difference between social media and
conventional advertising. It is possible to provide
customers with individually optimized information
generated by different sources. This practice is used
as a strategy to reinforce customer satisfaction (Ding
and Keh, 2016). Marketing through social media is
also a tool for companies to communicate the
uniqueness of their brands and for consumers to
indicate their preferences and loyalty to specific
brands (Martin and Todorov, 2010).
Previous research has identified the uncertainty
associated with consumer behaviour as a perceived
risk (Bauer, 1960). However, social media reduces
the uncertainty of this perceived risk because it
allows consumers to connect with companies and
check for new information (Sano, 2014). The
perceived risk is selected as an SMM component
mainly due to social media’s ability to reduce
anxiety or concerns felt by consumers.
2.2 Customer Satisfaction
Generally, customer satisfaction is often defined and
measured by using specific settings, and the level of
satisfaction is determined by examining every aspect
of purchasing and consumption process (Czepiel and
Rosenberg, 1977). In the context of intercity bus
services, purchase decision and service provision are
the two customer satisfaction elements that can be
used to measure the extent to which passenger
expectations have been met. Purchasing decision
satisfaction refers to the evaluation of how well
passengers are satisfied with their decision to choose
a particular company. In contrast, customer
satisfaction with the service is related to the
evaluation of how well passengers are satisfied with
the services provided by the company. Customer
satisfaction is thereby considered as an essential
element for maintaining customer loyalty (Oliver,
1999; Zeithaml, Berry, and Parasuraman, 1996a).
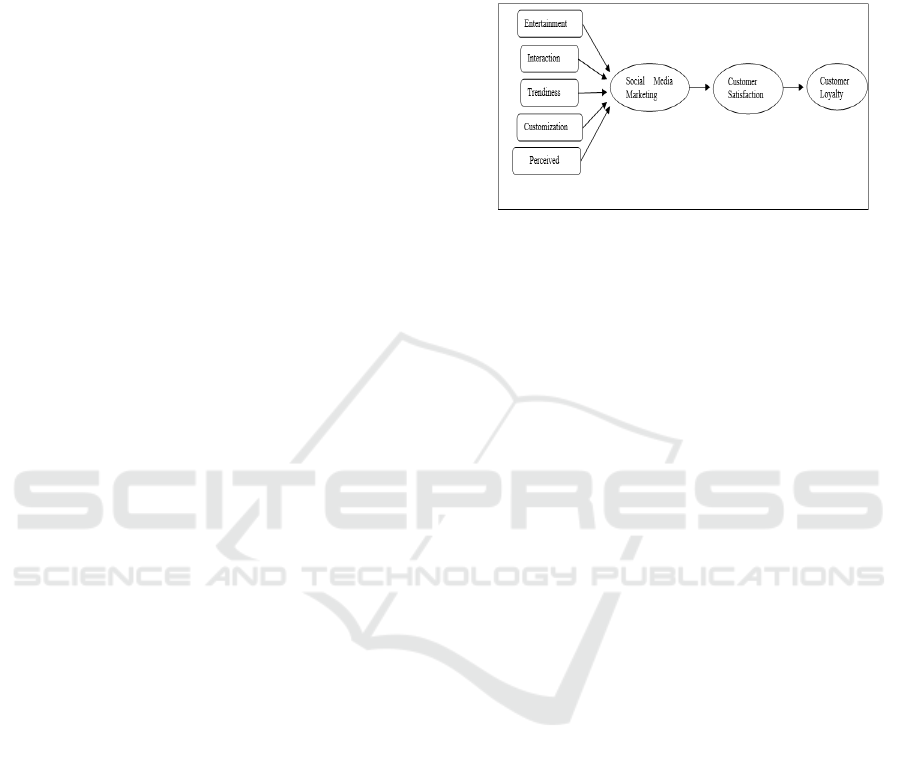
2.3 Customer Loyalty
Customer loyalty includes their buyback intentions
(behavioural loyalty) and their positive experiences
and willingness to retain old customers and attract
new customers in the services sector. They can
recommend a particular company’s services and
products to others (attitudinal loyalty) (Zeithaml,
Berry, and Parasuraman, 1996b). These desirable
behaviours and attitudes represent two essential
aspects of customer loyalty (Mandhachitara and
Poolthong, 2011; Martínez and Rodríguez del
Bosque, 2013). The research model is explained in
the figure below (Fig.1):
Figure 1: Research Model.
3 METHOD
The statistical package SPSS 19 was employed to
test and analyze the hypothesized relationships of
the research model. A questionnaire survey with a
total of 22 items was employed to collect data from
customers of Siloam Hospital.
3.1 Sample Design
The questionnaire used in this study was developed
based on a literature review; it examined the SMM
of Premier Hospital concerning five marketing
activities, namely, entertainment, interaction,
trendiness, customization, and perceived risk. The
survey also rated customer satisfaction for decision
satisfaction and service satisfaction. Customer
loyalty was rated for behavioral loyalty and
attitudinal loyalty.
ICVHE 2019 - The International Conference of Vocational Higher Education (ICVHE) “Empowering Human Capital Towards Sustainable
4.0 Industry”
260
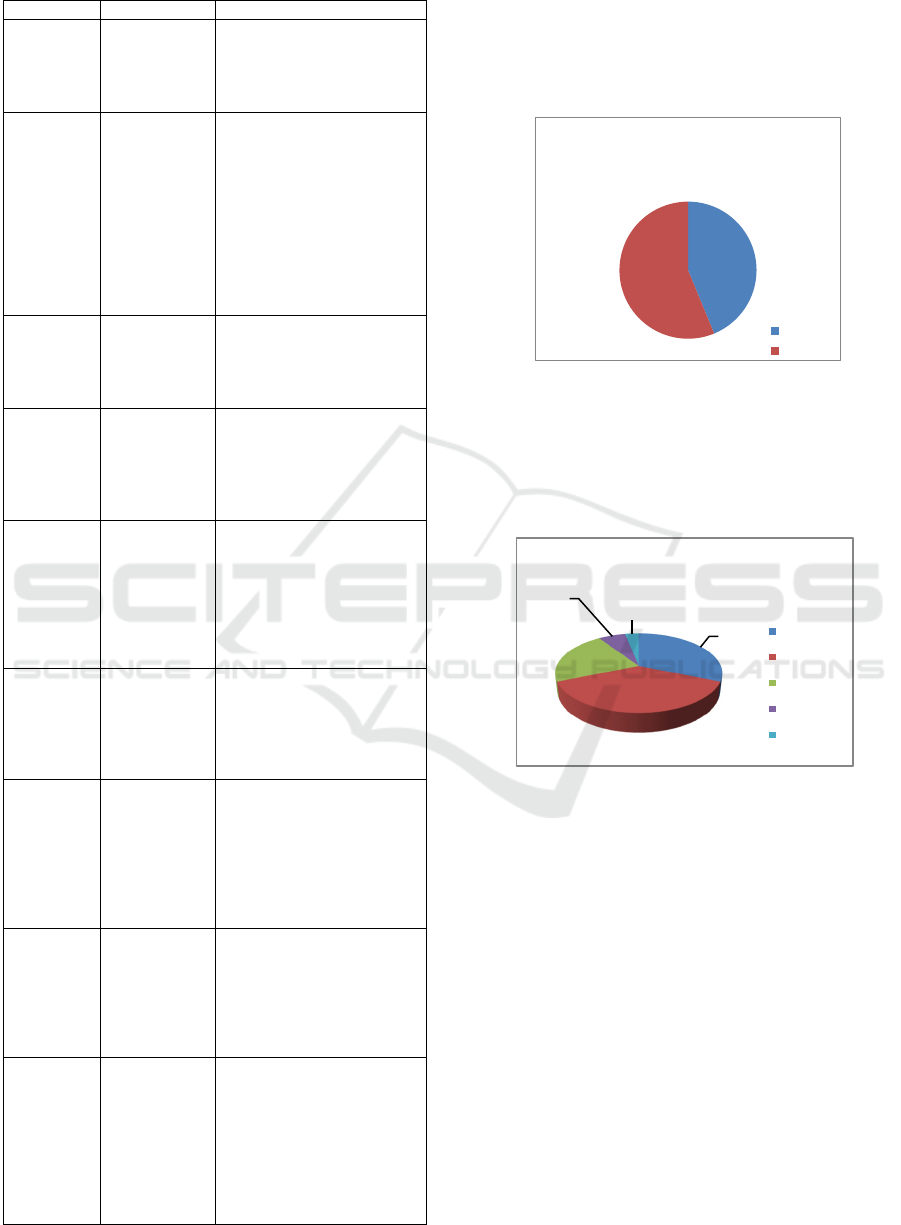
Table 1: Sample Design Table.
Concep
t
Variable Item
SMM
Activity
Entertainment
1. This hospital’s social
media platforms are fun.
2. The content shared by the
social media platforms of
this hospital is enjoyable.
Interaction
1. It is possible to share
information on the social
media platforms of this
hospital.
2. Discussion and exchange
of opinions are possible on
the social media platforms of
this hospital.
3. Expressing opinions is
accessible on the social
media of this hospital.
Trendiness
1. The information that is
shared on this hospital’s
social media is current.
2. The use of social media by
this hospital is in fashion.
Customization
1. I can find the information
that I need on this hospital’s
social media platforms.
2. This hospital’s social
media platforms provided the
information I needed.
Perceived
Risk
1. This hospital’s social
media has taken away my
concern(s) about the
hospital’s service.
2. This hospital’s social
media has alleviated my
concern(s) about the use of
the hospital
Customer
Satisfaction
Decision
Satisfaction
1. I have always had a
satisfactory experience with
this company.
2. I think choosing this
company is the right
decision.
Service
Satisfaction
1. The services of this
company always meet my
needs.
2. I love the services of this
company.
3. In general, I am satisfied
with the services of this
company.
Customer
Loyalty
Behavioural
Loyalty
(Customer
Repurchase
Intention)
1. I am a loyal customer of
this company.
2. I intend to remain a
customer of this company
3. This company was my
first choice when I needed
hospitalization.
Attitudinal
Loyalty
(Positive
Tendency
And
Willingness
To
Recommend
Companies )
1. I will probably say
positive things about this
hospital.
2. I will recommend this
hospital to my relatives and
friends.
3. I will recommend this
hospital if asked by others.
4 RESULTS AND DISCUSSION
4.1 Respondent Characteristics
4.1.1 Gender
Figure 2: Respondent Characteristics based on gender.
This study consisted of 32 respondents (18 women
and 14 men).
4.1.2 Age
Figure 3: Respondent Characteristics based on age.
Of all, 12 respondents of the research were
between 20 and 25 years old. Ten respondents were
<20 years old; 7 respondents were 26–30 years old,
two respondents were 31–35 years and one
respondent was >35 years old. This research notably
consisted of young respondents of this hospital.
4.1.3 Education
Based on the information provided by the
respondents concerning their formal education, the
majority of the respondents had a high school
education; and the remainder of the respondents had
advanced degrees. With seven respondents had
completed their degree courses, five respondents had
completed their diploma courses, and at least four
respondents had completed their masters.
<20
years;10
20‐25
Years;12
26‐30
Years;7
31‐35
Years;2
>35
Years;1
Age
<20years
20‐25Years
26‐30Years
31‐35Years
>35Years
14
18
Gender
Male
Female
Social Media Marketing’s Influence on Customer Loyalty: A Case Study of Siloam Hospital
261
Figure 4: Respondent Characteristics based on education.
4.2 Social Media Components
4.2.1 Entertainment Dimension
The table exhibits that the average ratings the
respondents gave to the entertainment component
ranged from 4.25 to 4.28. Based on these ratings, the
mean value was considered to be high; this displays
that the respondents did not experience lack of
entertainment while communicating with hospital
social media platforms.
Table 2: The average ratings to entertainment dimension.
No. Indicato
r
Mean Rating
1.
I am delighted when
interacting with the
hospital’s social media
platforms. 4.25 High
2.
I enjoy all the content
shared on this
hospital’s social media
platforms. 4.28 High
4.2.2 Interaction Dimension
In the table, all the indicators have high ratings, with
response No. 1 receiving the highest rating. With a
mean value of 4.66, the respondents agreed that
“This hospital’s social media platforms allow me to
share information.” Because mean on this question
is higher than on other indicators, this indicates that
social media is the medium of communication that
can increase information sharing among consumers.
Table 3: The average ratings to social media platforms.
No. Indicato
r
Mean Rating
1.
This hospital’s social
media platforms allow me
to share information. 4.66 High
2.
Access to this hospital’s
social media platforms
allows me to discuss and
share information related
to health. 4.41 High
3
This hospital’s social
media platforms allow me
to express my opinion. 4.34 High
4.2.3 Trendiness Dimension
The abovementioned table represents that the mean
of all indicators is high in this category. The highest
value is obtained for No. 1; with its mean value 4.66,
the respondents said: “In my opinion, the
information shared through this hospital’s social
media is up to date.” Because the mean value of No.
1 is higher than other indicators, it suggests that the
interaction in the high social media is the medium of
communication that can increase sharing
information to each other.
Table 4: The average ratings to trendiness dimension.
No. Indicato
r
Mean Rating
1.
In my opinion, the information
shared through this hospital’s
social media is up to date. 4.66 High
2.
Access to the hospital’s social
media is part of my lifestyle. 3.75 High
4.2.4 Customization Dimension
The abovementioned table’s indicator means are
ranked high, with No. 1’s rating being the highest.
The respondents gave “I can find the information I
need on this hospital’s social media.” mean value of
4.53. Because the mean value of this question is
higher than other indicators, it suggests that
customization of the hospital’s social media
platforms, as the medium of communication, enables
sharing of any health-related information.
Table 5: The average ratings to the customization
dimension.
No. Indicato
r
Mean Rating
1.
I can find the information I
need on this hospital’s social
media. 4.53 High
2
Social media platforms of this
hospital provide information
tha
t
I need. 4.44 High
High
School
;16
D3;5
S1;7
S2;4
0
5
10
15
20
EducationalBackground
High
Scho
ol
ICVHE 2019 - The International Conference of Vocational Higher Education (ICVHE) “Empowering Human Capital Towards Sustainable
4.0 Industry”
262
4.2.5 Perceived Risk Dimension
Table 6: The average ratings to perceived risk dimension.
No. Indicato
r
Mean Rating
1.
The information
I need, I can find
on social media
this hospital
4.09 Tallish
2.
Social media this
hospital provides
information I
need
4.22 Tallish
The table above shows that the average level of
the respondents. The results indicated that the
dimensions of entertainment ranged from 4.09 until
4.22. Based on the categories, its mean value shows
are in the category, somewhat high this shows that
the respondents did not reflect fell low-risk
perception on while communicating with hospital
social media.
4.2.6 Decision Satisfaction Dimension
Table 7: The average ratings to satisfaction dimension.
No. Indicato
r
Mean Rating
1.
I always have a
satisfying
experience at this
hospital.
4.41
High
2.
I chose this
hospital because I
think this is the
right choice.
4.44
High
This table displays that the mean values of all
indicators are rated high, with indicator No. 2 having
the highest mean. The respondents said, “I chose this
hospital because I think this is a good choice.” They
gave it a mean value of 4.44. The mean value of this
question is higher than on other indicators. It can be
concluded that respondents were satisfied with their
decision of choosing this hospital.
4.2.7 Service Satisfaction Dimension
Table 8: The average ratings to service satisfaction
dimension.
No. Indicato
r
Mean Rating
1.
Services at this
hospital always meet
my needs. 4.31 Tallish
2.
I love the services
provided in this
hospital. 4.34 High
3.
On the whole, I am
satisfied with the
services provided by
this hospital. 4.44 High
This table suggests that the mean values of two
indicators within the table are rated high, and one
indicator is tallish. No. 3 has the highest mean value,
4.44. The respondents said, “On the whole, I am
satisfied with the services provided by this hospital.”
Because the mean value for this question is higher
than the other indicators, it suggests that the
respondents’ are satisfied with the service of the
hospital.
4.2.8 Behavioral Loyalty Dimension
Table 9: The average ratings to behavioral loyalty.
No. Indicato
r
Mean Ratin
g
1.
I was a loyal
customer to
this hos
p
ital. 4.09 Tallish
2.
I will always be
a customer of
this hos
p
ital. 3.88 Tallish
3.
This hospital is
my first choice
when I need a
hos
p
ital. 4.03 Tallish
This table shows that the average mean values
of the indicators ranged from 3.88 to 4.09. These
mean values are somewhat high; this shows that the
respondents did not choose the hospital as their first
choice just because of the hospital’s social media
platforms.
Social Media Marketing’s Influence on Customer Loyalty: A Case Study of Siloam Hospital
263

4.2.9 Attitudinal Loyalty Dimension
Table 10: The average ratings to attitudinal loyalty.
No. Indicato
r
Mean Ratin
g
1.
I will make positive
comments about this
hospital. 4.66 High
2.
I would recommend
this hospital to my
family members and
relatives. 4.59 High
3.
I would recommend
the hospital to others. 4.66 High
This table suggests the mean values of all
indicators of willingness to recommend the hospital
are high while No. 1 and No. 3 share the highest
value (4.66). No. 1 indicates that the respondents
were willing to make positive comments about the
hospital, and No. 3 indicates that they will
recommend it to others. Because the mean value of
this question is higher than on other indicators, it
indicates that the respondents will provide positive
feedback for the hospital’s social media platforms.
The table mentioned below tests the hypothesis of
the influence of social media on customer loyalty.
Table 11: The test of hypothesis.
Significance score at 0.000 below 0.05 and score
of t calculation > t table, 5.561 > 1.659. The study
thereby concludes that SMM influences customer
loyalty. R
2
score exhibits that SMM influences
customer loyalty (50.8%); however, customer
loyalty is also affected by the other’s factor such as a
discount, reward, consumer behaviour, and product
price (49.2%).
5 CONCLUSION
This study understands the influence of SMM on
customer loyalty. On the basis of the analysis of this
study, we can conclude the following social media
does influence customer loyalty; this exhibits that
the use of social media has aided in maintaining
consumer. Further, R
2
score reveals that SMM
influenced customer loyalty (50.8%), and other
factors such as discount, reward, consumer behavior,
and product price also influenced customer loyalty
(49.2%).
REFERENCES
Agichtein, E., Donato Castillo, C., & Gionis, D. 2008,
February. Finding high-quality content in social
media. In Proceedings of the 2008 international
conference on web search and data mining (pp. 183–
194). ACM.
https://doi.org/10.1145/1341531.1341557.
Bagozzi, R. P., & Dholakia, U. M. 2002. Intentional social
action in virtual communities. J. Interact. Mark., 16(2),
2–21. https://doi.org/10.1002/dir.10006.
Bauer, R. A. 1960. Consumer behavior as risk taking. In
R. S. Hancock (Ed.), Dynamic marketing for a
changing world. Proceedings of the 43rd. Conference
of the American Marketing Association (pp. 389–398).
Billings, A. 2014. Power in the reverberation: Why
Twitter matters, but not the way most believe.
Commun. Sport, 2(2), 107–112. Retrieved from
http://journals.sagepub.com/doi/10.1177/21674795145
27427. https://doi.org/10.1177/2167479514527427.
Bolton, R. N., Parasuraman, A., Hoefnagels, A., Migchels,
N., Kabadayi, S., Gruber, T. 2013. Understanding
Generation Y and their use of social media: a review
and research agenda. J. Serv. Manag., 24(3), 245–267.
https://doi.org/10.1108/09564231311326987.
Chang, Y. H. 2012. A study on the marketing performance
using social media -Comparison between portal
advertisement. J. Digit. Convergence [Blog], and SNS
channel characteristics and performance, 10(8) (pp.
119–133).
Czepiel, J. A., & Rosenberg, L. J. 1977. Consumer
satisfaction: concept and measurement J. Scientist,
5(4), 403–411. https://doi.org/10.1007/BF02722070.
Ding, Y., & Keh, H. T. 2016. A re-examination of service
standardization versus customization from the
consumer’s perspective. J. Serv. Mark., 30(1), 16–28.
https://doi.org/10.1108/JSM-02-2015-0088.
Filo, K., Lock, D., & Karg, A. 2015. Sport and social
media research: a review. Sport Manag. Rev., 18(2),
166–181. https://doi.org/10.1016/j.smr.2014.11.001.
Gamboa, A. M., & Gonçalves, H. M. 2014. Customer
loyalty through social networks: lessons from Zara on
Facebook. Bus. Horiz., 57(6), 709–717.
https://doi.org/10.1016/j.bushor.2014.07.003.
ICVHE 2019 - The International Conference of Vocational Higher Education (ICVHE) “Empowering Human Capital Towards Sustainable
4.0 Industry”
264

Godey, B., Manthiou, A., Pederzoli, D., Rokka, J., Aiello,
G., … Singh, R. 2016. Social media marketing efforts
of luxury brands: influence on brand equity and
consumer behavior. J. Bus. Res., 69(12), 5833–5841.
https://doi.org/10.1016/j.jbusres.2016.04.181.
Hardin, M. 2014. Moving beyond description: Putting
Twitter in (theoretical) context. Commun. Sport, 2(2),
113–116. Retrieved from www.scopus.com.
https://doi.org/10.1177/2167479514527425.
Hutchins, B. 2014. Twitter: Follow the money and look
beyond sports. Commun. Sport, 2(2), 122–126.
Retrieved from www.scopus.com.
https://doi.org/10.1177/2167479514527430.
Kelly, L., Kerr, G., & Drennan, J. 2010. Avoidance of
advertising in social networking sites: the teenage
perspective. J. Interact. Advertising, 10(2), 16–27.
https://doi.org/10.1080/15252019.2010.10722167.
Kim, A. J., & Ko, E. 2012. Do social media marketing
activities enhance customer equity? an empirical study
of luxury fashion brand. J. Bus. Res., 65(10), 1480-
1486. https://doi.org/10.1016/j.jbusres.2011.10.014.
Mandhachitara, R., & Poolthong, Y. 2011. A model of
customer loyalty and corporate social responsibility.
J. Serv. Mark., 25(2), 122–133.
https://doi.org/10.1108/08876041111119840.
Mangold, W. G., & Faulds, D. J. 2009. Social media: the
new hybrid element of the promotion mix. Bus.
Horiz., 52(4), 357–365.
https://doi.org/10.1016/j.bushor.2009.03.002.
Manthiou, A., Chiang, L., & Liang (Rebecca) Tang, L.
2013. Identifying and responding to customer needs
on Facebook Fan Pages. Int. J. Technol. Hum.
Interact., 9(3), 36–52.
https://doi.org/10.4018/jthi.2013070103.
Martin, K., & Todorov, I. 2010. How will digital
platforms be harnessed in 2010, and how will they
change the way people interact with brands? J.
Interact. Advert., 10(2), 61–66.
https://doi.org/10.1080/15252019.2010.10722170.
Martínez, P., & Rodríguez del Bosque, I. 2013. CSR and
customer loyalty: the roles of trust, customer
identification with the company and satisfaction. Int. J.
Hosp. Manag., 35(1), 89–99.
https://doi.org/10.1016/j.ijhm.2013.05.009.
Muntinga, D. G., Moorman, M., & Smit, E. G. 2011.
Introducing COBRAs: exploring motivations for
brand-related social media use. Int. J. Advert, 30(1),
13–46. https://doi.org/10.2501/IJA-30-1-013-046.
Naaman, M., Becker, H., & Gravano, L. 2011. Hip and
trendy: characterizing emerging trends on twitter. J.
Am. Soc. Inf. Sci., 62(5), 902–918.
https://doi.org/10.1002/asi.21489.
Neti, S. 2011. Social media and it’s role in marketing. Int.
J. Enterpr. Comput. Bus. Syst.
Nguyen, N., & Leblanc, G. 2001. Corporate image and
corporate reputation in customers’ retention decisions
in services. J. Retailing Con. Serv., 8(4), 227–236.
https://doi.org/10.1016/S0969-6989(00)00029-1.
Oliver, R. L. 1999. Whence consumer loyalty? J. Mark.,
63(4), 33–44. https://doi.org/10.2307/1252099.
Retrieved from http://www.adweek.com/digital/45-social-
media-stats/.
Retrieved from
https://tekno.kompas.com/read/2018/02/22/16453177/
berapa-jumlah-pengguna-internet-indonesia.
Retrieved from
https://tekno.kompas.com/read/2018/03/01/10340027/
riset-ungkap-pola-pemakaian-medsos-orang-
indonesiaRetrieved from
https://www.theguardian.com/technology/2006/jul/20/
guardianweeklytechnologysection2
Sanderson, J. 2014. What do we do with twitter?
Commun. Sport, 2(2), 127–131.
https://doi.org/10.1177/2167479514527429.
Sano, K. 2014. Do social media marketing activities
enhance customer satisfaction, promote positive WOM
and affect behavior intention?
InvestigaçõesEff.Soc.Media Tour.Ind., 66(3–4), 45–
69. https://doi.org/10.14988/pa.2017.0000013844.
Sano, K. 2015. An empirical study the effect of social
media marketing activities upon customer satisfaction,
positive word-of-mouth and commitment in indemnity
insurance service. In Proceedings international
marketing trends conference.
Schmenner, R. W. 1986. How can service businesses
survive and prosper? Sloan Manag. Rev., 27(3), 21–
32. PubMed: 10300742.
Seo, E.J., & Park, J.W. 2018. A study on the effects of
social media marketing activities on brand equity and
customer response in the airline industry. J. Air
Transp. Manag., 66, 36–41.
https://doi.org/10.1016/j.jairtraman.2017.09.014.
Zeithaml, V. A., Berry, L. L., & Parasuraman, A. 1996a.
The behavioral consequences of service quality.
J. Mark., 60(2), 31–46.
https://doi.org/10.1177/002224299606000203.
Zeithaml, V. A., Berry, L. L., & Parasuraman, A. 1996b.
The behavioral consequences of service quality.
J. Mark., 60(2), 31–46.
https://doi.org/10.1177/002224299606000203.
Zeng, B., & Gerritsen, R. 2014. What do we know about
social media in tourism? A review. Tourism Manag.
Perspect., 10, 27–36.
https://doi.org/10.1016/j.tmp.2014.01.001.
Social Media Marketing’s Influence on Customer Loyalty: A Case Study of Siloam Hospital
265
