
Implementation of Chain Code K-Nearest Neighbor in Qalqalah
Reading
Tjut Awaliyah Zuraiyah, Mulyati and Hanan Rosyada
Departement of Computer Science Pakuan University, Bogor, Indonesia
Keywords: Chain Code, Euclidean, KNN, Qalqalah.
Abstract: This study aims to implement the Chain Code method and KNN in Qalqalah reading law. The research phase
consists of image acquisition, pre-processing, grayscale, feature extraction using chain code, classification
using k-Nearest Neighbor k-NN). On the pre-processing process is carried out with image cropping, noise
removal and normalization image size 50x25 pixels. The data used are 132 datasets which are divided into 6
test data and 126 training data (63 original data and 63 rotation data). The Chain Code method is used as a
method of recognition of image patterns based on the direction of the wind, and the KNN method is used as
an image classification method based on the difference in euclidean distance. The KNN method will search
for the closest distance from the training data to the test data so that the best K is obtained with the highest
accuracy in each class. In the validation calculation, obtained the results of accuracy image classification with
an accuracy of 45.23%. This accuracy value is quite low because the Chain Code Method cannot detect images
with separate objects so that this method cannot work optimally.
1 INTRODUCTION
Al-Quran is a holy book that is owned by the Islamic
religion, which contains various kinds of life
meanings that can be applied in human life.
Al-Quran
provides an overview of life in the world and in the
hereafter and the effects that occur both positive and
negative impacts.
So, there must be tajweed learning
so that the message can be conveyed correctly.
Almost all Muslims in the world know how to read
the Quran, but some of them cannot read the Quran
correctly according to
makhraj and tajweed. People
who want to deep in the Quran will usually ask for
help from a teacher to learn more about the
makhraj
and tajweed recitation of the Quran correctly and
adequately.
A teacher will observe every makhraj
law and tajweed that are being read, then remind the
right tajwid law and guide the reader when there is an
error in reading.
This method is less effective because
a system is needed that can be used at any time when
needed.
At present, there are several Al-Quran
learning software on the market.
The usefulness of
this software is that users can only read the Quran, but
the placement of tajwid laws is not displayed.
This
software is still less effective for readers in learning
tajwid and messages contained therein.
Therefore, a
system is needed that can detect tajwid patterns so
that readers can find out how the laws of tajwid are
read, especially the recitation of qalqalah.
Based on
the related problems, a system was created entitled
Implementation of the Chain Code and k-NN
Method in the digital image-based recitation law of
qalqalah. Where chain code functions in pattern
detection while k-NN functions in the classification
of images obtained.
The tested image will be detected
based on the direction of the wind direction in the
chain code method.
2 RESEARCH METHOD
This study uses an image processing methodology
with several stages consisting of (1) the stage of
image acquisition, which
can be defined as a system
that functions to retrieve, collect and prepare data, to
process it to produce the desired data. (2)
Pre-
processing
stage is the stage to cut the character part
needed by the image. After the cutting results are
obtained, then the
noise removal is carried out (the
part that is not needed).
After that, the image size is
50 x 25 pixels uniform
. (3) The Grayscale stage is
244
Zuraiyah, T., Mulyati, . and Rosyada, H.
Implementation of Chain Code K-Nearest Neighbor in Qalqalah Reading.
DOI: 10.5220/0010623700002967
In Proceedings of the 4th International Conference of Vocational Higher Education (ICVHE 2019) - Empowering Human Capital Towards Sustainable 4.0 Industry, pages 244-250
ISBN: 978-989-758-530-2; ISSN: 2184-9870
Copyright
c
2021 by SCITEPRESS – Science and Technology Publications, Lda. All rights reserved
changing the colour image into a
grey image scale,
this matter for simplify the image model. At this
stage, not only
Grayscale stages are used, but there
is also some other stage, namely as a binary that
works to change Grayscale
images to black and white
so that the image can be read clearly, namely
Imcomplement stage rebrand be the opposite of a
binary colour is white- black because usually, the
system can only read images with a black
background, then the Thinning
stage is the reduction
of the writing object so
that the obtained code chain
produces a short code sequence. (4) Chain Code
Method, this algorithm is formed with the aim of
representing the contours of an object.
The intended
representation includes pixels from the edges of an
object that are interconnected and have a certain
direction.
The workings of this algorithm to detect an
object is to give a rotation sign that is adjusted to the
direction of the wind that you want
to use, and (5)
Classification of KNN
is a pattern recognition stage
by comparing vector test data and vector training data
available using KNN.
Stage in this classification is to
determine the value of K, then calculate the euclidean
distance of each image for the next sort from smallest
to largest distance to get the best data by K.
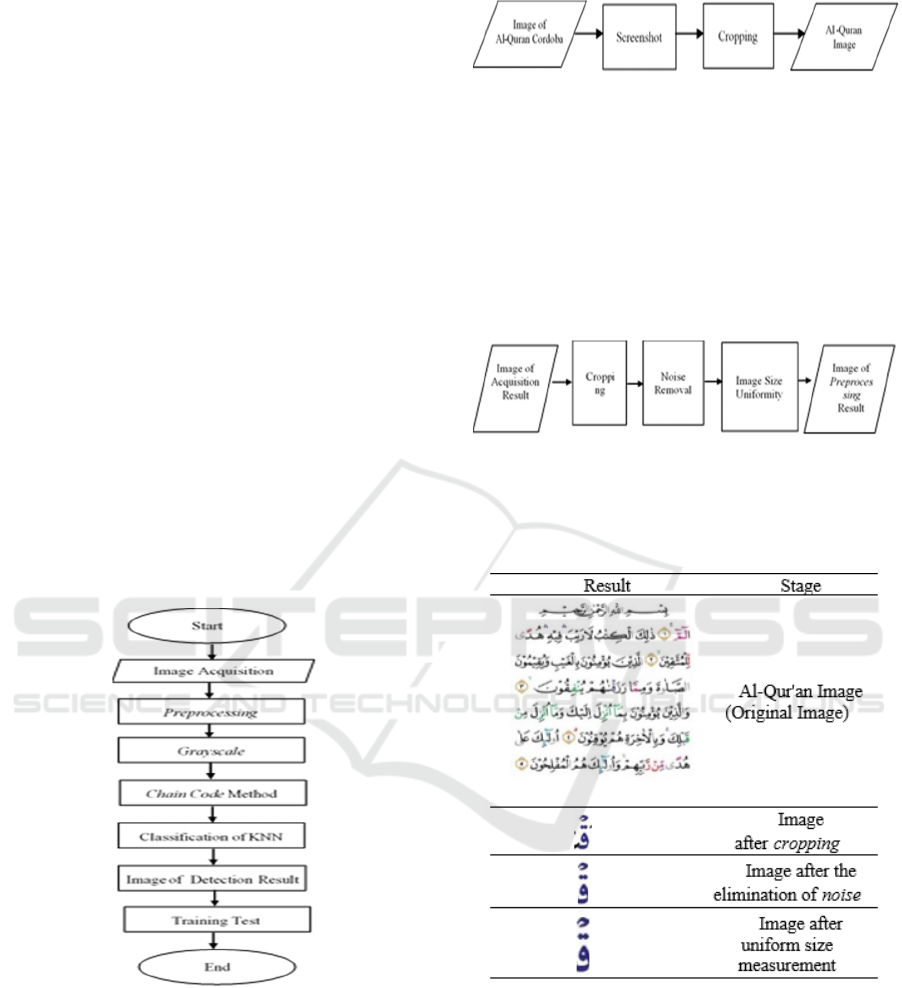
Figure 1: Flowchart Research.
2.1 Image Acquisition
Data acquisition stage can be defined as a system that
functions to retrieve, collect and prepare data, to
process it to produce the desired data.
The resulting
image is not necessarily digital data, so it needs to be
digitized.
In this study, the tool used in image capture
is using a mobile camera. The following steps are
shown in figure 2:
Figure 2: Stage Acquisition
2.2 First Section
Pre-processing stage is the stage to perform the
required cutting portion character image.
After the
cutting results are obtained, then the noise removal is
done (the part that is not needed). After that, image
size uniformity is done.
Pre-processing stage,
including in Figure
3:
Figure 3: Stage Preprocessing
This stage is shown in table 1 below:
Table 1: Pre-processing
2.3 Grayscale
The initial process many done in image processing is
to change the colour image to
grey image scale; this
is used for simplifying the image model.
At this stage, not only Grayscale stages are used,
but there is also some other stage, namely as
a binary
that works to change Grayscale images to black and
white so that the image can be read clearly, namely
Imcomplement stage rebrand be the opposite of a
Implementation of Chain Code K-Nearest Neighbor in Qalqalah Reading
245
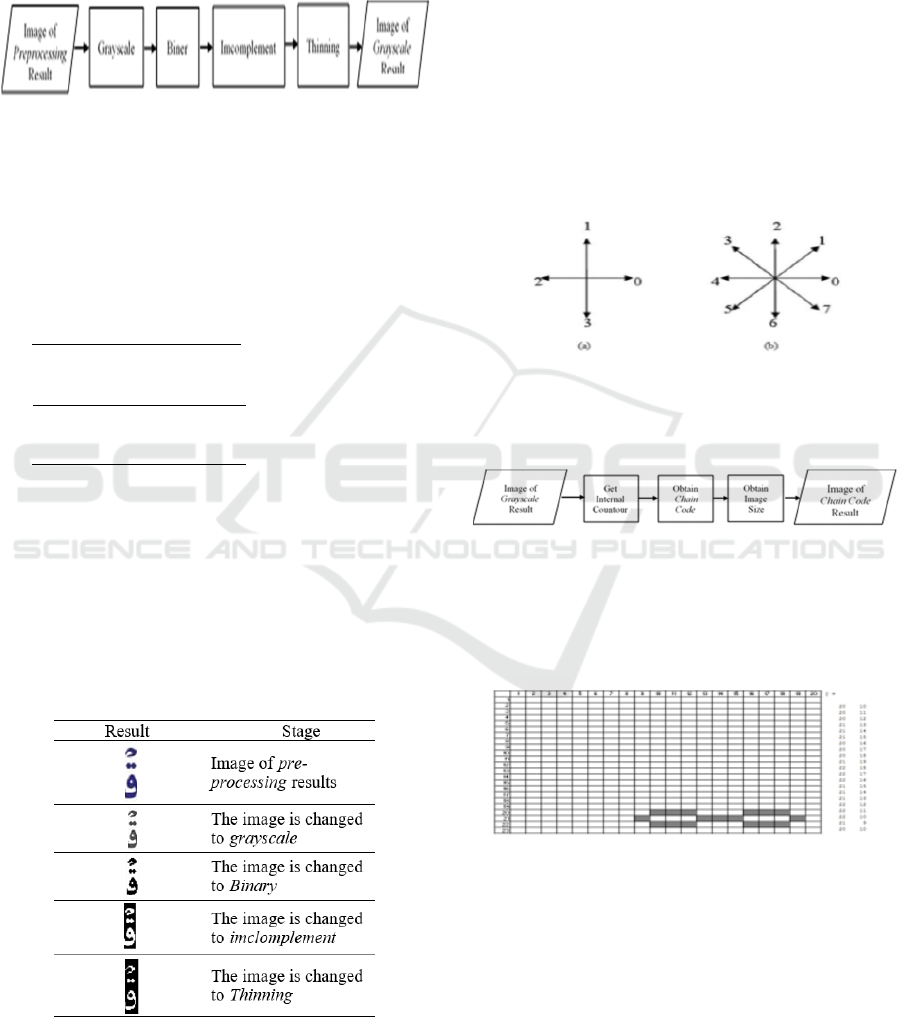
binary colour is white-black because usually, the
system can only read images with a black
background, then the Thinning
stage is the reduction
of the writing object so that the obtained code chain
produces a short code sequence.
The following are the details of the stages:
Figure 4: Stage Grayscale
The example of the manual calculation is RGB image
changes to grayscale:
The total number of RGB
= 762052
Amount of Red Value = 248906
Amount of Green Value = 247324
Amount of Blue Value = 265822
R= 248906 = 0.326626
248906+247324+265822
G= 247324 = 0.32455
248906+247324+265822
B= 265822 = 0.348824
248906+247324+265822
Grayscale
RGB Value Search (2):
Grayscale = (0.2989*R)+(0.5870*G)+(0.1141*B)
= (0.2989*0.326626)+(0.5870*0.32455)
+(0.1141*0.348824)
= 0.32794
The following is an example in table 2:
Table 2: Grayscale
2.4 Metode Chain Code
The method used in this study uses the Chain Code
method. Algorithm this is formed with the aim of
representing the contours of an object.
The intended
representation includes pixels from the edges of an
object that are interconnected and have a certain
direction.
There are two types of Chain Code, namely
in part (a) using a four-way representation and part
(b) using an eight-way representation.
Each direction
shown has different values. The numbering scheme is
applied to this method.
The workings of this
algorithm to detect an object is to give a rotation sign
that is adjusted to the direction of the wind you want
to use.
Figure 5: Representation of the wind direction on the Chain
Code
The steps taken in the Chain Code are in figure 6:
Figure 6: Stage Chain Code
Examples of manual calculations for letter
detection in the Chain Code are:
1. Get internal contours
Figure 7: Results of Internal Contour Pattern
1
This pattern 1 on fig. 7 is a point pattern on qof ( ﻕ).
While on the right is the xy coordinator point that has
been obtained by inbound tracing.
Pattern 2 on fig.8 is qaf ( ﻕ) pattern without point.
While the right is the xy coordinator point obtained
by inbound tracing
ICVHE 2019 - The International Conference of Vocational Higher Education (ICVHE) “Empowering Human Capital Towards Sustainable
4.0 Industry”
246
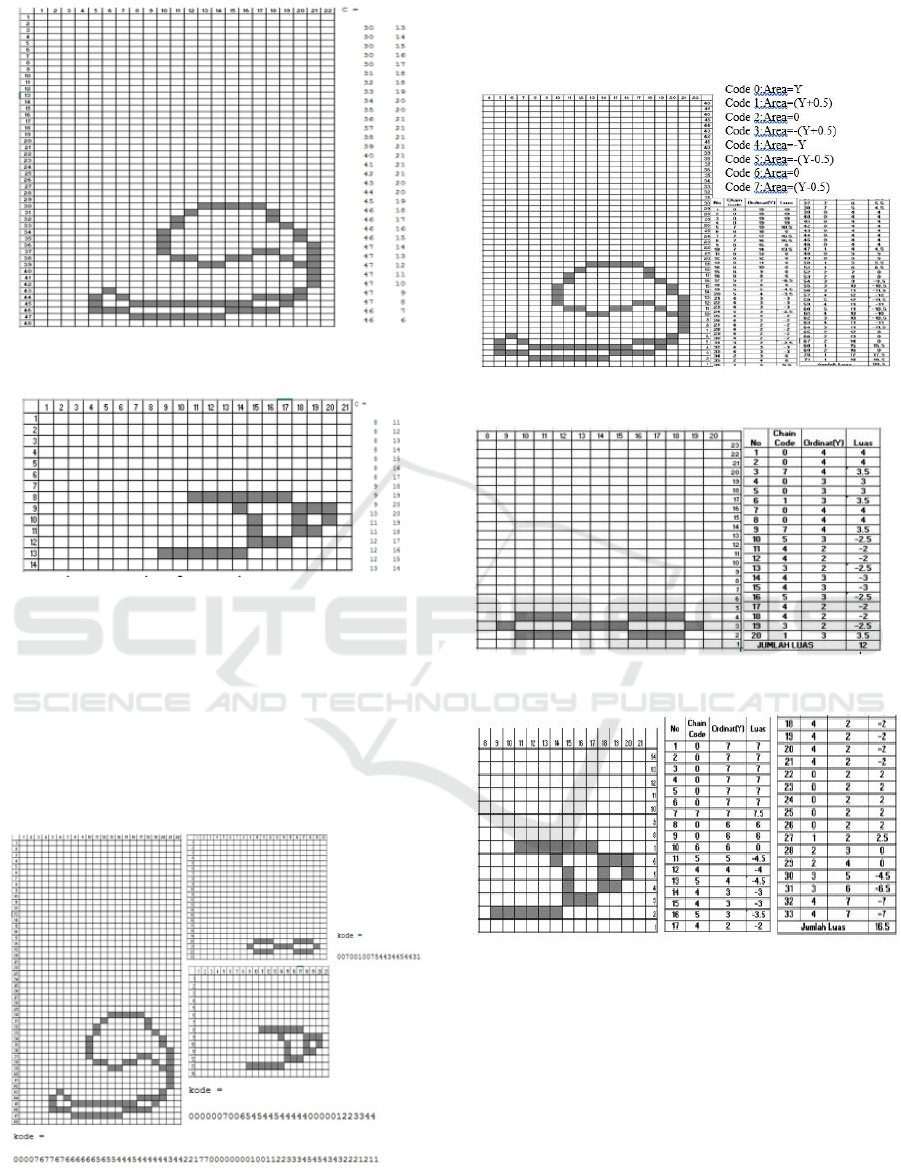
Figure 8: Results of Internal Contour of Pattern 2
Figure 9: Results of Internal Contour Pattern 3
This pattern 3 on fig. 9 is the pattern of sukun
contained in the letter Qof ( ﻕ). While on the right is
the point of coordinator xy obtained.
2. Obtain Chain Code
The value of
Chain Code is obtained from the
detection of patterns based on the direction of the
wind
Figure 10: Chain Code Results
3. Obtain Image Size through the Chain Code
The area of the image can be done with the
Chain
code method, namely by the formula
Figure 11: Area of an object on a pattern
Figure 12. Area of Object in Pattern 2.
Figure 13: Area of Object in Pattern 3
Then the total area of all patterns is 99.5 + 12 + 16.5
= 128
2.5 Knn Method
The KNN Classification stage is a pattern recognition
stage by comparing the vector of test data and vector
of available training data using KNN.
The KNN
Classification Stage is shown in Figure
14 below:
Implementation of Chain Code K-Nearest Neighbor in Qalqalah Reading
247
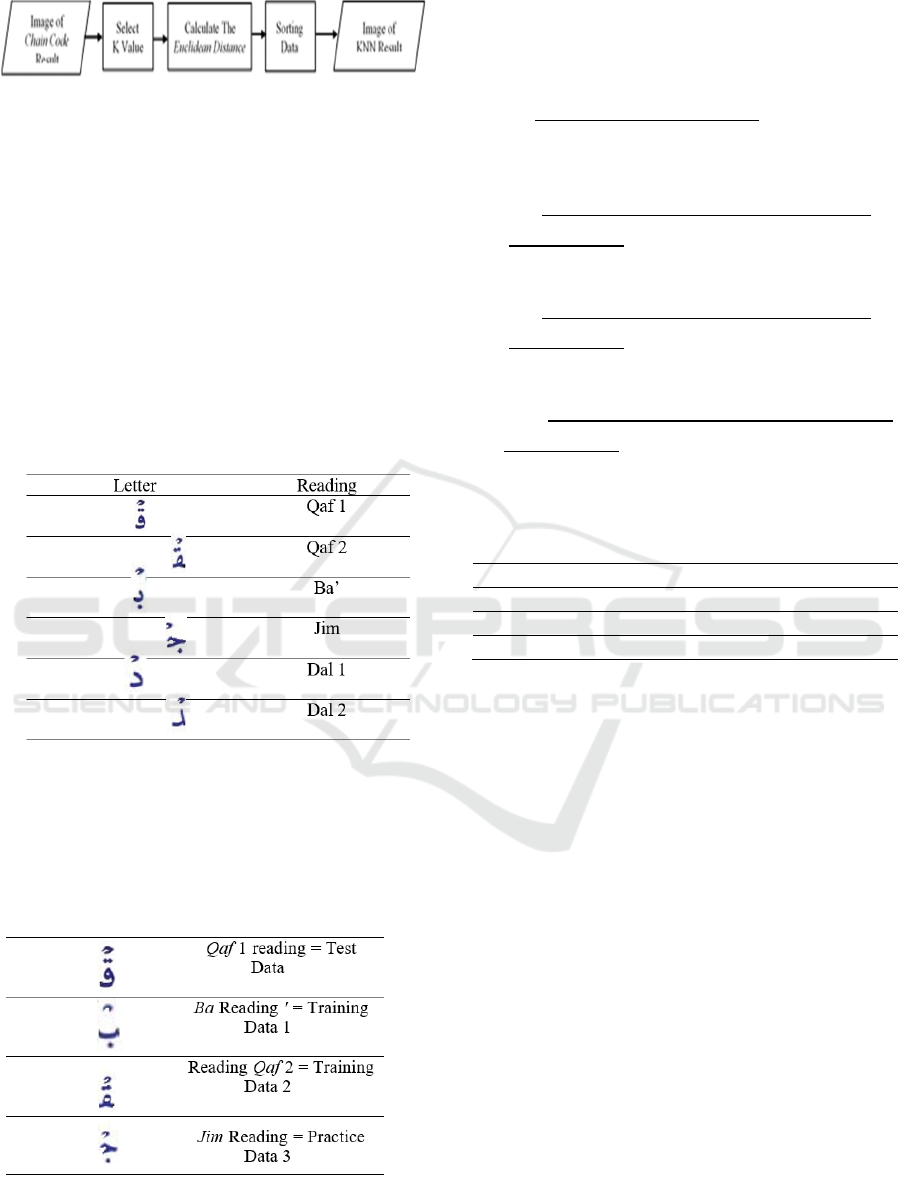
Figure 14: KNN Method
In manual calculations, the data that has been
obtained previously will be calculated using the K-
NN method to determine the quality of the data that
is owned is good enough to be able to become training
data as a basis for making the program.
In the K-NN
method to determine the class seen from the data that
has the closest distance from the calculation test
method data.
To carry out the data visualization
process in this study, 132 datasets were used, which
consisted of 126 training data (63 original data and 63
rotation data) and 6 test data—the following
classification in Table
3.
Table 3: Classification
The next step is to classify the data
testing by
calculating the square of the
euclid distance
(euclidean distance) of each object against the
training data provided. The Test Data Image is as
follows.
Table 4: Test Data and Training Data
Here's an example of the calculation:
Data = [ grayscale, area]
1. Test Data = [ 0.32794, 128]
2. Training Data 1 = [0.330697, 66]
3. Training Data 2 = [0.32956, 118]
4. Training Data 3 = [0.330695, 54.5]
Using formulas (3)
d
X
X
(1)
Training Data 1
d
0.32794 0.330697² 128 66²
=
√
3844.000008
= 62.00000006
Training Data 2
d
0.32794 0.32956² 128 118²
=
√
100.0000026
= 10.00000013
Training Data 3
d
0.32794 0.330695
128 54.5
=
√
5402.250008
= 73.50000005
The Table
5 is the detected image value
Table 5. Detected Image Value
Trainin
g
Data Tes
t
Resul
t
Value
Trainin
g
Data 1 62.00000006
Trainin
g
Data 2 10.00000013
Trainin
g
Data 3 73.50000005
Calculation results from 3 training data on 1 test data
using
Grayscale results , Image Area and Euclidean
Distance based on Chain Code , test results obtained
from the comparison of the closest distance between
test data and training data, can be seen the smallest
value of the test result value is
10.00000013 owned
by Training Data 2 (reading
Qaf 2) , which is the
closest value to the test data, it can be concluded that
Training Data 2 (reading Qaf 2) is included in the
Test Data group (Read Qaf
1), where the two data
have in common namely entering into the
classification letter Qaf 1 .
3 RESULT AND ANALYSIS
In this study the Al-Quran image used was Al-Quran
Cordoba in Surah Al-Baqarah. In this image the Pre-
processing process is carried out by image cropping,
noise elimination and uniform image size 50x25
pixels. Next is the process of changing colored cira to
Grayscale, then Binary, Imcomplement and Thinning
. The data used are 132 datasets which are divided
into 6 test data and 126 training data (63 original data
ICVHE 2019 - The International Conference of Vocational Higher Education (ICVHE) “Empowering Human Capital Towards Sustainable
4.0 Industry”
248
and 63 rotation data). The Chain Code method is used
as a method of recognition of image patterns based on
the direction of the wind and the KNN method is used
as an image classification method based on the
difference in euclidean image distance. The KNN
method will search for the closest distance from the
training data to the test data so that the best K is
obtained with the highest accuracy in each class.
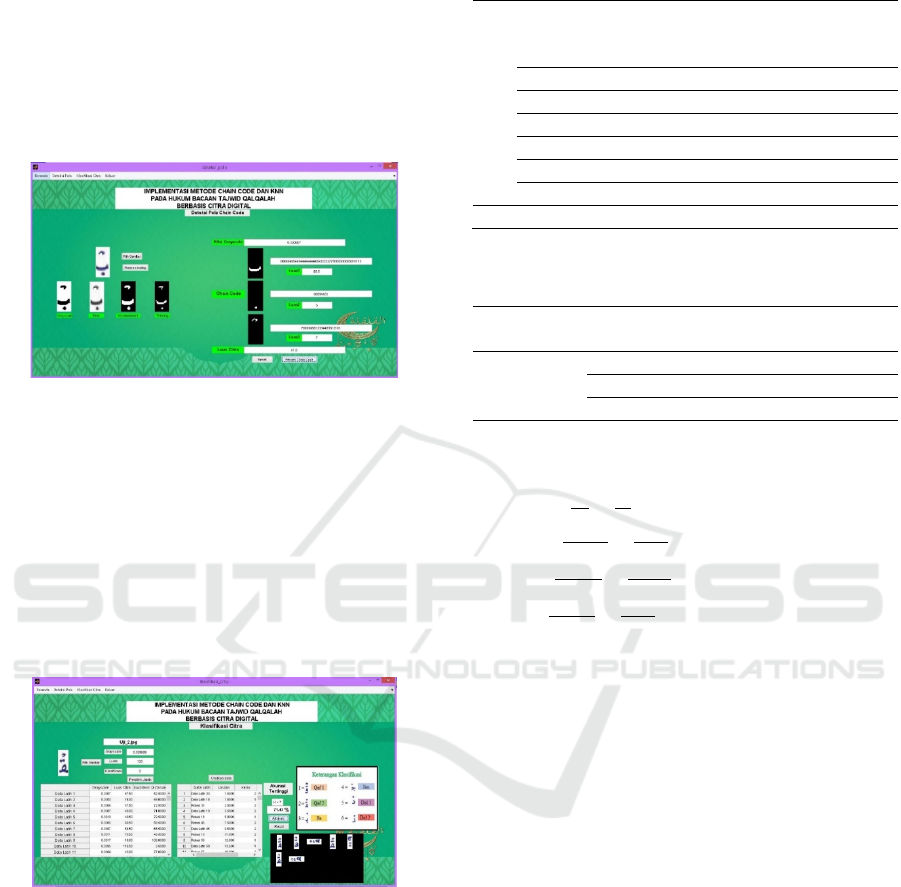
Figure 15: Display Pattern Detection using Chain Code
In Figure 15, it can be seen how the system processes
images
by detecting patterns using the Chain Code.
In this method, the image must be detected separately
in order to obtain accurate results.
This process starts
from image changes to grayscale,changes to
Grayscale to Binary, changes to binary to
Imcomplement ( negative from binary) and Thinning
(image reduction). After the image is processed, the
Chain Code value is searched to get the Area value
of the image.
Figure 16: Display of Image Classification Results
In figure 16, we can see the image classification
process in class 2 using the KNN method. This
method looks for image similarity by calculating the
closest distance between test data and training data
based on the grayscale value and the width of the
image
so that the best K value is obtained. In this
study, 6 Test data were used
and 126 training data (63
original data and 63 rotation data)
. Then obtained
must be the following accuracy:
Table 6: Test Results Image Classification Validation
Prediction
∑
Actual
Class
1
Class
2
Class
3
Class
4
Class
5
Class
6
Actual
Class 1 2 0 0 0 0 1 3
Class 2 2 5 0 0 0 0 7
Class 3 0 0 3 0 0 0 3
Class 4 0 0 1 5 6 3 15
Class 5 0 0 2 2 1 2 7
Class 6 0 0 1 2 1 3 7
∑ Prediction 4 5 7 9 8 9 42
Table 7. Summary of Confusion Matrix Image
Classification
Prediction
∑
True False
Actual
True 19 23 42
False 0 0 0
∑ 19 23 42
Accuracy level for image classification test results:
𝐴𝑘𝑢𝑟𝑎𝑠𝑖
*100% = 45.23%
𝑃𝑟𝑒𝑠𝑖𝑠𝑖
*100% = 100%
𝑅𝑒𝑐𝑎𝑙𝑙
*100% = 45.23%
𝐹𝑎𝑢𝑙𝑡
*100% = 54.77%
4 CONCLUSIONS
Based on the results of the analysis of this study, it
can be concluded that the Chain Code Method can be
used to detect patterns in images and KNN can be
used in image classification by calculating the
Euclidean distance that has been sorted. In this study,
the best accuracy results in class 3 were obtained with
100% accuracy. This study uses an image processing
methodology with several stages consisting of the
stage of image acquisition, Pre-processing stage,
Grayscale stage, Chain- Method and Classification of
KNN. There is also a design stage consisting of
general design including the structure of the
navigation and system flowchart and detailed design
consisting of the design of the veranda, the design of
pattern detection and the design of image
classification. The implementation of this system
uses the Matlab R2011a application and calculations
in Microsoft Excel. This system has carried out trials
with several stages, namely structural testing,
functional testing and validation trials. All these trials
are done so that users can use them as best as possible
Implementation of Chain Code K-Nearest Neighbor in Qalqalah Reading
249

according to their needs. In the validation calculation,
obtained results of accuracy in image classification
obtained an accuracy of 45.23%. This accuracy value
is quite low because the Chain Code Method cannot
detect images with separate objects so that this
method cannot work optimally.
ACKNOWLEDGEMENTS
Thanks are given to Kemenristek Higher Education
which has provided support in the form of grants
Doctoral Research Grant; Foundation Pakuan
Siliwangi give Doctoral Scholarship and the
University Gunadarma as the study continued.
REFERENCES
Amani,Y.; Syahputra, I.; Siddiq, D. (2018). Sistem
Pendeteksi Pola Tajwid Al-Qur’an Hukum Mad thabi’I
Menggunakan Metode Sokal & Michener. TECHSI,
10(2), 15-29
Goel, V.; Jain, T.;Singhal S.; Kole S. (2017). Specific Color
Detection in Images using RGB Modelling in
MATLAB. International Journal of Computer
Applications, 161(8), 38-42.
Kartika, I. J.; Santoso E.; Sutrisno. (2017). Penentuan Siswa
berprestasi Menggunakan Metode K-Nearest Neighbor
dan Weight Product (Studi Kasus : SMP Negeri 3
Mejayan). Jurnal Pengembangan Teknologi Informasi
dan Ilmu Komputer, 1(5), 352-360.
Naufal, A. M. (2017). Implementasi Metode Klasifikasi K-
Nearest Neighbor (K-NN) untuk Pengenalan Pola Batik
Motif Lampung. Skripsi. Jurusan Ilmu Komputer,
Fakultas Matematika dan Ilmu Pengetahuan Alam,
Universitas Lampung, Lampung.
Santi, N. C. (2011). Mengubah Citra Berwarna Menjadi
Grayscale dan Citra Biner. Jurnal Teknologi Informasi
DINAMIK, 16(1), 14-19.
Septian, D. R. (2017). Sistem Deteksi Tajwid Al-Qur’an
menggunakan Metode Ekstraksi Fitur Canny dan SVM.
Skripsi. Jurusan Ilmu Komputer, Fakultas Matematika
dan Ilmu Pengetahuan Alam, Universitas Pakuan,
Bogor.
Siska, D.; Fadillah, C. (2016). Sistem Pendeteksi Pola
Tajwid Al-Qur’an Hukum Bi-Ghunnah dan Bila-
Ghunnah Pada Citra Menggunakan Metode Nei &
Li.Techsi, 8(1), 206-214
Wijaya, T. D. V.; Novianto, S.; Rosyidah, U. (2014).
Deteksi Huruf Arab Menggunakan Metode Freeman
Chain Code. Techno.COM, 13(4), 245-250.
Zuraiyah, T. A. (2016). Optimization of Feature Extraction
Using Combined Image Centroid Zone and Zone
Centroid Zone Method. Proceeding, International
Conference on Operation Research.
Virender Ranga Nikita Yadav, Pulkit Garg. (2018).
American Sign Language Fingerspelling Using Hybrid
Discrete Wavelet Transform-Gabor Filter And
Convolutional Neural Network. Journal of Engineering
Science and Technology, 13(9), 2655-2669.
Y. Boukhari, M. N.; Boucherit, M.; Zaabat, S.; Amzert, K;
Brahimi. (2018). Optimization Of Learning Algorithms
In The Prediction Of Pitting Corrosion. Journal of
Engineering Science and Technology, 13(5), 1153-
1164.
APPENDIX
Nomenclatures
N Amount of value
Tp True Positive
Fp False Positive
Fn False Negative
d
ij
Euclidean Distance
x
test
Test Data
x
train
Training Data
Greek Symbols
Data Summary from k=1 until n
Abbreviations
KNN K- Nearest Neighbor
JESTEC Journal of Engineering Science and Technology
ICVHE 2019 - The International Conference of Vocational Higher Education (ICVHE) “Empowering Human Capital Towards Sustainable
4.0 Industry”
250
