
Fish Disease Diagnose System using Case-based Reasoning with
Euclidean Distance
Michel Farrel Tomatala, Rillya Arundaa and Handri Damodalag
Information Technology Department, STMIK Multicom Bolaang Mongondow, North-Sulawesi, Indonesia
Keywords: Case-based Reasoning, Nile Tilapia, Euclidean Distance, Fish Disease.
Abstract: Nile Tilapia fish disease has concerned the fish farmers. The farmers still lacked knowledge and information
for finding the appropriate solution to prevent or cure the disease, and this situation caused the deficiency of
Nile Tilapia fish harvest, which caused financial loss. Thus, it is necessary to find a suitable application as a
medium of consultancy to diagnose the disease symptoms that affect Nile Tilapia fishes. Case-Based
Reasoning (CBR) is one of the methods that can solve the problem by making a new Decision Support System
(DCS) by referring to the old cases which have similarities or even the same cases like the new DCS. The
system which is made in this study is the CBR system to diagnose Nile Tilapia disease by using Euclidean
Distance Method. The number of based-cases which are used for this study is 40 old cases that are analyzed
by using 40 new cases. System testing has been done three times by using Threshold 1, 2, and 3. The
Threshold testing 1, 2, and 3 fell in the scores of 100%, 100% and 100% respectively. As a result, this study
provides a useful application for Nile Tilapia fish farmers to prevent and cure fish disease.
1 INTRODUCTION
Nile Tilapia is freshwater fish which is said to be
originally coming from East Africa around 1969. Its
lateen name is Oreochromis Niloticus. Nile Tilapia is
commonly consumed by people around the world
(Kottelat et al., 1993). Nile Tilapia can be affected by
the fish disease, and if this disease is not treated
appropriately, the effect could be fatal such as causing
the fish to die and make the fish farmers suffer
significant financial loss due to deficiency of the fish
harvest. The issue was when those Nile Tilapia fishes
were affected by the disease, most of the fish farmers
still did not know how to find appropriate information
in order to find a proper solution to cure the disease.
If the fish farmers were going to find and meet the
Nile Tilapia experts directly in order to consult the
fish disease, their Nile Tilapia fishes which were
already affected might die at the time they were
consulting. This habit caused more time and even
gave a worse outcome (Chitmanat et al., 2016).
Fortunately, the fish farmers could use the
technology to find proper information about how to
prevent and cure the Nile Tilapia fish disease.
Information medium is necessary in order to help the
process of consultancy which are based on the
dependable expert system. By using Case-Based
Reasoning (CBR) application that uses the Euclidean
Distance Method, this study is expected to give a
proper and beneficial solution for the fish farmers in
preventing and curing the Nile Tilapia fish disease.
2 LITERATURE REVIEW
Case-Based Reasoning (CBR) is one of the most
successful techniques among knowledge-based
systems in various types of problem domains. CBR
previously came from researches which are related to
cognitive science. In 1997, Schank and Abelson
proposed CBR for the first time. They proposed that
human’s general knowledge about a particular
situation is recorded in the brain as a script that allows
us to set up an expectation and perform inference
(Watson, 1997). CBR is highly regarded as a
plausible high-level model for cognitive processing.
It was focused on problems such as how people learn
a new skill and how they generate hypotheses about a
new situation based on their past experiences (Pal and
Shiu, 2003). According to Aamodt et al. (1994), CBR
consisted of four stages. They are Retrieve, Reuse,
Revise and Retain. There is case representation in a
Farrel Tomatala, M., Arundaa, R. and Damodalag, H.
Fish Disease Diagnose System using Case-based Reasoning with Euclidean Distance.
DOI: 10.5220/0010622500002967
In Proceedings of the 4th International Conference of Vocational Higher Education (ICVHE 2019) - Empowering Human Capital Towards Sustainable 4.0 Industry, pages 215-221
ISBN: 978-989-758-530-2; ISSN: 2184-9870
Copyright
c
2021 by SCITEPRESS – Science and Technology Publications, Lda. All rights reserved
215
CBR system which aims to describe the problems and
the solutions to solve the problems. In a CBR system,
the new case is compared to the old case which was
saved in a database system. Then, the system will
calculate the level of appropriateness or agreement
between the old case and the new case (Aamodt and
Plaza, 1994). The particular attributes that will be
used as a standard of comparison are the information
of every case, whether it is the old or new case (Ji et
al., 2010). The information can be the symptoms and
types of disease. This information is taken from the
database to count the proximity or distance value.
This calculation is to measure the similarity between
the data-items and the distance between the two
objects. Euclidean distance is an approach which is
commonly used for measuring two vectors (Merigo
and Casanovas, 2011). This study measures the
distance proximity value between the new and old
cases which were previously happened by using
Euclidean Distance.
3 RESEARCH METHOD
This section aims to elaborate on several methods
which are used to solve the research problems of this
study. Those methods are explained below:
3.1 Data Gathering Techniques
The data findings are obtained directly from the
research objects and the available references. The
approaches which are used to gather the data are:
This method was done by directly visiting the
research field, which was the office of the Department
of Fisheries and Marine at Kotamobagu and
consulting with the Nile Tilapia fish experts.
3.1.1 Library Study
This study was done by gathering and researching
documents such as published journals and books. The
included reference have correlations with the topic of
this study.
3.2 Data Collection Method
The financial lost which had been often faced by the
fish farmers were mostly caused by the lack of
information related to Nile Tilapia fish disease. This
problem could be solved by having a consultation
system which is specifically designed to help the fish
farmers to gain more reliable information related to
Nile Tilapia fish disease. The system which is made
for this study aims to diagnose and give useful
suggestion to treat the Nile Tilapia fishes, which are
infected by the disease. The admin of the system
plays a role as the one who inputs the master data into
the application, and the users are the Nile Tilapia fish
farmers. The users are the parties who diagnose the
disease by inputting the symptoms into the
application.
3.2.1 Document Study
This study data is the data of Nile Tilapia fish disease
which were listed and given by the Nile Tilapia fish
experts who works at the Department of Fisheries and
Marine of Kotamobagu city. The data has been
specified and taken from all of the documents. Next,
they were inputted on the department’s database from
2017 to 2018. The examples of the data are presented
below in Table 1.
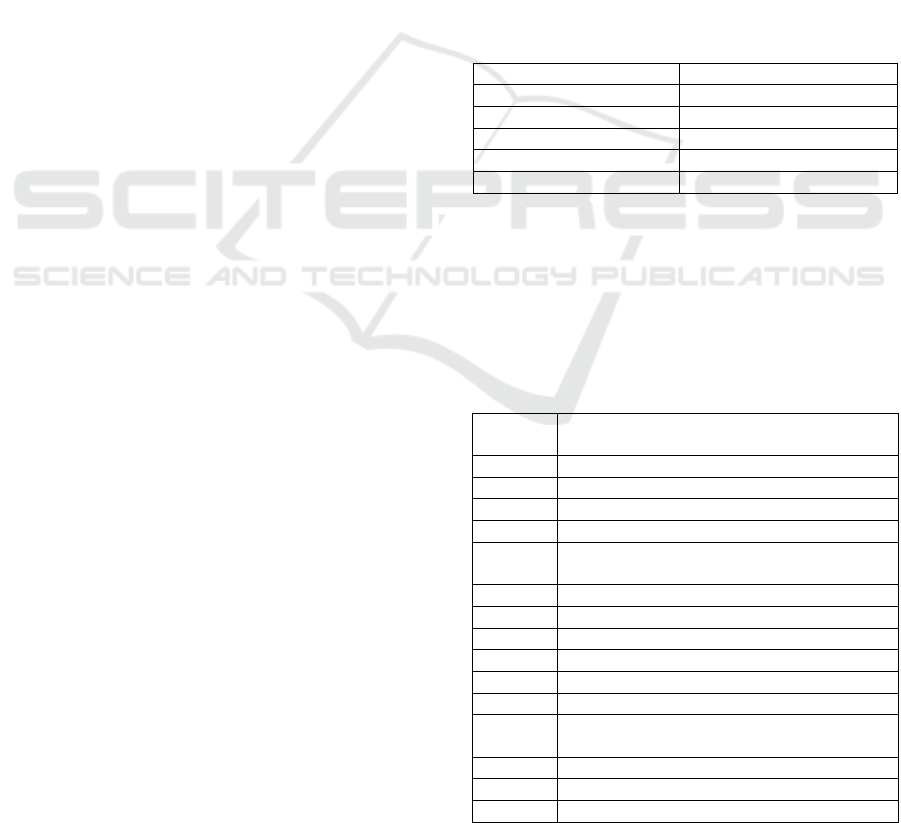
Table 1: Fish Disease.
Disease Code Disease Name
D01 Trichodina s
pp
D02 Epistylis spp
D03 Saprolegniasis
D04 Red Stain
D05 Notonecta
Table 1 proposes the data which was gotten from the
Department of Fisheries and Marine of Kotamobagu.
This data shows that there are five types of diseases.
The following data is the symptoms which are
appeared in the Nile Tilapia fish. The data is shown
below in Table 2.
Table 2: Data of Symptoms
Symptom
Code
Symptom Name
S01 Scars in the area which are infecte
d
S02 White yarns are found on the fish’ skin
S03 The fish’ gill becomes brownish re
d
S04 The fish seems to breathe hardl
y
S05
The fish’ movement becomes slower than
usual
S06 The fish experiences stunted growth
S07 There is bleeding in the fish’ skin
S08 The fish’ scales are
p
eelin
g
off
S09 The fish’ stomach becomes bloate
d
S10 There are ulcers on the fish’ skin
S11 The fish looks wea
k
S12
The fish is often seen on the surface of the
p
on
d
S13 There are white spots like rice on the fish’ skin
S14 There are white yarns around the fish’ bod
y
S15 There are red spots on the fish’ skin
ICVHE 2019 - The International Conference of Vocational Higher Education (ICVHE) “Empowering Human Capital Towards Sustainable
4.0 Industry”
216
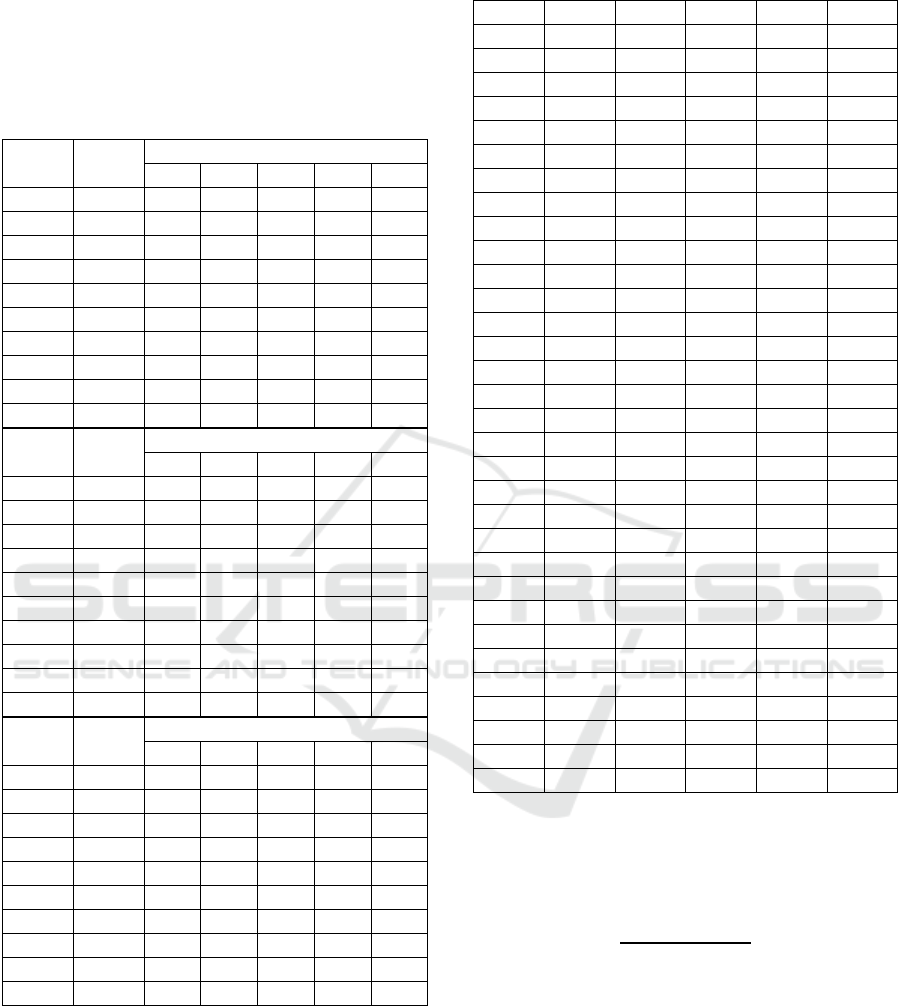
Table 2 shows the symptoms of the disease, which
usually affect Nile Tilapia Fishes. The case
representation of every disease and symptom are
shown in Table 1 and Table 2. They are clarified in
Table 3 below.
Table 3: Case-Based Data.
C D
S
1 2 3 4 5
C1 D1 1 1 0 0 0
C2 D2 0 1 1 1 1
C3 D3 0 0 0 0 0
C4 D4 0 0 0 0 0
C5 D5 0 0 0 0 0
C6 D1 0 1 0 0 0
C7 D2 0 0 0 1 1
C8 D3 0 0 0 0 0
C9 D4 0 0 0 0 0
C10 D5 0 0 1 0 0
C D
S
6 7 8 9 10
C1 D1 0 0 0 0 0
C2 D2 0 0 0 0 0
C3 D3 1 1 1 1 0
C4 D4 0 0 0 0 0
C5 D5 0 0 0 0 0
C6 D1 0 0 0 0 0
C7 D2 0 0 0 0 0
C8 D3 0 1 0 0 1
C9 D4 0 1 1 0 0
C10 D5 0 0 0 0 0
C D
S
11 12 13 14 15
C1 D1 0 0 0 0 0
C2 D2 0 0 0 0 0
C3 D3 0 0 0 0 0
C4 D4 1 1 0 0 1
C5 D5 0 0 1 1 0
C6 D1 0 0 0 0 0
C7 D2 0 0 0 0 0
C8 D3 0 0 0 0 0
C9 D4 1 1 0 0 0
C10 D5 0 0 1 0 0
Notes: S=Symptoms, C=Case, D=Disease
Table 3 has shown the ten cases which are taken as
the case-based for CBR in the process of diagnosing
the Nile Tilapia fish disease. Next, this section
provides new case-based data that will be measured
by measuring its proximity value with the old case-
based data. The data is shown in Table 4 below.
Table 4: New Case-Based Data.
C 1 2 3 4 5
B1
0 0 0 0 0
B2
1 0 0 0 0
B3
0 1 0 0 0
B4
0 0 1 0 0
B5
0 0 0 1 0
B6
0 0 0 0 0
B7
0 0 0 0 1
B8
0 0 0 0 1
B9
0 0 0 0 0
B10
0 0 0 0 0
C678 9 10
B1
0 0 0 0 0
B2
0 0 0 0 0
B3
0 0 0 0 0
B4
0 0 0 0 0
B5
0 0 0 0 0
B6
0 0 0 0 1
B7
0 0 0 0 0
B8
0 0 0 0 0
B9
0 0 0 0 0
B10
0 0 0 0 0
C111213 14 15
B1
0 0 0 0 1
B2
0 0 0 0 0
B3
0 0 0 0 0
B4
0 0 0 0 0
B5
0 0 0 0 0
B6
0 0 0 0 0
B7
0 0 0 0 0
B8
0 0 0 0 0
B9
0 1 0 0 0
B10
1 1 0 0 0
3.2.2 Euclidean Distance Method
Euclidean distance is a method that computes the root
of the square difference between the coordinates of a
pair of objects
.
𝐷𝑖𝑠𝑡
𝑋𝑌
∑
𝑋
𝑖𝑘
𝑋
𝑗𝑘
2𝑚
𝑘1
(1)
Notes:
Dist
XY
= dissimilarity degree
m = numbers of vectors
X
jk
= input vector
X
ik
= output vector
k = the attribute which represents each vector
X
jk
and X
ik
Fish Disease Diagnose System using Case-based Reasoning with Euclidean Distance
217
A metric function or distance function is a function
which defines a distance between elements/objects of
a set. A set with a metric is known as metric space.
This distance metric plays a vital role in clustering
techniques. The numerous methods are available for
clustering techniques. Typically, the task is to define
a function similarity (X, Y), where X and Y are two
objects or sets of a particular class, and the value of
function represents the degree of “similarity”
between the two. Formally, a distance function is a
function with positive real values, defined on the
Cartesian product X x X of a set X (Goncalves et al.,
2014).
d(i,j)=
|𝑋
𝑖1
𝑋
𝑗1
|
2
|𝑋
𝑖2
𝑋
𝑗2
|
2
⋯|𝑋
𝑖𝑝
𝑋
𝑗𝑝
|
2
(2)
Notes:
d(i,j) = Euclidean Distance
X
i
= value point 1
X
j
= value point 2
When we use the function of Euclidean Distance
for comparing the distance, it is unnecessary to
calculate the second root because the distance is
always positive numbers. An important component in
the algorithm cluster measures the distance among
each data point. If the data component is a part of the
same unit, the simple Euclidean Distance only is
capable enough for similar grouping data (Singh et
al., 2013).
3.2.3 Accuracy Measurement
In this study, the testing is done by comparing the
measurement result manually by using the Euclidean
Distance Method with the measurement result, which
used CBR application through accuracy
measurement. Accuracy value describes true
presentation from the total of cases which are tested
(Baratloo et al., 2015). The accuracy measurement
can be seen in Equation (3).
Accuracy =
X 100% (3)
3.2.4 Measurement by using Euclidean
Distance Algorithm
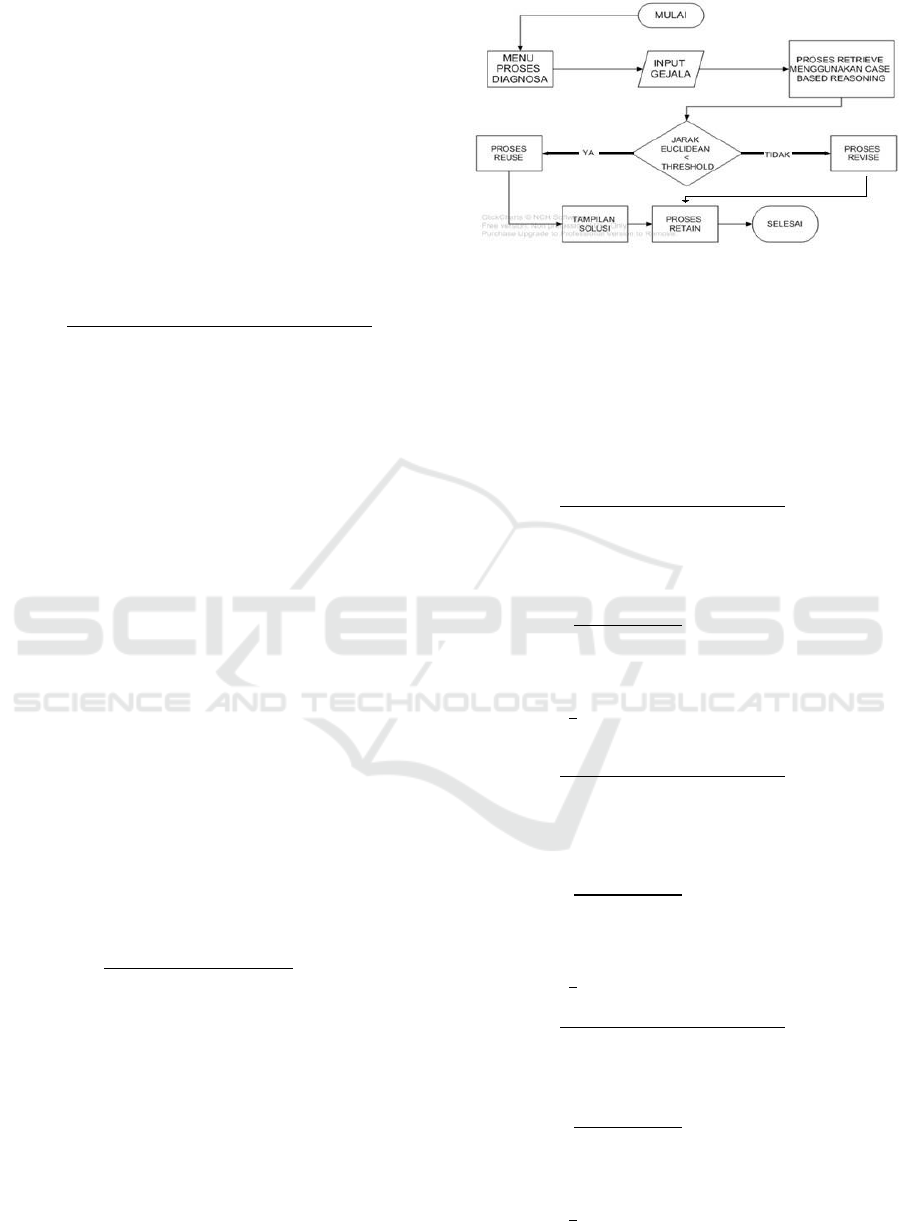
The detail of the CBR mechanism system by using
Euclidean distance can be seen in Figure 1 below.
Figure 1: CBR Mechanism System by using Euclidean
Distance.
Based on the data in previous Table and Table 4, the
measurement by using Euclidean Distance algorithm
for measuring new cases and old cases were begun by
measuring the case B1 in Table 4 with all cases in
Table 3. The equations below are examples of
measurements which used Equation (2):
The Measurement of Case B1 with the case C1 is explained below:
d(B1,C1) =
⎷
⃓
⃓
⃓
⃓
⃓
⃓
⃓
⃓
⃓
01
01
00
00
00
00
00
00
00
00
00
00
00
00
00
=
1100
0000
0000
001
=
√
31.732
The Measurement of Case B1 with the case C2 is explained below:
d(B1,C2) =
⎷
⃓
⃓
⃓
⃓
⃓
⃓
⃓
⃓
⃓
00
00
01
01
01
01
00
00
00
00
00
00
00
00
10
=
0011
1100
0000
001
=
√
5
2.236
The Measurement of Case B1 with the case C3 is explained below:
d(B1,C3) =
⎷
⃓
⃓
⃓
⃓
⃓
⃓
⃓
⃓
⃓
00
01
00
00
00
00
00
00
00
00
00
00
00
00
10
=
0100
0000
0100
001
=
√
3
1.732
ICVHE 2019 - The International Conference of Vocational Higher Education (ICVHE) “Empowering Human Capital Towards Sustainable
4.0 Industry”
218
The Measurement of Case B1 with the case C4 is explained below:
d(B1,C4) =
⎷
⃓
⃓
⃓
⃓
⃓
⃓
⃓
⃓
⃓
00
00
00
00
00
00
01
01
01
01
01
01
00
00
10
=
0000
0011
1111
001
=
√
72.645
The Measurement of Case B1 with the case C5 is explained below:
d(B1,C5) =
⎷
⃓
⃓
⃓
⃓
⃓
⃓
⃓
⃓
⃓
00
00
01
00
00
00
00
00
00
00
00
00
01
01
11
=
0010
0000
0000
110
=
√
31.732
The Measurement of Case B1 with the case C6 is explained below:
d(B1,C6) =
⎷
⃓
⃓
⃓
⃓
⃓
⃓
⃓
⃓
⃓
00
01
00
00
00
00
00
00
00
00
00
00
00
00
10
=
√
010000000000001
=
√
2
1.414
The Measurement of Case B1 with the case C7 is explained below:
d(B1,C7) =
⎷
⃓
⃓
⃓
⃓
⃓
⃓
⃓
⃓
⃓
00
00
00
01
01
00
00
00
00
00
00
00
00
00
10
=
0001
1000
0000
001
=
√
3
1.732
The Measurement of Case B1 with the case C8 is explained below:
d(B1,C8) =
⎷
⃓
⃓
⃓
⃓
⃓
⃓
⃓
⃓
⃓
00
01
00
00
00
00
00
00
00
01
00
00
00
00
10
=
0000
0000
0100
001
=
√
21.414
The Measurement of Case B1 with the case C9 is explained below:
d(B1,C9) =
⎷
⃓
⃓
⃓
⃓
⃓
⃓
⃓
⃓
⃓
00
01
00
00
00
00
01
01
01
00
01
01
00
00
10
=
0000
0011
1011
001
=
√
6
2.449
The Measurement of Case B1 with the case C10 is explained
below:
d(B1,C10) =
⎷
⃓
⃓
⃓
⃓
⃓
⃓
⃓
⃓
⃓
00
00
00
00
00
00
00
00
00
00
00
00
01
01
11
=
0000
0000
0000
110
=
√
2
1.414
Based on the measurements which are done
manually by using Euclidean Distance toward the
new cases B1 with the old cases in Table 3 which are
C1 to C10, it can be concluded that new cases have
similarities with case 1 (C10) with the distance 1.4. It
means the available solution for C10 can be reused,
and the proper diagnose for Nile Tilapia disease can
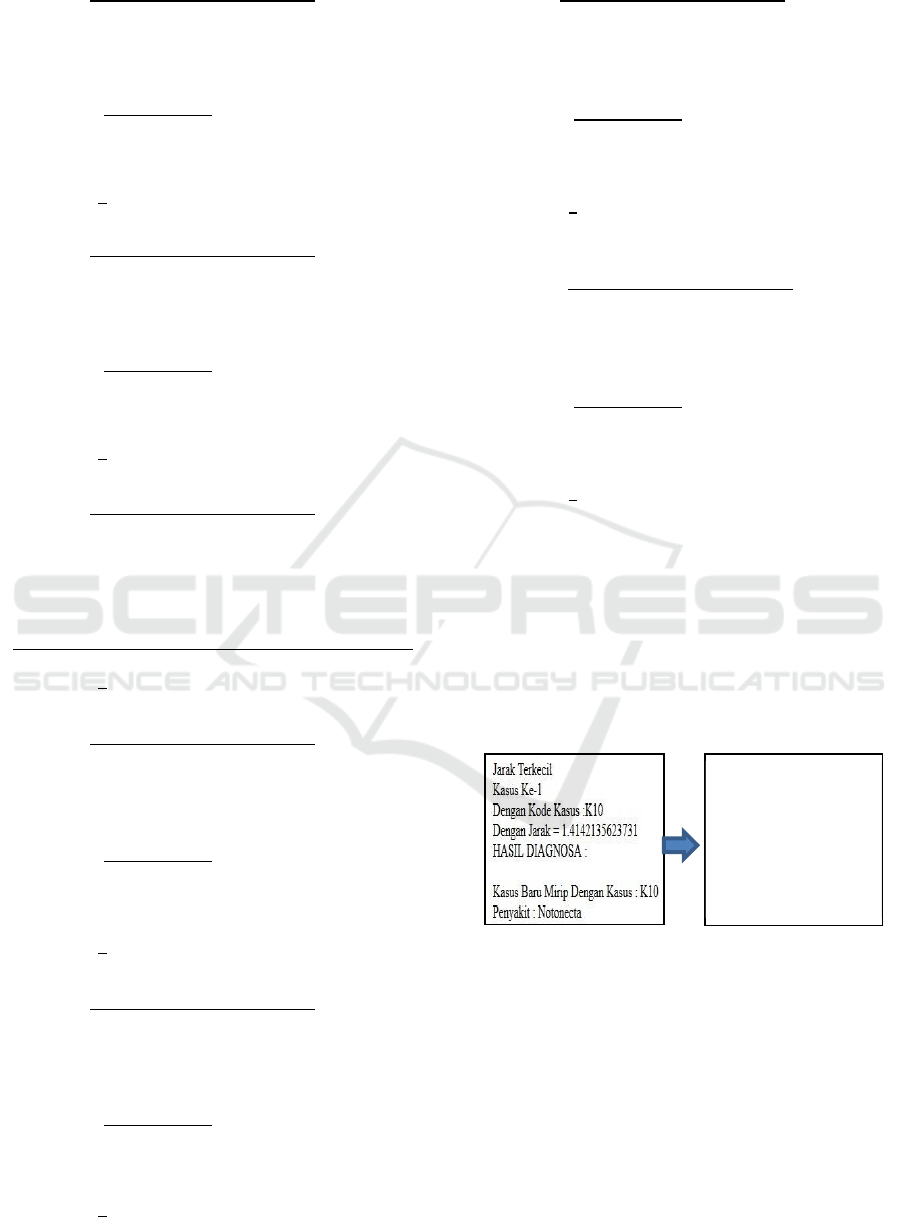
be acquired. The view of CBR application using
Euclidean Distance can be seen in Figure 2 below.
Figure 2:Diagnose result using CBR Euclidean Distance.
From the example of measurement method using
Euclidean Distance towards the new case B1, the new
case B2 to B10 could be measured as well. The final
measurement, which shows each proximity value of
new cases, is shown in Table 5 below.
Smallest distance
Case – 1
With Case Code: C10
With Distance =
1.4142135623731
DIAGNOSE
RESULT:
Fish Disease Diagnose System using Case-based Reasoning with Euclidean Distance
219
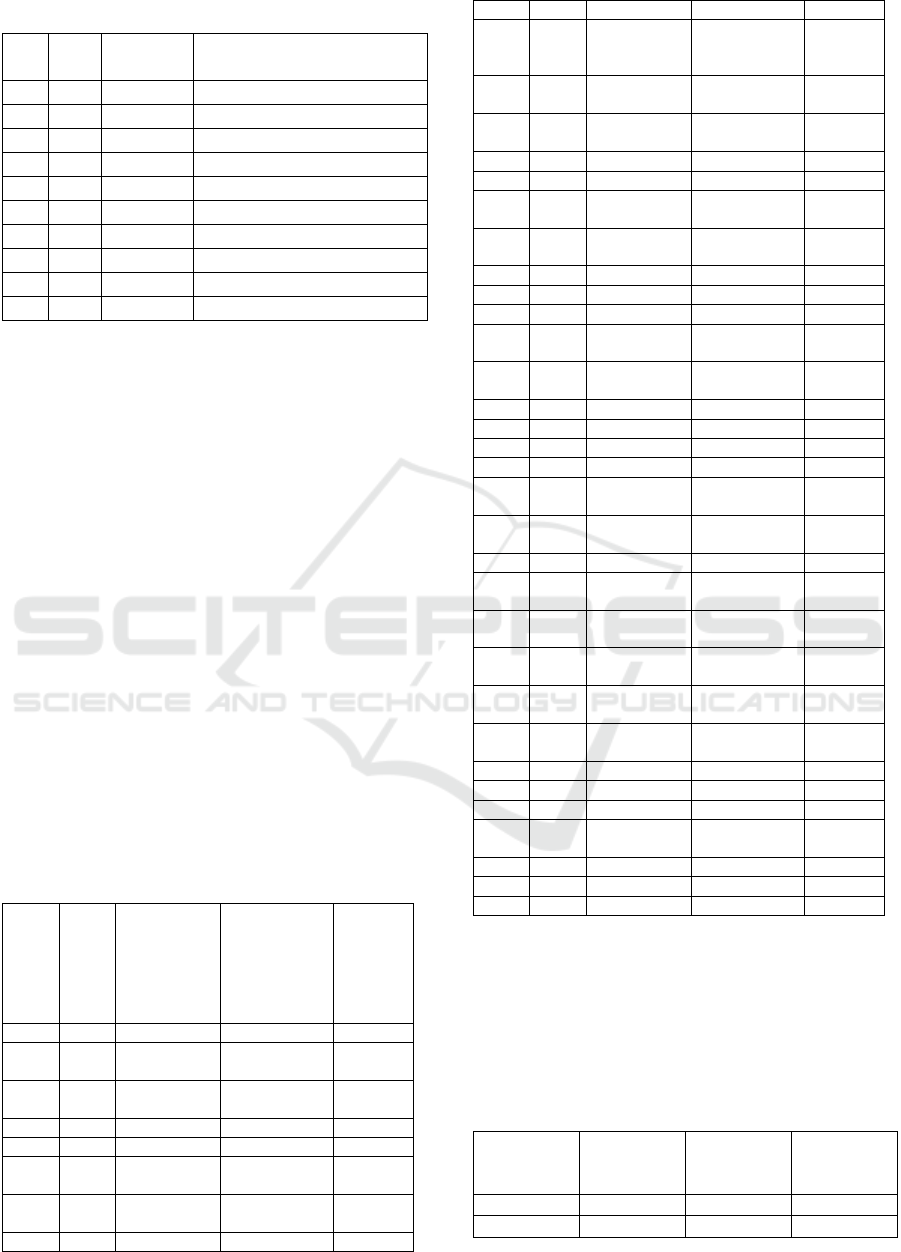
Table 5: Result of Case B1 to B10
No B Distance Similarity (Proximity
Value) with Old Cases
1
B1 1.4 C10
2
B2 1 C1
3
B3 0 C6
4
B4 1.4 C6
5
B5 1 C7
6
B6 0 C8
7
B7 1 C7
8
B8 1.4 C6
9
B9 1.4 C6
10
B10 1.7 C6
The data in Table 5 shows new cases B1 to B10,
where the smallest distance in new cases B3 and B6
fell in score 0.
4 FINDINGS
System testing has been done to know the system
accuracy to diagnose fish disease. It also aims to test
and check whether the work process of the system is
already suitable with the master design or not (Koo et
al., 2010). The system testing is done by checking the
diagnosis result system where 40 cases are used as the
testing data. The testing process is done by using
three different thresholds which are 1, 2, and 3.
In the accuracy system, 38 appropriate cases are
divided by whole 40 cases. Then, the result showed
that the accuracy level fell by 95%. For the
comparison between the expert measurement and the
application by using Threshold 2 could be seen in
Table 6.
Table 6: The Comparison between the Manual and
Application Diagnose Result.
No
Symptoms
Diagnose
Result
(Expert)
Diagnose
Result
(Application)
Note
1 S15 Red Spo
t
Red Spo
t
Suitable
2 S1
Trichodina
spp
Tricodina spp Suitable
3 S2
Tricodina
spp
Tricodina spp Suitable
4 S3 Nononecta Nononecta Suitable
5 S4 Nononecta Nononecta Suitable
6 S10
Saprolegnia
sis
Saprolegniasi
s
Suitable
7 S5
Epistylis
spp
Epistylis spp Suitable
8 S6 Notonecta Notonecta Suitable
9 S12 Notonecta Notonecta Suitable
10
S11
and
S12
Notonecta Notonecta Suitable
11 S3
Epistylis
spp
Epistylis spp Suitable
12 S5
Epistylis
spp
Epistylis spp Suitable
13 S9 Red Spo
t
Red Spo
t
Suitable
14 S11 Red Spo
t
Red Spo
t
Suitable
15 S10
Saprolegnia
sis
Saprolegniasi
s
Suitable
16 S1
Trichodina
spp
Trichodina
spp
Suitable
17 S13 Notonecta Notonecta Suitable
18 S14 Notonecta Notonecta Suitable
19 S15 Red Spo
t
Red Spo
t
Suitable
20 S2
Trichodina
spp
Notonecta
Unsuitab
le
21 S6
Epistylis
spp
Epistylis spp Suitable
22 S8 Red Spo
t
Red Spo
t
Suitable
23 S9 Red Spo
t
Red Spo
t
Suitable
24 S12 Red Spo
t
Red Spo
t
Suitable
25 S13 Notonecta Notonecta Suitable
26 S6
Epistylis
spp
Epistylis spp Suitable
27 S5
Epistylis
spp
Epistylis spp Suitable
28 S10 Notonecta Notonecta Suitable
29 S15
Epistylis
spp
Epistylis spp Suitable
30 S3
Trichodina
spp
Trichodina
spp
Suitable
31 S1
Trichodina
spp
Trichodina
spp
Suitable
32 S2
Trichodina
spp
Trichodina
spp
Suitable
33 S10
Saprolegnia
sis
Saprolegniasi
s
Suitable
34 S11 Red Spo
t
Red Spo
t
Suitable
35 S12 Red Spo
t
Red Spo
t
Suitable
36 S13 Notonecta Notonecta Suitable
37 S2
Trichodina
spp
Notonecta
Unsuitab
le
38 S4 Notonecta Notonecta Suitable
39 S8 Red Spo
t
Red Spo
t
Suitable
40 S12 Red Spo
t
Red Spo
t
Suitable
Table 6 shows the testing system by using
threshold two which resulted in 100% similarity
while the testing system. The system used threshold 1
and 3 and implemented the same process as threshold
2. All testing of threshold 1, 2 and 3 can be seen in
Table 7 as the table, which also shows the
measurement result.
Table 7: Measurement Result of Threshold 1, 2 and 3
Threshold
The Total
of Cases
The Total
of Suitable
Cases
Percentage
Result
T1 40 39 97,5%
T2 40 38 95%
ICVHE 2019 - The International Conference of Vocational Higher Education (ICVHE) “Empowering Human Capital Towards Sustainable
4.0 Industry”
220

T3 40 39 97,5%
We can see in Table 7 that the testing system using
threshold 1, 2 and 3 are scored 97.5% for threshold 1,
95% for threshold 2, and 97.5 for threshold 3.
5 CONCLUSION AND
RECOMMENDATION
5.1 Conclusion
Based on this study’s finding, which elaborated the
application that uses CBR with Euclidean Distance
Method to diagnose the disease of Nile Tilapia fish,
we can conclude that:
1. The system can diagnose the disease by
referring to the symptoms and then giving the
solution based on the type of disease which is
determined by the symptoms.
2. The system gives the diagnosis based on the
similarities (proximity level) between old cases
and new cases. The diagnoses can be
categorized as “similar” if the distance value is
< 1.5.
3. The system was tested three times by using
threshold 1, 2, and 3. The testing scored 100%
for threshold 1, 100% for threshold 2, and 100%
for threshold 3.
5.2 Recommendation
The recommendations from this study for further
researches are:
1. The CBR system in this study is still an offline
application. It is recommended for future
researchers to implement this system in their
online application. Therefore, this system could
be accessed anywhere and anytime.
2. The process of locating the distance can be
developed by using similarity method, or by
combining Minkowski distance along with
manhattan distance and Euclidean distance in
order to get more complex system.
REFERENCES
Aamodt, A., dan Plaza, E., 1994, Case-Based Reasoning:
Foundational Issues, Methodological Variations, and
System Approaches, Journal of AI Communication IOS
Press, 7, 1, 39-59.
Baratloo, A., Hosseini, M., Negida, A., & Ashal, G. E. Part
1: Simple Definition and Calculation of Accuracy,
Sensitivity and Specificity. Emergency 2015: 2. 48-49.
Chitmanat, C., Lebel, P., Whangchai, C., Promya, J. &
Lebel, L. 2016. Tilapia diseases and management in
river-based cage aquaculture in northern Thailand.
Journal of Applied Aquaculture. 28. 9-16.
https://doi.org/10.1080/10454438.2015.1104950
Daniel N. S. Goncalves, Carolinne Goncalves, Tassia Assis,
Marcelino da Silva. Analysis of the difference between
the Euclidean distance and the actual road distance in
Brazil. Transportation Research Procedia 3 (2014)
876-885.
Ji, Sae-Hyun, Park, Moonseo, Lee, Hyun-Soo and You-
Yoon, You-Sang. 2010. The similarity measurement
method of case-based reasoning for conceptual cost
estimation. Proceeding of International Conference on
Computing in Civil and Building
Koo, C, Hong, T., Hyun, C., & Koo, K. 2010. A CBR-based
hybrid model for predicting a construction duration and
cost based on project characteristics in multi-family
housing projects. Canadian Journal of Civil
Engineering, 37(5), 739-752. 13-18.
Kottelat, M., A. J. Whitten, S. N. Kartikasari & S.
Wiroatmodjo. 1993. Freshwater Fishes of Western
Indonesia and Sulawesi. Edisi Dwi Bahasa Inggris
Indonesia. Periplus Edition (HK) Ltd. Bekerjasama
dengan Kantor Menteri KLH, Jakarta.
Merigo, J. M., & Casanovas, M. A, 2011. New Minkowski
Distance based on Induced Aggregation Operators.
International Journal of Computational Intelligence
Systems. 4. (2) 123-135.
Pal, Sankar K. & Shiu, S. C. K. 2003. Foundations of Soft
Base Reasoning. 1-27.
Singh, A. Yadav, A. & Rana, A. 2013. K-Means with Three
different distance metrics. International journal of
computer applications. 67 (10).
Watson, I. 1997. Applying Case-Based Reasoning:
Techniques for Enterprise Systems. San Francisco:
Morgan KaufmannPublishers, Inc.
Fish Disease Diagnose System using Case-based Reasoning with Euclidean Distance
221
