
Extraction and Analysis of Nicotine from the Saliva of Active
Smokers using UV Spectroscopy
Muhammad Taufik
1
, Desi Ardilla
2
, Mariany Razali
3
, Endang Susilawati
4
, Afniwati
4
and Nurul Fadillah
1
1
Department of Biology, Faculty of Mathematics and Natural Sciences, Universitas Sumatera Utara, Medan, Indonesia
2
Department of Agricultural Technology, Universitas Muhammadiyah Sumatera Utara, Medan, Indonesia
3
Department of Pharmacy, Universitas Tjut Nyak Dhien, Medan, Indonesia
4
Department of Nursing, Poltekkes Kemenkes Medan, Medan, Indonesia
Keywords: Saliva, FTIR, Nicotine, Uv-Visible Spectrophotometer, Extraction.
Abstract: An accurate and simple method of extraction and analysis needs to be developed in the context of
investigating nicotine in the saliva of active smokers. This study aims to prepare, extract and analyse
nicotine from the saliva of active smokers. The preparation process is carried out from the location where
the samples were taken. Extraction was carried out using sonication coupling maceration for 15 minutes.
Qualitative analysis used spot test with Cyanogen bromide reagent and quantitative analysis used UV
spectrophotometer. Ultra Violet (UV) spectrophotometer analysis at the optimum wavelength of 260 nm
resulted in a sample concentration of Saliva A = 1.4 ppm and Saliva B = 1.6 ppm.
1 INTRODUCTION
Nicotine (Nicotiana tobacum) is the most important
ingredient in tobacco leaves. Nicotine has the
molecular formula C
10
H
14
N
2
(Fidrianny 2004).
Nicotine is a clear, slightly yellow liquid that has an
oil-like appearance, dissolves in water and is also
soluble in organic solvents in general, such as
ethanol, petroleum ether, and chloroform (Taufik et
al. 2017). Nicotine is an alkaloid compound that is
widely contained in plants with the genus
Solanaceae (Rahmat Nur Hidayat, Adam M.
Ramadhan 2016). One of them is the type of tobacco
(Nicotiana). Nicotine with the chemical name 1-
Methyl-2- (3-pyridyl) pyrrolidine; β-pyridyl-α- N-
methylpyrolidine or with the molecular formula
C
10
H
14
N
2
or C
5
H
4
NC
4
H
7
NCH
3
(Clayton et al. 2013).
Identification for nicotine can be done in urine,
hair and including saliva (Taufik, Susilawati, et al.
2021). Saliva is the first biological fluid to be
exposed to cigarette smoke in the oral cavity
(Kunutsor et al. 2018). Cigarette smoke contains a
variety of chemicals that can cause functional and
structural changes in saliva which can reduce the
flow of saliva, causing dry mouth and halitosis
(Fidrianny 2004) (Kunutsor et al. 2018).
Saliva has 99% water and 1% organic and
inorganic components (Jahed, Hamidi, and
Galehassadi 2020). Inorganic components of saliva
include: Sodium, Calcium, Potassium, Magnesium,
Bicarbonate, Chloride, Rodanide and Thiocynate
(CNS), Phosphate, Potassium and Nitrate. While the
organic components in saliva include proteins in the
form of the enzyme amylase, maltase, serum
albumin, uric acid, cretinin, mucin, vitamin C,
several amino acids, lysosime, lactate, and several
hormones such as testosterone and cortisol (Jahed,
Hamidi, and Galehassadi 2020).
The preparation of smoker's saliva which is the
initial stage of work that must be carried out in
various analyzes for sample preparation (Kunutsor et
al. 2018). The process of separating the material
from the mixture is carried out using the appropriate
solvent (Alfian et al. 2018). Sample preparation is
carried out in sample conditions where there are
specific techniques for sampling in order to obtain a
representative sample (Sisco, Najarro, and Burns
2018). This preparation aims to eliminate various
annoyances (Kondeti, Mulpuri, and Meruga 2014).
Sonication maceration is a liquid-liquid
extraction method that utilizes ultrasonic waves with
a frequency of 42 kHz which can accelerate the
contact time between the sample and the solvent
616
Taufik, M., Ardilla, D., Razali, M., Susilawati, E., Afniwati, . and Fadillah, N.
Extraction and Analysis of Nicotine from the Saliva of Active Smokers using UV Spectroscopy.
DOI: 10.5220/0010614700002775
In Proceedings of the 1st International MIPAnet Conference on Science and Mathematics (IMC-SciMath 2019), pages 616-620
ISBN: 978-989-758-556-2
Copyright
c
2022 by SCITEPRESS – Science and Technology Publications, Lda. All rights reserved

even at room temperature (Taufik 2016). Sonication
relies on wave energy that causes the cavitation
process, which is the process of forming small
bubbles due to the transmission of ultrasonic waves
to assist solvent diffusion into the sample (Alfian et
al. 2018). The sonication extraction method is also
efficient and shortens the extraction time
(Delmifiana and Astuti 2013).
Nicotine analysis is needed to determine the
nicotine content of human metabolites (Rahmat Nur
Hidayat, Adam M. Ramadhan 2016). The qualitative
analysis of nicotine was carried out in several ways,
such as the spot test using the Cyanogens bromide
test reagent until an orange color was obtained
which indicated positive nicotine (Paci et al. 2018).
Where the analysis of the Cyanogen bromide test is
carried out with the extraction results dropping 2
drops into the spot test, then dropping 2-3 drops of
Cyanogen bromide until it dissolves in the spot test,
and observing the orange color that occurs then
compared with the standard and differentiated into +
(slightly), + + (moderate), +++ (abundant) (Taufik,
Cahyady, et al. 2021).
Nicotine analysis is needed to determine the
nicotine content of human metabolites (Paci et al.
2018). The qualitative analysis of nicotine was
carried out in several ways, such as the spot test
using the Cyanogens bromide test reagent until an
orange color was obtained which indicated positive
nicotine (Taufik 2017). Where the analysis of the
Cyanogen bromide test is carried out with the
extraction results dropping 2 drops into the spot test,
then dropping 2-3 drops of Cyanogen bromide until
it dissolves in the spot test, and observing the orange
color that occurs then compared with the standard
and differentiated into + (slightly), + + (moderate),
+++ (abundant) (Rahmat Nur Hidayat, Adam M.
Ramadhan 2016) (Taufik et al. 2017).
The quantitative analysis of nicotine was carried
out through UV spectroscopy based on the
interaction of the sample with UV light. UV light
has a wavelength of 190 - 380 nm as a light source,
deuterium lamps can be used. Deuterium, also
known as heavy hydrogen, is a stable isotope of
hydrogen that is abundant in the ocean and land. The
nucleus of deuterium has one proton and one
neutron, while hydrogen has only one proton and no
neutrons (Clayton et al. 2013). This study aims to
extract by maceration the sonication coupling of
nicotine contained in saliva samples of active
smokers and to analyze it using UV spectroscopy.
2 METHODS
2.1 Materials
The materials used in this study were saliva, pure
nicotine (sigma Aldrich), methanol, chloroform (p a
merck), Cyanogen bromide reagent (Sigma Aldrich),
and aquadest.
2.2 Nicotine Standard Solution
Preparation
Nicotine standard solution (sigma aldrich) was
prepared by varying the concentration of nicotine,
respectively, 0.5 ppm, 1 ppm, 1.5 ppm, 2 ppm, 2.5
ppm.
2.3 Preparation
The saliva sample of active smokers was measured
10 ml each added 10 ml of chloroform solvent, then
put it into each separating funnel, then shaken it, and
let it stand for a moment, there were 2 layers (the top
layer of the remaining saliva and the bottom layer of
nicotine).
2.4 Extraction
The saliva used as the sample was sonication
process at a frequency of 42 KHz for 10 minutes.
The result of maceration was taken from the lower
layer of nicotine and then diluted with the addition
of 10 ml methanol. The sonication process was
carried out again for 5 minutes at a frequency of 42
kHz in a sonication bath. Note: comparator saliva
(not smokers) is carried out in the same manner
2.5 Spot Test Analysis
Spot test analysis was carried out using Cyanogens
bromide reagent until an orange color was obtained
which indicated a positive nicotine. The analysis
procedure for the Cyanogen bromide test is carried
out by:
1. The sample is added 2 drops of cyanogen bromide
in the spot test.
2. Observed the orange color that occurs and
differentiated into + (slightly), ++ (moderate),
+++ (abundant).
Extraction and Analysis of Nicotine from the Saliva of Active Smokers using UV Spectroscopy
617
2.6 Analysis using UV Spectroscopy
The analysis of the extracted nicotine was carried
out using a UV spectrophotometer with the
following procedure:
1. Turn on the Uv-Vis spectrophotometer on the
back of the instrument, wait for 10-15 minutes,
then connect it to the computer, and start the
Windows 7 Short-cut application.
2. The cuvette used was a glass cuvette with a
thickness of 10 mm, a square cuvette.
3. Inserted a blank into the UV spectrophotometer,
measured the wavelength of the blank.
4. The maximum wavelength is determined.
5. Sample analysis is performed.
3 RESULTS
3.1 Collecting Samples
Saliva of smokers, and saliva of non-smokers from
male volunteers obtained at Jl. Arca Gang Jawa
Medan Building. All saliva samples were collected
between 08:00 and 11:00 WIB. The saliva was
collected in the morning by instructing the
volunteers not to eat and drink at the time of
collection, to let the saliva go down, to let the foam
on the saliva be left for a while so that the foam
would go down. The sample that has been collected
is put into a beaker.
3.2 Preparation
Smoker's saliva preparation was carried out in the
laboratory of the University of North Sumatra,
Medan. The samples used were 10 ml of active
smoker's saliva with the addition of chloroform
solvent, in the smoker's saliva there is a nicotine
compound that comes from cigarette consumption,
which is directly exposed to cigarettes and cigarette
smoke through the mouth where saliva is contained.
Smoker's saliva has 2 layers perfectly where the
bottom layer of nicotine and the top layer of the
saliva remains. Non-smoker's saliva does not have a
perfect 2-layer separation so it takes 5 minutes to let
the saliva and solvent split into two layers.
3.3 Extraction
Saliva samples of active smokers that have been
added with chloroform and macerated sonication,
the nicotine and the remaining saliva are separated.
Obtained cloudy white nicotine extract. The lower
layer of the sonication maceration process was
taken, then left for a while and added methanol, then
re-macerated sonication with a frequency of 42 kHz
and put into a vial bottle. The same was true for the
comparator saliva (sample of non smokers).
3.4 Spot Test
The results of the spot test for saliva from active
smokers and saliva from non-smokers can be seen in
Table 4.1 below:
Table 3.1 Spot Test Result Data
Sample abundan
ce
Colour Infor
mation
Nicotine
standard
+++ Orange Positive
Nicotine
Saliva A +++ Orange Positive
Nicotine
Saliva B +++ Orange Positive
Nicotine
Comparison
sample
- - Negative
Nicotine
Table 3.1 shows that the saliva samples of active
smokers from the spot test results with the cyanogen
bromide test reagent produce an orange color which
indicates positive for nicotine, and in the saliva of
non-smokers there is no color change (negative).
3.5 UV Spectroscopy Analysis
3.5.1 Determination of the Optimum
Wavelength
The results of determining the optimum wavelength
of nicotine can be seen in Figure 3.1. the following :
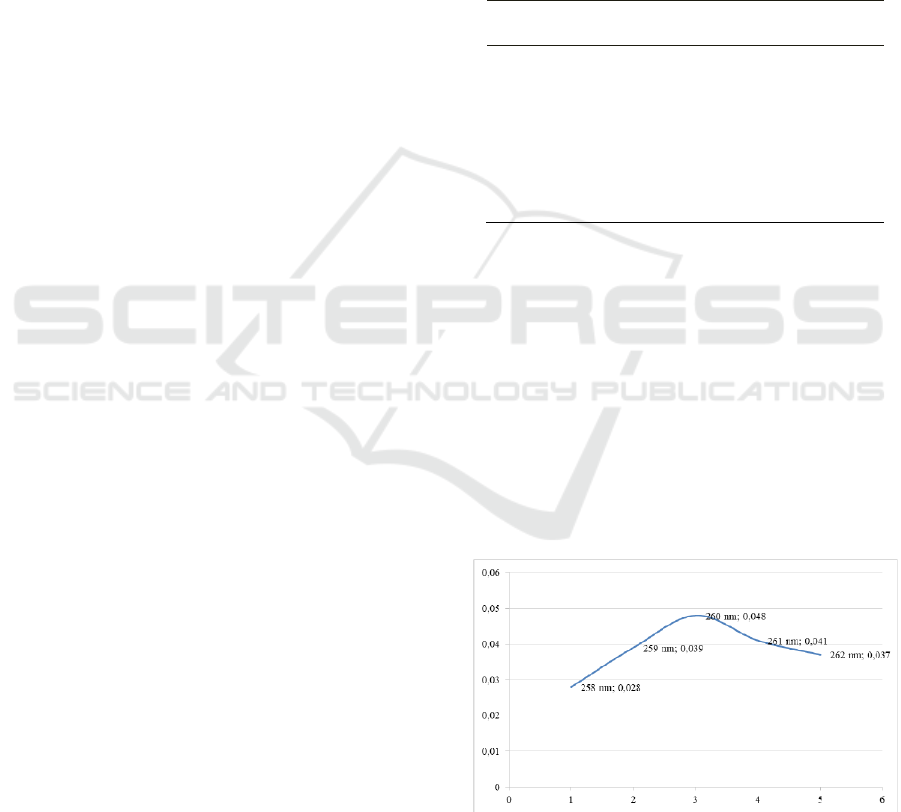
Figure 3.1. Optimum wavelength of nicotine
Figure 3.1 shows the highest peak at a wavelength of
260 nm with an absorbance value of 0.048. At a
wavelength of 258 nm, an absorbance value of 0.028
IMC-SciMath 2019 - The International MIPAnet Conference on Science and Mathematics (IMC-SciMath)
618
was obtained, a wavelength of 259 with an
absorbance value of 0.039, a wavelength of 261 with
an absorbance value of 0.041 and a wavelength of
262 with an absorbance value of 0.037. So that the
optimum wavelength of nicotine is at a wavelength
of 260 nm.
3.5.2 Nicotine Standard Curve
The standard nicotine curve can be seen in Figure
3.2. the following :
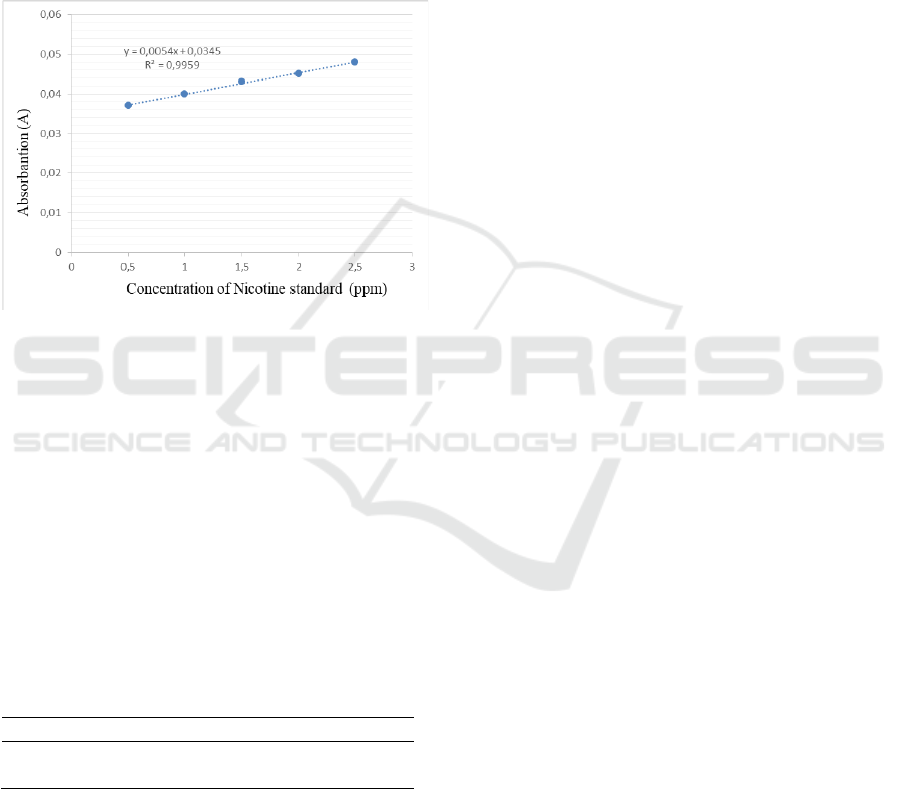
Figure 3.2. Nicotine standard curve
Figure 3.2 shows a straight line equation, namely r =
0.995 with a value of y = 0.0054x + 0.0345. Based
on the figure, it shows that the relationship between
the concentration of nicotine samples and the
response to ultraviolet spectroscopy is proven to be
linear.
3.5.3 Concentration of Nicotine
Saliva samples that have been extracted are inserted
into the cuvette to measure the absorption and
concentration of each sample at a wavelength (λ) of
260 nm. It can be seen in Table 3.2. below:
Table 3.2. Saliva Sample Concentration
N
o. Sampel Concentration (ppm)
1. Saliva A 1,4
2. Saliva B 1,6
Table 3.2 shows that the concentration of saliva
samples is saliva A = 1.4 ppm) and saliva B = 1.6
ppm.
4 CONCLUSION
Extraction of saliva from active smokers by
sonication maceration for 10 minutes with the
addition of chloroform solvent at 42 KHz.
Qualitative analysis of the saliva of active smokers
was compared with nicotine standards, which
resulted in an orange color. Ultra Violet (UV)
spectrophotometer analysis at the optimum
wavelength of 260 nm resulted in a sample
concentration of Saliva A = 1.4 ppm and Saliva B =
1.6 ppm.
REFERENCES
Alfian, Z., H. Marpaung, M. Taufik, R. Harahap, and C.
Simanjuntak. 2018. Detection and Identification of
Morphine in Blood of Male White Rats (Rattus
Norvegicus) by Ultraviolet-Visible
Spectrophotometry. Journal of Physics: Conference
Series. Vol. 1116. https://doi.org/10.1088/1742-
6596/1116/4/042004.
Clayton, Peter M., Carl A.V., T Bui, Alex F D.. Mcadam
K. 2013. Spectroscopic Studies on Nicotine and
Nornicotine in the UV Region. Chirality 25 (June
2014): 288–93. https://doi.org/10.1002/chir.22141.
Delmifiana, B., Astuti. 2013. Pengaruh Sonikasi Terhadap
Struktur Dan Morfologi Nanopartikel Magnetik Yang
Disintesis Dengan Metode Kopresipitasi. Jurnal Fisika
Unand 2 (3): 2011–14.
Fidrianny, I. 2004. Analisis Nikotin Dalam Beberapa
Organ Mencit Jantan Yang Telah Menghirup Asap
Rokok Analysis of Nicotine in Various Organs of
Male Mice after Inhalation of Cigarette Smoke.
Majalah Farmasi Indonesia 15 (4): 207–10.
Jahed, F., Soghra, Hamidi S.,, Galehassadi M. 2020.
Dispersive Micro-Solid Phase Extraction for Sensitive
Determination of Methotrexate from Human Saliva
Followed by Spectrophotometric Method. Research
Article 21 (1): 1531–38.
https://doi.org/10.31557/APJCP.2020.21.6.1531.
Jannatin, M., SupriyantoG., Pudjiastuti P. 2017. A Novel
Spectrophotometric Method for the Determination of
Histamine Based on Its Complex Reaction with Ni ( II
) and Alizarin Red S. Indonesian J. Chem. 17 (1):
139–43. https://doi.org/10.22146/ijc.23621.
Kondeti, R., Sri Mulpuri K., Meruga B. 2014.
Advancements in Column Chromatography : A
Review. Ranjith Reddy Kondeti1, Kranti Sri Mulpuri,
Bharathi Meruga 2 (9): 1375–83.
Kunutsor, S.K., Julia M.S., M.K Kieneker, Ron T., Robin
P.F., Dullaart, , Daan A.J.V., Stephan J.LB. 2018.
Self-Reported Smoking, Urine Cotinine, and Risk of
Cardiovascular Disease: Findings from the Prevention
of Renal and Vascular End-Stage Disease) Prospective
Cohort Study. Journal of the American Heart
Extraction and Analysis of Nicotine from the Saliva of Active Smokers using UV Spectroscopy
619

Association 7 (10). https://doi. org/10.1161/JAHA.
118.008726
Paci, E., Pigini D., Bauleo L, Forastiere A.F., Tranfo G.
2018. Urinary Cotinine Concentration and Self-
Reported Smoking Status in 1075 Subjects Living in
Central Italy. International Journal of Environmental
Research and Public Health 15 (4). https://doi.org/
10.3390/ijerph15040804.
Rahmat N.H., Ramadhan A.M., Rusli R. 2016. Analisis
kadar nikotin rokok herbal Indonesia. Prosiding
Seminar Nasional Kefarmasian Ke-3, 1:20–21.
Sisco, E., Najarro M, Burns A. 2018. A Snapshot of Drug
Background Levels on Surfaces in a Forensic
Laboratory. Forensic Chemistry 11 (July): 47–57.
https://doi.org/10.1016/j.forc.2018.09.001.
Taufik, M. 2016. Analysis of User’s Hair Cannabinoid of
Narcotic Type of Marijuana (Cannabis Sativa L.)
Using GCMS Technic. American Journal of
Biomedical and Life Sciences 4 (1): 1.
https://doi.org/10.11648/j.ajbls.20160401.11.
———. 2017. Jurnal Stikna. JA Jurnal Sains, Teknologi,
Farmasi & Kesehatan 01 (02).
Taufik, M., Cahyady B., Ardilla D., Alfian Z., Wanto R.,
Daulay A.S,, Savitri R.R,, Pratiwi F., Susilawati E.
2021. Nicotine Separation from the Urine of Active
Smokers Using Moringa Oleifera on Column
Chromatography Nicotine Separation from W He
Urine of Active Smokers 8 Sing Moringa Oleifera on
Column Chromatography. AIP Conference
Proceedings 020007 (April): 1–10.
Taufik, M., Susilawati E., Razali M., Pratiwi F., Savitri
R.R. 2021. Decreased Stress Levels and Nicotine
Concentrations in the Urine of Active Smokers after
Consuming Antioxidants Decreased Stress Levels and
Nicotine Concentrations in W He Urine of Active
Smokers After Consuming Antioxidants.” In AIP
Conference Proceedings, 020002:1–7.
Taufik, M., Wanto R.,, Cibro S.R., Ardilla D., Razali M.,
Tarigan D.M. 2017. Studi Pendahuluan Maserasi
Coupling Elektosintesis Dalam Mengekstraksi Nikotin
Yang Terkandung Dalam Puntung Rokok. Prosiding
Seminar Nasional Kimia Unmul, 182–90.
IMC-SciMath 2019 - The International MIPAnet Conference on Science and Mathematics (IMC-SciMath)
620
