
Analysis of Kwetiau Adulterated with Lard: Case Study of Effect of
Sample Weight and Concentration of n-hexane as Solvent
Desi Ardilla
1
, Muhammad Taufik
2
and Kusti Ayu Ningtias
1
1
Department of Agricultural Technology, Universitas Muhammadiyah Sumatera Utara, Medan, Indonesia
2
Department of Chemistry, Faculty of Mathematics and Natural Sciences, Universitas Sumatera Utara, Medan, Indonesia
Keywords: Adulteration, Kwetiau, Lard
Abstract: It has been analyse that kwetiau adulterated with lard by approximating the sample weight and concentration
of n-hexane as a solvent. This study used a Factorial Completely Randomized Design (CRD) with two (2)
replications. Factor I is the difference in sample weight (B) consisting of 4 levels, namely: B1 = 50 g, B2 =
60 g, B3 = 70 g and B4 = 80 g. The second factor is the difference in the concentration of n-hexane (N)
consisting of 4 levels, namely: N1 = 20%, N2 = 30%, N3 = 40% and N4 = 50%. The parameters observed
were: specific gravity and refractive index. The analysis results for Specific gravity: sample weight and n-
hexane concentration both had no significant effect (P> 0.05) on both lard and non-lard kwetiau. The
interaction between sample weight and n-hexane concentration also had no significant effect (P> 0.05) on
both lard and non-lard kwetiau. Refractive index: The sample weight on lard kwetiau had a very significant
effect (P <0.01) on the refractive index. The highest refractive index is found in treatment B4 which is 1.786
and the lowest value can be seen in treatment B1 which is 1.668. The concentration of n-hexane in kwetiau
lard gave a very significant effect (P <0.01) on the refractive index. The highest refractive index is found in
treatment N4 which is 1.755 and the lowest value can be seen in treatment N1 which is 1.683. Treatment
interactions had no significant effect (P> 0.05) on the refractive index. Meanwhile, sample weight on kwetiau
without lard had a very significant effect (P <0.01) on the refractive index. The highest refractive index is
found in treatment B4 which is 1.503 and the lowest value can be seen in treatment B1 which is 1.469. The
concentration of n-hexane in kwetiau without lard had a very significant effect (P <0.01) on the refractive
index. The highest refractive index is found in treatment N4 which is 1.497 and the lowest value can be seen
in treatment N1 which is 1.474.
1 INTRODUCTION
Food is one of the primary needs of humans besides
clothing and shelter (Firmansyah 2019). Food plays
an important role in human life, therefore we need a
guarantee that the food consumed daily by humans
has a high level of safety, so that humans can be free
from disease or danger from food (Gustiani 2009).
The total population of Indonesia in 2020 is
projected to reach 271,066 million people. Around
209.28 million people in Indonesia are Muslims.
Based on these data, in terms of food safety, of course
the Indonesian people, especially Muslims, must have
a guarantee that the products consumed are halal and
good food (Taufik et al. 2021).
One of the halal concepts in Islam is that food
must not contain any lard or food fat derived from
pork. Regardless of the lard content in food, it will
make the unclean food for consumption (Salehudin
2014). Pork or its derivatives refers to any object or
compound produced from pork such as pork, lard and
gelatin produced from pork bones or skin. Pig
derivatives are usually cheaper than products derived
from cows, it is on this basis that pork derivatives are
often used as counterfeiters in food systems. Pork is
often mixed with beef by rogue traders with the aim
of making large profits (Rohman et al. 2012).
Along with technological advances, there are
various food products that are very diverse with
excellent quality and prices. It's just that sometimes
to get it you need ingredients that are obtained from
one or several parts of the pig's body and then mix
these parts with other food processed products. The
deliberate mixing of unwanted ingredients in a
particular product is called adulteration. Adulteration
Ardilla, D., Taufik, M. and Ningtias, K.
Analysis of Kwetiau Adulterated with Lard: Case Study of Effect of Sample Weight and Concentration of n-hexane as Solvent.
DOI: 10.5220/0010614500002775
In Proceedings of the 1st International MIPAnet Conference on Science and Mathematics (IMC-SciMath 2019), pages 605-610
ISBN: 978-989-758-556-2
Copyright
c
2022 by SCITEPRESS – Science and Technology Publications, Lda. All rights reserved
605

is a mixture or counterfeiting of a product that does
not meet standards (Taufik et al. 2018).
The case of food containing ingredients from pork
is rife in Indonesia (Mutmainah 2018). In 2015, a case
of kwetiau was found which was allegedly made from
pork oil in Tanjung Pinang. Kwetiau is a type of
noodle made from rice flour, white in color with a
width of 1 cm, served in a processed form that is fried
or put in sauce. Therefore, research on methods of
analyzing pork content in food products must be
developed so that it is more accurate and efficient
(Lusiana Berti, Yetti, and Asra 2020).
Several methods have been used to identify lard
in food, including UPLC with myoglobin markers,
polymerase chain reaction and nanobiophrobe (Yanty
et al. 2018). The weaknesses of these methods require
a lot of effort and time so that a fast analysis technique
is needed (Lusiana Berti, Yetti, and Asra 2020).
The extraction method used in this study is
maceration. Maceration is an extraction process that
aims to extract the whole compound based on the
polarity of the solvent used in stages. The advantage
of using this method is that it does not require heat
during the extracting process and only requires a
container and a lid. The organic solvents most often
used to extract phenolic compounds include
methanol, ethanol, ethyl acetate and n-hexane
(Satriavi et al. 2013). The advantage of this method is
easy and does not need heating so that natural
materials are less likely to be damaged or
decomposed. The selection of solvents based on their
solubility and polarity facilitates the separation of
natural substances in the sample. The long operation
of the maceration method and the stationary state
during maceration allows many compounds to be
extracted (Nees et al. 2017). Electrosynthetic
coupling maceration is a way to synthesize or produce
a material based on electrochemical techniques. In
this method there is a change in the element or
chemical compound into the desired compound
(Taufik et al. 2017).
The Maceration method generally uses a non-
aqueous or non-polar solvent. The choice of the type
of solvent in maceration extraction needs to be
considered, among others, the ability to dissolve
oleoresin, boiling point, toxicity, flammability and
influence on the extraction equipment. The use of n-
hexane as a solvent is due to its non-polar nature so
that it dissolves fat faster and makes the extraction
process easier when compared to a solvent (Chemat
et al. 2019).
In statistics, doing an experiment is one way to get
data. This study used a factorial complete randomized
design model. A factorial experiment is an
experiment whose treatment consists of all possible
combinations of levels of several factors. A factorial
experiment can be applied directly to all experimental
units if the unit experiments are relatively
homogeneous. Such a design is called a factorial
design with the basic design of the RAL or further
called the factorial RAL (Ardilla et al. 2018). In this
work, the effect of sample weight and concentration
of n-hexane as solvent will be studied and this will be
compared with the specific graffity and refractive
index values.
2 MATERIALS AND METHOD
2.1 Material
The materials used in this study were kwetiau and
kwetiau adulterated with lard, n-hexane, aquadest,
alcohol, aluminum foil, plastic wrap, whattman paper
No 41.
2.2 Methodology
This Method of research was carried out by the
factorial Completely Randomized Design (CRD)
method which consisted of 2 factors, namely:
Factor I: Material Weight (B) which consists of 4
levels, namely:
B1 = 50 g B3 = 70 g
B2 = 60 g B4 = 80 g
Factor II: Concentration of n-Hexane (N) which
consists of 4 levels, namely:
N1 = 20% N3 = 40%
N2 = 30% N4 = 50%
The number of treatment combinations (Tc) is 4 x
4 = 16, then the number of repetitions (n) is as
follows:
Tc (n-1) ≥ 15
16 (n-1) ≥ 15
16 n-16 ≥ 15
16 n ≥ 31
n ≥ 1,937 ............. rounded to n = 2
then for research accuracy, repeated 2 (two)
treatments.
2.3 Experimental Design
The research was conducted with a factorial
Completely Randomized Design (CRD) with the
model:
Ỹijk = µ + αi + βj + (αβ)ij + εijk
Caption ;
IMC-SciMath 2019 - The International MIPAnet Conference on Science and Mathematics (IMC-SciMath)
606
Ỹijk: Observation of factor B from level i and
factor N at level j :
k-th repeat.
µ: Middle value effect
αi: Effect of factor B at level-i.
βj: Effect of factor N at level j.
(αβ) ij: The interaction effect of factor B at level i
and factor N at level j.
εijk: The error effect of factor B at level i and
factor N at level j in k-th test.
2.4 Sample
Extraction
Kwetiau weighed according to the treatment, namely
50 g, 60 g, 70 g and 80 g, and then mashed using a
mortar and pestle. The noodles that have been refined
are put into a beaker glass then added with n-hexane
according to the treatment, namely 20%, 30% 40%
and 50%. Maceration process was developed used
electro synthetic method at 120 minutes with a strong
current of 2,2 volts using an aluminum cathode and
anode. The macerated kwetiau are then filtered with
gauze. The filter results are centrifuged at 3000 rpm
for 20 minutes. The sample is then filtered again with
Whattman paper No 41. Furthermore, the sample is
tested for density and refractive index, then analyzed.
3 RESULTS AND DISCUSSION
3.1 Effect of Sample Weight
The effect of sample weight on Parameters of
Kwetiau adulterated with lard and kwetiau non lard
can be seen in Table 1.
Table 1: Effect of sample weight
Weight
(g)
Density
(g/mL)
Refractive
index
(°Brix)
Kwetiau with
lar
d
50
60
70
80
0.829
0.880
0.955
0.960
1.668
1.684
1.738
1.786
Kwetiau non
lar
d
50
60
70
80
0.864
0.879
0.923
0.955
1.469
1.475
1.485
1.503
Based on the reference list of variance, it can be
seen that the effect of sample weight of lard kwetiau
and non-lard kwetiau has a very significant effect (p
<0.01) on the refractive index. The level of difference
has been tested with the average difference test and
can be seen in Table 2 below.
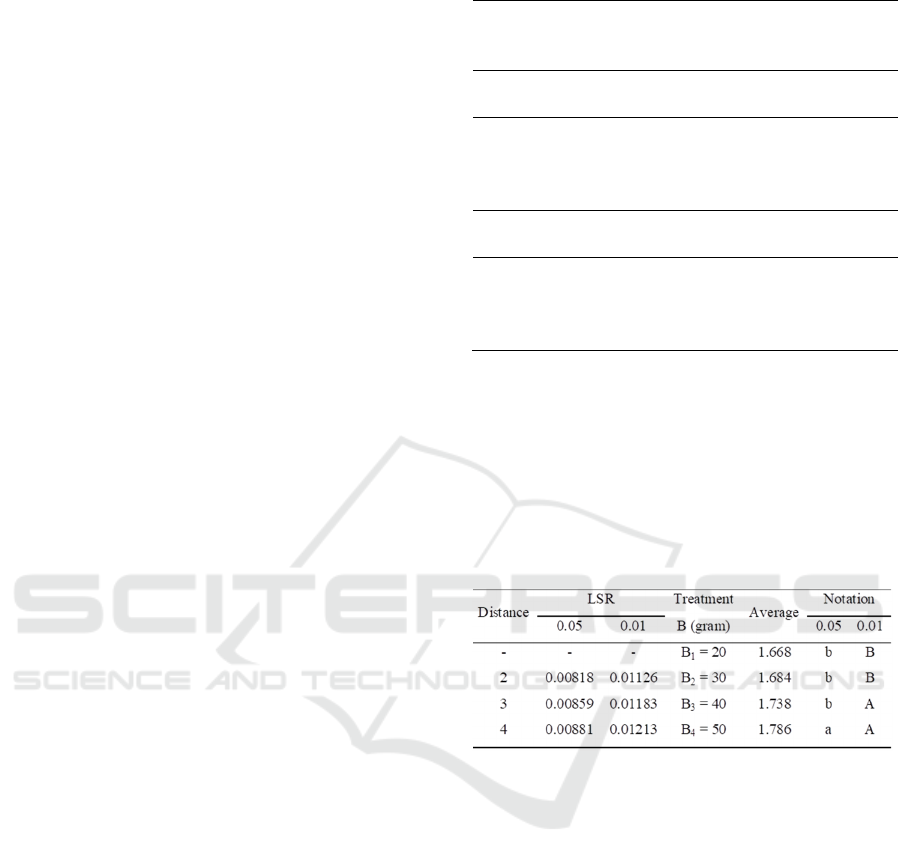
Table 2: Results of the Mean Difference Test of the Effect
of Sample Weight of Kwetiau with lard on Refractive Index
Table 2 shows that B1 is significantly different
from B2, B3 and B4. B2 is very different from B4 and
not significantly different from B3. B3 is very
different from B4. The highest value can be seen in
treatment B4 = 1.786 and the lowest value can be seen
in treatment B1 = 1.668. The results of the average
difference test for the effect of sample weight kwetiau
without lard on the refractive index can be seen in
Table 3.
Analysis of Kwetiau Adulterated with Lard: Case Study of Effect of Sample Weight and Concentration of n-hexane as Solvent
607

Table 3: The Results of the Mean Difference Test The
Effect of Sample Weight Kwetiau without lard on the
Refractive Index
Note: Different letters in the notation column show a
significantly different effect at the level of p <0.05 and very
significantly different at the level of p <0.01.
Table 2 and Table 3 shows the effect of sample
weight on the refractive index. The higher the sample
weight used, the higher the refractive index produced.
The refractive index of a substance is the ratio of the
speed of light in the air to the speed of light in the
substance. Overall, the refractive index value of
kwetiau with lard ranged from 1.668°Brix to
1.768°Brix. The oil component extracted by the
solvent increases along with the increasing weight of
the sample used as simplicia so that the oil density
will increase and the light coming will be difficult to
refract causing the refractive index value to be larger.
This can be explained that the greater the content in
the oil, the smaller the speed of light due to being
obstructed by oil particles. Thus it can be understood
that the more content in the oil, the greater the
refractive index of the oil (Prasetyo et al., 2014).
However, the refractive index value of lard rice
noodles was higher than that of non-lard rice noodles.
The increase in the value of the refractive index is
thought to be due to the large number of combinations
of meat and oil used in the kwetiau, the more
components will be extracted from the compound.
The difference in refractive index is influenced by
differences in diffraction patterns between the
mediums due to differences in optical density
between the two mediums (Supriyadi et al., 2014). Oil
extracted from lard kwetiau has a higher optical
density than oil extracted from kwetiau without lard.
3.2 Effect of Hexane Concentration
The effect of n-hexane concentration on parameters
of Kwetiau adulterated with lard and kwetiau non lard
can be seen in Table 4.
Table 4: Effect of hexane concentration
Weight
(g)
Density
(g/mL)
Refractive
index
(°Brix)
Kwetiau with
lar
d
20
30
40
50
0.855
0.903
0.913
0.923
1.683
1.696
1.742
1.755
Kwetiau non
lar
d
20
30
40
50
0.890
0.899
0.910
0.921
1.474
1.478
1.484
1.496
Table 4 shows that N1 is significantly different
from N3 and N4 and not significantly different from
N2. N2 is very different from N3 and N4. N3 is not
significantly different from N4. The highest value can
be seen in treatment N4 = 1.755 and the lowest value
can be seen in treatment N1 = 1.683. The level of
difference has been tested with the average difference
test and can be seen in Table 5 below.
Table 5: Results of the Mean Difference Test of the Effect
of n-hexane Concentration of Kwetiau with lard on
Refractive Index
Note: Different letters in the notation column show a
significantly different effect at the level of p <0.05 and very
significantly different at the level of p <0.01.
Table 5 shows that N1 is very significantly
different from N3 and N4 and not significantly
different from N2. N2 is very different from N3 and
N4. N3 is not significantly different from N4. The
highest value can be seen in treatment N4 = 1.755 and
the lowest value can be seen in treatment N1 = 1.683.
The Results of the Mean Difference Test The Effect
of Sample Weight Kwetiau without lard on the
Refractive Index.
Distance
LSR Treatment
Average
Notation
0.05 0.01 B (gram) 0.05 0.01
- - - B
1
= 20 1.474 b B
2 1.07711 1.48282 B
2
= 30 1.478 b B
3 1.13096 1.55821 B
3
= 40 1.484 b A
4 1.15968 1.59771 B
4
= 50 1.497 a A
Distance
LSR Treatment
Average
Notation
0.05 0.01 B (gram) 0.05 0.01
- - N
1
= 20 1.683 b B
2 0.00818 0.01126 N
2
= 30 1.696 b B
3 0.00859 0.01183 N
3
= 40 1.742 b A
4 0.00881 0.01213 N
4
= 50 1.755 a A
IMC-SciMath 2019 - The International MIPAnet Conference on Science and Mathematics (IMC-SciMath)
608

Table 6: The Results of the Mean Difference Test of The
Effect of n-hexane Concentration Kwetiau without lard on
the Refractive Index
Distance
Treatment
Avg.
Notation
B (gram) 0,05 0.01
- N
1
= 20 1.474 b B
2 N
2
= 30 1.478 b B
3 N
3
= 40 1.484 b B
4 N
4
= 50 1.497 a A
Note: Different letters in the notation column show a
significantly different effect at the level of p <0.05 and very
significantly different at the level of p <0.01.
Table 6 shows that N1 is very significantly
different from N4 and not significantly different from
N2 and N3. N2 is significantly different from N4 and
not significantly different from N3. N3 is very
different from N4. The highest value can be seen in
treatment N4 = 1.497 and the lowest value can be seen
in treatment N1 = 1.474
Table 5 and Table 6 shows that the effect of n-
Hexane concentration on the refractive index. The
higher the concentration of n-hexane used as the
solvent, the higher the refractive index produced. The
refractive index of a substance is the ratio of the speed
of light in the air to the speed of light in the substance.
Overall, the refractive index value of lard rice noodles
ranged from 1.683 ° Brix to 1.755 ° Brix and the
overall refractive index value for non-lard rice
noodles ranged from 1.474 ° Brix to 1.469 ° Brix.
This is because the components in the oil
extracted by n-hexane are extracted more so that the
density of the oil will increase and the light will be
difficult to refract, causing the refractive index value
to be larger. Diffraction is one of the wave behaviors
where the wave will experience a deflection because
it passes through a narrow gap (Young and Freedman,
2001).
The refractive index value of lard kwetiau is not
much different from the refractive index value of lard
based on the research of Taufik et al. (2018) that the
refractive index of lard is between 1.502 ° Brix to
1.505 ° Brix. While the refractive index value of
kwetiau without lard is presumed that the type of oil
used in this kwetiau without lard is cooking oil
because this value is close to the refractive index
value of cooking oil based on data from the National
Standardization Agency (1995), namely the quality
standard for cooking oil has a range of refractive
index criteria. between 1.448 ° Brix to 1.450 ° Brix.
4 CONCLUSION
The sample weight had a very significant effect (p
<0.01) on the refractive index and had an insignificant
difference (p> 0.05) on the specific gravity of lard
kwetiau. The concentration of n-hexane had a very
significant effect (p <0.01) on the refractive index and
had an insignificant difference (p> 0.05) on the
specific gravity of lard kwetiau.
ACKNOWLEDGEMENTS
The authors gratefully acknowledge Dirjen Dikti –
DRPM for the financial support via Penelitian Dasar
Unggulan Perguruan Tinggi.
REFERENCES
Ardilla, D., Muhammad T., Tarigan D.M., Thamrin M.,
Razali M., Siregar S. 2018. Analisis Lemak Babi Pada
Produk Pangan Olahan Menggunakan Spektroskopi
UV – Vis Analysis Of Lard In The Meat Processed
Using UV - Vis Spectroscopy. AGRINTECH - Jurnal
Teknologi Pangan & Hasil Pertanian 1 (2): 111–16.
Chemat, F., Vian M.A., Ravi K., Khadhraoui B, Hilali S.,
Perino S., Tixier A. 2019. Review of Alternative
Solvents for Green Extraction of Food and Natural
Products: Panorama, Principles, Applications and
Prospects. Molecules 24 (16): 1–27.
https://doi.org/10.3390/molecules24163007.
Firmansyah, I. 2019. Kajian Analisis Kandungan Boraks
Dan Formalin Pada Produk Dan Mie Basah Di
Kecamatan Ciasem Tahun 2018. Journal of Chemical
Information and Modeling.
Gustiani, E. 2009. Pengendalian Cemaran Mikroba Pada
Bahan Pangan Asal Ternak (Daging Dan Susu) Mulai
Dari Peternakan Sampai Dihidangkan. Jurnal Litbang
Pertanian 28 (80): 96–100.
Lusiana B., Desni R., Asra R. 2020. Asian Journal of
Pharmaceutical Research and Development. Asian
Journal of Pharmaceutical Research and Development
Open 8 (9): 10–19.
Mutmainah, L. 2018. The Role of Religiosity, Halal
Awareness, Purchase Intention of Halal Food Halal
Certification, and Food Ingredients on Purchase
Intention of Halal Food. Journal of Islamic Economics,
Finance, and Banking 1 (0274): 2622–4798.
Nees, C., Blume N., Wardatun S., Rustiani E, Alfiani N.,
Rissani D. 2017. Study Effect Type of Extraction
Method And Type of Solvent To Cinnamaldehyde and
Trans-Cinnamic Acid Dry Extract Cinnamon. J Young
Pharm 9 (1): 49–51. https://doi.org/10.5530/jyp.2017.
Rohman, A., Triyana K., Sismindari S., Erwanto Y. 2012.
Differentiation of Lard and Other Animal Fats Based on
Triacylglycerols Composition and Principal
Analysis of Kwetiau Adulterated with Lard: Case Study of Effect of Sample Weight and Concentration of n-hexane as Solvent
609

Component Analysis Fourier Transform Infrared
Spectroscopy Applied for Rapid Analysis of Lard in
Palm Oil. International Food Research Journal 19
(January): 1161–65.
Salehudin, I. 2014. Halal Literacy : A Concept Exploration
and Measurement Validation. SSRN Electronic Journal
1 (June 2010): 1–21.
https://doi.org/10.2139/ssrn.2004762.
Satriavi, K., Wulandari Y.B.P., Subagyo, R., Prastowo S.,
Widyas N. 2013. Estimasi Parameter Genetik Induk
Babi Landrace Berdasarkan Sifat Litter Size Dan Bobot
Lahir Keturunannya. Tropical Animal Husbandry 2 (1):
28–33.
Taufik, M., Ardilla D., Ghozal A, Sinaga S.M. 2018. Total
Plate Count Analysis Of Tuna Fish Adulterated With
Lard In Order To Improve Halal Products Analysis.
Journal of Pharmaceutical an Sciences 1 (1): 7–15.
Taufik, M., Cahyady B., Ardilla D, Alfian Z., Rid Wanto,
Daulay S., Savitri R.R., Pratiwi F., Susilawati E. 2021.
Nicotine Separation from the Urine of Active Smokers
Using Moringa Oleifera on Column Chromatography
Nicotine Separation from W He Urine of Active
Smokers 8 Sing Moringa Oleifera on Column
Chromatography. AIP Conference Proceedings 020007
(April): 1–10.
Taufik, M., Wanto R., Cibro S.R, Ardilla D., Razali M.,
Tarigan D.M. 2017. Studi Pendahuluan Maserasi
Coupling Elektosintesis Dalam Mengekstraksi Nikotin
Yang Terkandung Dalam Puntung Rokok. Prosiding
Seminar Nasional Kimia Unmul, 182–90.
Yanty, N A M, J M N Marikkar, Y B Che Man, K Long.
2018. “Composition and Thermal Analysis of Lard
Stearin and Lard Olein.” Journal of Oleo Science 7
(July 2011): 333–38.
https://doi.org/10.5650/jos.60.333.
IMC-SciMath 2019 - The International MIPAnet Conference on Science and Mathematics (IMC-SciMath)
610
