
Tidal Analysis for Planning the Tidal Flood Management and the
Moveable Weir, Case Study in Parit River, Kawunganten Cilacap
Nazariano Rahman Wahyudi
1
, Henny Pratiwi Adi
2
, Slamet Imam Wahyudi
2
and Suntoyo
1
1
Department of Ocean Engineering, Institut Teknologi Sepuluh Nopember, Surabaya, Indonesia
2
Department of Civil Engineering, Universitas Islam Sultan Agung, Semarang, Indonesia
Keywords: Tidal Flood, Water Sea Level, Observation, Analysis.
Abstract: The seawater level always rises globally. Sea level rise has an impact on human life. One of the effects of
rising sea levels is the tidal flood which is one of the adverse natural phenomena. Kawunganten District,
Cilacap Regency is one of the areas affected by the tidal flood. The construction of the moveable dam is a
solution to prevent damage to the region due to tidal flooding. In carrying out dam design planning required
accurate tidal data. This study aims to obtain data and analysis of tides along the river to the river mouth. In
determining tidal data, observations are made using an automatic survey tool called DIVER. The tidal analysis
is done by applying the least square method to obtain the tidal harmonic constant at the study site. Base on
observation data for 75 days, the results of tidal data analysis as a reference for planning flood management
and moveable. The analysis gives the value of MSL (Mean Sea Level) of 0,996 m, MHWS (Mean High Water
Spring) of 1,7 m, MLWS (Mean Low Water Spring) of 0,292 m, HHWS (Highest High Water Spring) of
1,992 m and LLWS (Lowest Low Water Spring) of 0,00 m as elevation reference for the infrastructure
development.
1 INTRODUCTION
Indonesia has diverse water characteristics. The
diversity of waters in Indonesia is due to Indonesia's
geographical condition which consists of various
kinds of islands. Flood disaster is one of the disasters
that often hit the Indonesian archipelago which has
low land elevation. One type of flood that can provide
many losses in various aspects is tidal flooding. The
parameter that is very influential on the occurrence of
seawater is sea level rise (Yudi R. K. et al., 2017).
Cilacap is one of the districts in Indonesia that is
vulnerable to the occurrence of tidal flood. This is
because the Cilacap area is a lowland area with very
slow soil infiltration capability (Yani and Sumunar,
2019). Cilacap Regency is located in Central Java
Province. Geographically, Cilacap Regency is on the
southern side of Java, which faces the continuation of
the Indian Ocean. The Cilacap district area that was
harmed due to the tidal flood was Ujungmanik
Village, Kawunganten District. This area has a
distance of 16,662 m from the mouth of the Cilacap
river. The tidal flood that occurred in this region came
from the overflow of the Parit river along the
Kawunganten district. Tidal floods reduce social and
economic activities of the people in Kawunganten
sub-district. One of the disturbed community
activities is farming due to tidal floods that have risen
to the ground causing sea water to damage crops in
agricultural and plantation areas. In addition, the
access road used by the community to carry out their
activities was also affected due to sea level rise
reaching the road surface. Housing, places of worship
and schools were also affected by tidal flood that
came from the overflowing moat river. Flood
disasters always have widespread impacts on the
destruction of infrastructure, the environment,
ecosystems and human life (Salami et al.,2017). High
levels of community resilience to flood disasters are
represented at low levels of flood risk (Isa et al.,
2018).
Floods have given various kinds of adverse effects
to the community and therefore preventive measures
are needed to reduce these impacts (Subiyakto et al.,
2019).To overcome the problem of tidal floods, there
are several solutions implemented. The application is
done by structural and non-structural methods
(Wahyudi N. R. et al., 2019). In solving the problem
of tidal flooding that occurred in Kawunganten
Village, it is necessary to apply the structural method.
Wahyudi, N., Adi, H., Wahyudi, S. and Suntoyo, .
Tidal Analysis for Planning the Tidal Flood Management and the Moveable Weir, Case Study in Parit River, Kawunganten Cilacap.
DOI: 10.5220/0010287702810286
In Proceedings of the 7th International Seminar on Ocean and Coastal Engineering, Environmental and Natural Disaster Management (ISOCEEN 2019), pages 281-286
ISBN: 978-989-758-516-6
Copyright
c
2021 by SCITEPRESS – Science and Technology Publications, Lda. All rights reserved
281

The structure needed is a polder system and a door
that will be a solution to solving this problem. The
polder system is effective in reducing the rise in water
level due to tidal flooding and can reduce the risk
caused by tides. Polder system is a technology in
water control that is often applied in various cities
with tidal flood problems. To optimize the
performance of a polder system, it is necessary to
have a good channel for the flow of water (Wahyudi
et al., 2019). In the construction of polder systems,
several infrastructures are needed which include
retention ponds, drainage systems, water pumps, and
dams/floodgates (Nugroho et al., 2016). To develop
infrastructure to handle tidal floods it needs to be
done in cooperation with the management and
mitigation of tidal floods (Adi and Wahyudi, 2018).
In addition to building various types of
infrastructure, parameters are also needed in planning
infrastructure development, so that it can produce
optimal and efficient results (Hunter J. R. et al.,
2017). By considering tidal parameters, it can
determine the number of costs incurred for the
construction of the weir and as a reference for the
amount of weir needed to overcome tidal floods (Hall
et al., 2019). A very important parameter in polder
system planning is tidal. Estimated water levels
within the tidal range are a suitable tool for
environmental management and risk management for
tidal flood disasters (Sadeghian et al., 2016). Tides
have the most dominant influence on the occurrence
of tidal floods in Cilacap. A tide that comes from
downstream across the river to the upstream
direction. The increase in high seawater is increasing
over time due to the influence of global warming that
occurs.
This study aims to obtain primary data in the form
of tidal conditions along the Parit river and Cilacap
waters. The data that has been obtained is analysed to
determine the type of tides. Tidal data is calculated
and analysed to find important heights needed.
Important elevation obtained is adjusted to the weir
planning for handling tidal flooding and as a
consideration in determining the structure of the weir.
2 METHOD
2.1 Water Level Measurement
Data is collected by using the DIVER survey tool.
This tool is equipped with a pressure sensor, so the
measurement of water elevation also takes into
account air pressure. DIVER is a survey tool applying
the principle of measuring water pressure at the
location under study (Eijkelkamp, 2016). To calculate
the water level, the pressure data are calculated using
the following formula:
𝑊𝐶 = 9806.65
𝑃
+𝑃
𝜌.𝑔
(1)
Where WC = Water Column, P = pressure in
cmH
2
O, g = the acceleration due to gravity (9,81
m/s
2
). The water level can be calculated by the
following equation:
𝑊𝐿 = 𝑇𝑂𝐶 −𝐶𝐿 +𝑊𝐶
(2)
Where WL = water level, TOC = pipe depth, CL
= diver depth
Figure 1: DIVER installation scheme.
2.2 Calculation of Tidal Harmonic
Constants
Tidal data is processed using worldtide with the
MATLAB programming language (Boon, 2007). In
the tidal analysis, the least square method is used. The
least-square method is a method for tidal calculations
with the principle of minimizing the tidal elevation
equation so that a simultaneous equation is obtained.
The simultaneous equation is solved using a
numerical method to produce harmonic constants
(Dalpan and Pratomo, 2015). The least square method
is one of the most widely used approaches and
continues to be used in the tidal analysis (Foreman et
al., 2009). The equation used in the least square
method is:
ℎ
()
=ℎ
+
𝑓
𝐻
cos𝜛
𝑡+𝑢
−𝑘
(3)
Where t = time (in hours), ℎ
()
= predicted water
level, ℎ
= average water level, 𝑓
= nodal correction
ISOCEEN 2019 - The 7th International Seminar on Ocean and Coastal Engineering, Environmental and Natural Disaster Management
282
factor for amplitude, 𝐻
= average amplitude in the
nodal cycle (18,6 years), 𝜛
= angular velocity of the
tidal component to j, 𝑢
= odal correction factor for
the phase, 𝑘
= phase lag between the equilibrium tide
at the observation site and the equilibrium tide at
Greenwich at 00.00, 𝑚 = the number of tidal
harmonics to be analysed (Williams, 2013).
Harmonic components that have been calculated
are used as parameters in the calculation of important
tidal elevations. The elevation is useful in analysing
dam planning for the location under study because the
water level is always changing at any time
(Joesidawati et al., 2017). The calculated elevations
are MSL (Mean Sea Level), MHWS (Mean High
Water Spring), MLWS (Mean Low Water Spring),
HHWS (Highest High Water Spring), and LLWS
(Lowest Low Water Spring).
2.3 Tidal Types Calculation
The harmonic component is also used as a tidal type
analysis at this research location. In determining the
type of tides, it is necessary to calculate the value of
formzahl numbers with the following equation:
𝐹=
𝐴
+
𝐴
𝐴
+
𝐴
(4)
Where F = formzahl numbers, 𝐴
and 𝐴
= the
amplitude of a single daily tidal component, 𝐴
and
𝐴
= the amplitude of a double daily tidal
component. classification of tidal types based on the
value of formzahl numbers is divided into 4 types.
Where the classification is a semidiurnal tides (0 <F
<0,25), mixed mainly semidiurnal tides (0,25 <F
<1,5), mixed mainly diurnal tides (1,5 < F <3,0) and
diurnal tides (F> 3,0).
3 RESULTS AND DISCUSSION
3.1 Comparison of Water Level in the
River and the Sea
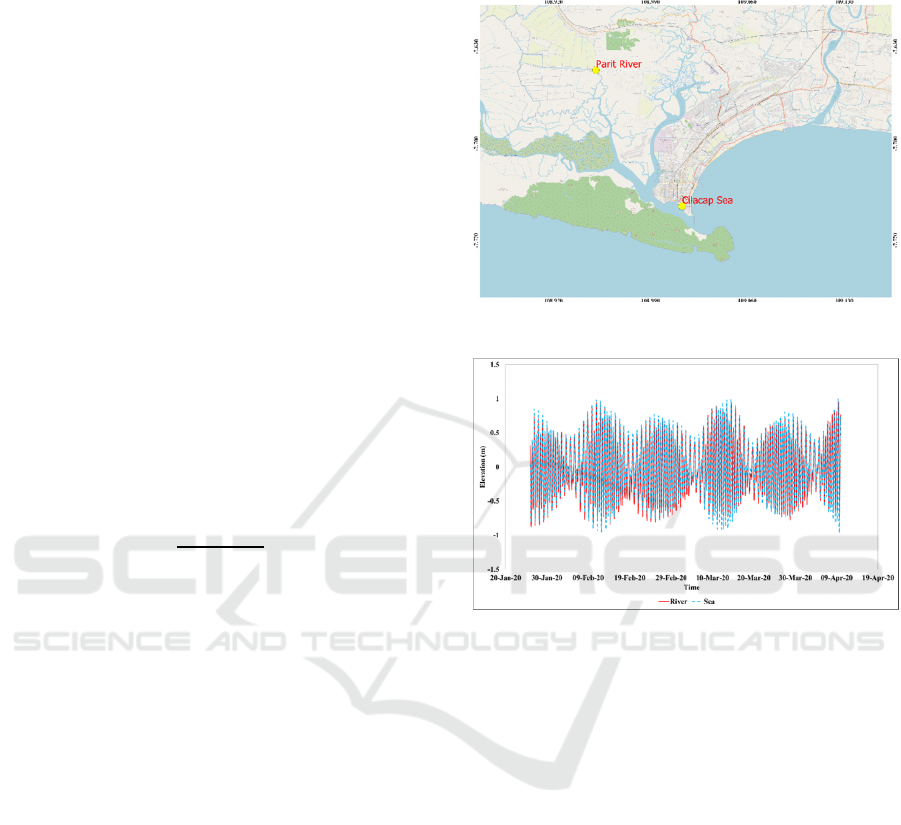
Based on observations that have been made, it is
known that the water elevation value at the study site
is shown in figure 2 for 75 days from January-April
2020. The river observation locations are selected
based on the area planned as tidal flood protection in
Ujungmanik Village. Whereas the observation
location at sea is based on the connectivity of the flow
with the Parit river. The results of river and sea
elevation are compared in graphical form by
equalizing the MSL value in each data. These results
are shown in Figure 3.
Figure 2: Tidal elevation monitoring locations.
Figure 3: Water levels in the Parit River and Teluk Penyu
Beach in Cilacap.
The results in Figure 3 show the different phases
in the water elevation in the Parit river and Cilacap
Bay Coastal Waters. The pattern of movement of tidal
in the two study sites has the same tendency. The sea
level is higher than the river water level. At ebb
condition, the sea level is also dominantly lower than
the river elevation value. This proves that the tidal
conditions at sea affect the elevation of water in the
river. The graph shows the time of the rise and fall of
the water level in the sea is always faster than the
water level in the river. This proves that there are
differences in the tide and ebb levels in water
elevations in rivers and sea.
3.2 Analysis of Least Square Tidal
Results
Data of water elevation in the Parit River for 75 days
previously obtained shown in Figure 4 was calculated
using the least square method. With the least square
method, the results of 9 tidal harmonic constants are
shown in Table 1.
Tidal Analysis for Planning the Tidal Flood Management and the Moveable Weir, Case Study in Parit River, Kawunganten Cilacap
283
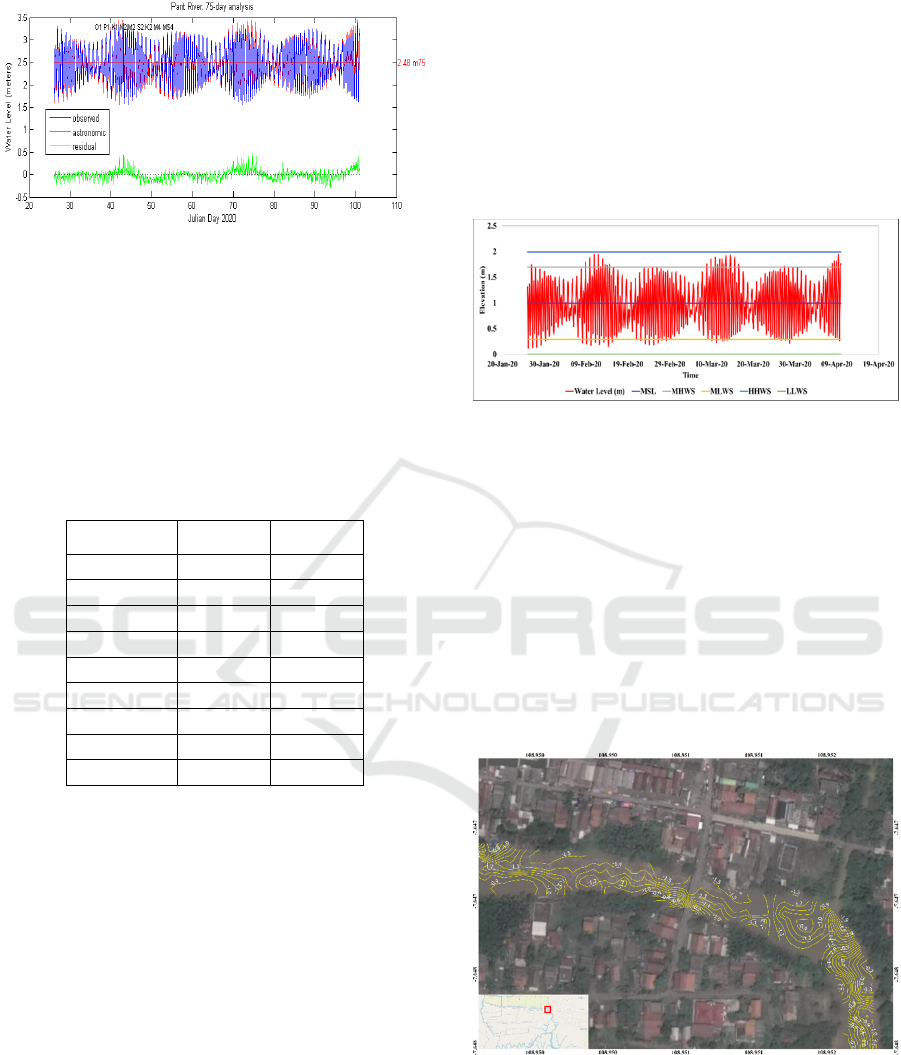
Figure 4: Comparison between observation data and tidal
forecasting results.
Based on the comparison, the graph mentions of
tidal forecasts with primary data obtained, and an
error value of 0,101%. The error value obtained
comes from the least square calculation which ignores
the meteorological influence, so that the astronomical
effect also does not participate in the effect of tidal
generation on the model.
Table 1: Harmonic constants.
Constanta A(m) g
o
M
2
0,457 201,470
S
2
0,247 331,730
N
2
0,088 94,540
K
1
0,179 288,920
O
1
0,113 230,300
M
4
0,037 176,130
MS
4
0,040 309,880
K
2
0,042 134,240
P
1
0,036 306,740
Where A is amplitude and go is a phase. From the
9 harmonic constants that have been obtained in table
1, we get the value of the formzahl number is 0,4148.
With this value, the tidal type at the study site is
classified as a mixed mainly semidiurnal tides
because the value of formzahl numbers ranges from
0,25 <F <1,5. The characteristics of tidal types at this
location occur two times the tide and two times the
tide in a period of 1 day (24 hours). However, the
water level elevation value that occurs is irregular and
has a difference in elevation between two tides and
two ebbs in one day.
From the calculated harmonic constants, we can
get important tidal elevation results at the study site.
MSL (Mean Sea Level) value of 2,48 m, MHWS
(Mean High Water Spring) of 3,184 m, MLWS
(Mean Low Water Spring) of 1,776 m, HHWS
(Highest High Water Spring) of 3,476 m and LLWS
(Lowest Low) Water Spring) of 1,484 m.
In planning LLWS dams it is used as a reference.
So the LLWS value becomes 0. Then the results of
other elevations become MSL (Mean Sea Level)
value of 0.996 m, MHWS (Mean High Water Spring)
of 1.7 m, MLWS (Mean Low Water Spring) of 0.292
m, HHWS (Highest High Water Spring) of 1,992 m
and LLWS (Lowest Low Water Spring) of 0 m. The
tidal graph with reference to +0.00 is LLWS can be
seen in Figure 5.
Figure 5: The water level in the parit river LLWS= 0.
3.3 Infrastructure Analysis with Tidal
Elevations
Peil Scale as a tidal reference is placed under the
bridge. The bridge's elevation based on Peil Scale is
+4,20 m. Based on the receding elevation, the bridge
floor elevation is around +2.72 or around 70 cm from
HHWS. One function of tidal observation and
analysis is to determine the +0.00 LLWS elevation
used as a reference for bathymetry measurements.
The results of bathymetry measurements can be seen
in Figure 6.
Figure 6: Bathymetry in research location LLWS= 0.
Based on observations of the plains along the Parit
river ranging from +1.00 to + 2.00, so that when the
tides are experiencing tidal inundation as shown in
Figure 7.
ISOCEEN 2019 - The 7th International Seminar on Ocean and Coastal Engineering, Environmental and Natural Disaster Management
284

Figure 7: Tidal flood affected areas.
Based on the results of tidal measurements and
analysis, the elevation of water structures including
weirs, embankment, and floodgates can be determined.
Assuming a maximum tidal height of 1,99 m, the
height of the water structure plus a freeboard (guard
height), for example for embankment and weir is added
1,0 m or about = + 3,0 m.
4 CONCLUSIONS
1. Tides and ebb elevations of water at sea are
always faster than elevations of water in rivers.
This proves that there are differences in the tide
and ebb levels in water elevations in rivers and
seas. The sea level is dominantly higher than in
rivers. Therefore tidal conditions in the sea affect
the occurrence of tidal floods that occur to the
inhabitants along the river area.
2. Formzahl numbers obtained from tidal analysis
in the Parit River amounted to 0,4148, from this
value known tidal types at the study site are
classified as mixed mainly semidiurnal tides
because the value of formzahl numbers ranges
from 0,25 <F <1,5.
3. Tidal elevation obtained from the calculation of
harmonic constants is the MSL (Mean Sea Level)
Value of 0,996 m, MHWS (Mean High Water
Spring) of 1,7 m, MLWS (Mean Low Water
Spring) of 0,292 m, HHWS (Highest High Water
Spring) of 1,992 m and LLWS (Lowest Low
Water Spring) of 0 m.
4. The bridge's elevation based on Peil Scale is +4,20
m. Based on the receding elevation, the bridge
floor elevation is around +2.72 or around 70 cm
from HHWS. So in determining the height of the
weir can be used +3.0 m elevation to prevent high
tides flowing through the Parit River.
ACKNOWLEDGEMENTS
Our gratitude goes to the Directorate of Research and
Community Service, the Indonesian Ministry of
Research, Technology and Higher Education for
funding this research, we also thank all the residents
and officials of the Ujungmanik village involved, and
all the stakeholders who have supported and
participated.
REFERENCES
Adi, H. P., & Wahyudi, S. I., 2018. Tidal Flood Handling
through Community Participation in Drainage
Management System ( A case study of the first water
board in Indonesia ). International Journal of Integrated
Engineering, Special Issue 2018: Civil &
Environmental Engineering, 10, 19–23.
Boon, J. D., and Consultant, M., 2007. WORLD TIDES.
Dalpan, E., Pratomo, A., Adil, I., 2015. Analisis Pasang
Surut di Dermaga Sungai Enam Kijang Kabupaten
Bintan Provinsi Kepulauan Riau. In laporan Skirpsi
(pp. 1–11).
Eijkelkamp: Soil and Water., 2016. Product Manual: Diver.
Retrieved from www.vanessen.com/manuals
Foreman, M. G. G., Cherniawsky, J. Y., & Ballantyne, V.
A., 2009. Versatile harmonic tidal analysis:
Improvements and applications. Journal of
Atmospheric and Oceanic Technology, 26(4), 806–817.
https://doi.org/10.1175/2008JTECHO615.1.
Hall, J. W., Harvey, H., & Manning, L. J., 2019. Adaptation
thresholds and pathways for tidal flood risk
management in London. Climate Risk Management,
24(April), 42–58. https://doi.org/10.1016/j.crm.2019.
04.001.
Hunter, J. R., Woodworth, P. L., Wahl, T., & Nicholls, R.
J., 2017. Using global tide gauge data to validate and
improve the representation of extreme sea levels in
flood impact studies. Global and Planetary Change,
156, 34–45. https://doi.org/10.1016/j.gloplacha.2017.
06.007.
Isa, M., Sugiyanto, F. X., & Susilowati, I., 2018.
Community resilience to floods in the coastal zone for
disaster risk reduction. Jamba: Journal of Disaster Risk
Studies, 10(1), 1–7. https://doi.org/10.4102/jamba.v10
i1.356.
Joesidawati, M. I., Suntoyo, Wahyudi, & Sambodho, K.,
2017. Sea Level Rise on Tuban Coast in East Java and
its Consistenty with MAGICC/SCENGEN Prediction.
Applied Mechanics and Materials, 862, 83–89. https://
doi.org/10.4028/www.scientific.net/amm.862.83.
Nugroho, H., Kurniani, D., Asiska, M., & Nuraini, N.,
2016. Kajian Kinerja Sistem Polder sebagai Model
Pengembangan Drainase Kota Semarang Bagian
Bawah dengan Balanced Scorecard. Media Komunikasi
Teknik Sipil, 22(1), 43. https://doi.org/10.14710/
mkts.v22i1.12508.
Tidal Analysis for Planning the Tidal Flood Management and the Moveable Weir, Case Study in Parit River, Kawunganten Cilacap
285

Sadeghian, M. S., Salarijazi, M., Ahmadianfar, I., Heydari,
M., 2016. Stage-Discharge relationship in tidal rivers
for tidal flood condition. Fresenius Environmental
Bulletin, 25(10), 4111–4117. https://doi.org/https://
www.academia.edu/28947059/Stagedischarge_Relatio
nship_In_Tidal_Rivers_For_Tidal_Flood_Condition.
Salami, R. O., von Meding, J. K., & Giggins, H., 2017.
Urban settlements’ vulnerability to flood risks in
african cities: A conceptual framework. Jamba: Journal
of Disaster Risk Studies, 9(1), 1–9.
https://doi.org/10.4102/jamba.v9i1.370.
Subiyakto, R., Suwitri, S., Larasati, E., & Prayitno, P.,
2019. Implementation Flood Disaster Policy base
Community in Cilacap Regency, Central Java Province,
Indonesia. Prizren Social Science Journal, 3(2), 50.
https://doi.org/10.32936/pssj.v3i2.96.
Wahyudi, N. R., Wahyudi S. I., Husni, F., 2019. Wave
Simulation to Compare Existing and Extended Jetty in
River Estuary, Pekalongan, Central Java, Indonesia. In
Advances in Engineering Research (pp. 127–131). Atla.
Wahyudi, S. I., Adi, H. P., Lekerkerk, J., Bakker, L., Van
de Ven, M., Vermeer, D., & Adnan, M. S., 2019.
Assessment of polder system drainage experimentation
performance related to tidal floods in Mulyorejo,
Pekalongan, Indonesia. International Journal of
Integrated Engineering. Retrieved from
http://www.scopus.com/inward/record.url?eid=2-s2.0-
85078084388&partnerID=MN8TOARS.
Williams, S. J., 2013. Sea-Level Rise Implications for
Coastal Regions. Journal of Coastal Research, 63.
https://doi.org/10.2112/SI63-015.1.
Yani, R. D. F., & Sumunar, D. R. S., 2019. Track and
Record Flood Disasters through Modeling Disaster.
IOP Conference Series: Earth and Environmental
Science, 271(1). https://doi.org/10.1088/1755-1315/
271/1/012020.
Yudi, R. K., Nugroho, A. M., Darsono, S., Wulandari, D.
A., 2017. Perencanaan Sistem Polder Wilayah
Semarang Timur. Jurnal Karya Teknik Sipil, 6(2), 265–
275. Retrieved from http://ejournal-s1.undip.ac.id/
index.php/jkts.
ISOCEEN 2019 - The 7th International Seminar on Ocean and Coastal Engineering, Environmental and Natural Disaster Management
286
