
Distribution of Current and Temperature at Welang Estuary,
Pasuruan
Inayatul Lailiyah
1
, Suntoyo
1
, Wahyudi
1
, Fauzy Nasruddin
2
and Liliane Geerling
3
1
Department of Ocean Engineering, Faculty of Marine Technology, Institut Teknologi Sepuluh Nopember (ITS),
60111 Surabaya, Indonesia
2
Department of Water Resource Management, Public Works and Water Source East Java Province, Surabaya, Indonesia
3
Delta Academy, Water Management, HZ University of Applied Sciences, Middelburg, 4331 NB, The Netherlands
Keywords: Estuary, Temperature Distribution, Current Velocity, 3D Modelling, Welang River.
Abstract: Welang river estuary has many benefits to the surrounding community, i.e for the fish and shrimp farming.
Estuary ecological management in this area is important. In which, it is necessary to understand the dynamics
of the waters so that the estuary area can be managed properly. The purpose of this study was to determine
the characteristics of the welang estuary using 3D modeling. Welang river estuary influenced by tidal
conditions. The current pattern that occurs in the welang estuary moves from southeast to northwest. Current
velocity around the welang estuary at the surface of the water tends to be greater than at the bottom of the
water. This is because of the influence of the wind. The horizontal temperature distribution tends to be uniform
and vertically shows no thermocline layer at the welang estuary.
1 INTRODUCTION
The coastal region of Indonesia has a fairly extensive
estuary area, one of which is on the north coast of
Java, some researchers have studied related to the
estuary environment in several locations, e.g.,
Porong, Wonorejo and Wonokromo river. (Suntoyo
et al., 2015; Suntoyo and Sakinah, 2017; Sakinah et
al., 2017; Pahlewi et al., 2017; Kauhl et al., 2018).
Welang watershed is located in Malang Regency,
Regency and Pasuruan City. The Welang River
empties into the Kraton Subdistrict, Pasuruan
Regency which is directly related to the Madura Strait
(Febriyanto et. al., 2018). Welang estuary is an
estuary ecosystem that has an important function as a
biota habitat, such as fish. In addition, this area is used
by local residents as fish and shrimp ponds. The more
activities that occur in estuary areas, the area will
have an influence on the quality of estuarine waters,
directly or indirectly.
Until now, some informations regarding the
characteristics of the welang estuary is currently
limited. So the need for further research in the estuary
area to be able to develop its designation, such as
ports, transportation routes, tourist areas and fish
farming. The characteristics of flow patterns,
temperature and salinity are important parameters in
water dynamics that have an influence on water
circulation (Pahlewi et. al., 2017; Suntoyo and
Sakinah, 2017; Sakinah et al., 2017).
Determination of estuary type is the initial stage in
carrying out development planning in the estuary by
taking into account its characteristics such as current,
temperature and salinity. Therefore the purpose of this
study is to analyze the characteristics of the waters in
the welang estuary based on the parameters of current,
temperature and salinity and can determine the type of
estuary in the estuary of the Welang.
Current and temperature distribution were
modeled by using 3-dimensional models in order to
explain the distribution horizontally and vertically.
Furthermore, these results was analyzed to explain
the characteristics of Welang estuary waters.
2 STUDY AREA
The research location is in the Welang River estuary
in the Kraton and Ketug Pasuruan Districts. Welang
River itself crosses Malang Regency, Pasuruan
Regency and Pasuruan City, East Java Province
empties into Madura Strait.
Lailiyah, I., Suntoyo, ., Wahyudi, ., Nasruddin, F. and Geerling, L.
Distribution of Current and Temperature at Welang Estuary, Pasuruan.
DOI: 10.5220/0010218802570262
In Proceedings of the 7th International Seminar on Ocean and Coastal Engineering, Environmental and Natural Disaster Management (ISOCEEN 2019), pages 257-262
ISBN: 978-989-758-516-6
Copyright
c
2021 by SCITEPRESS – Science and Technology Publications, Lda. All rights reserved
257
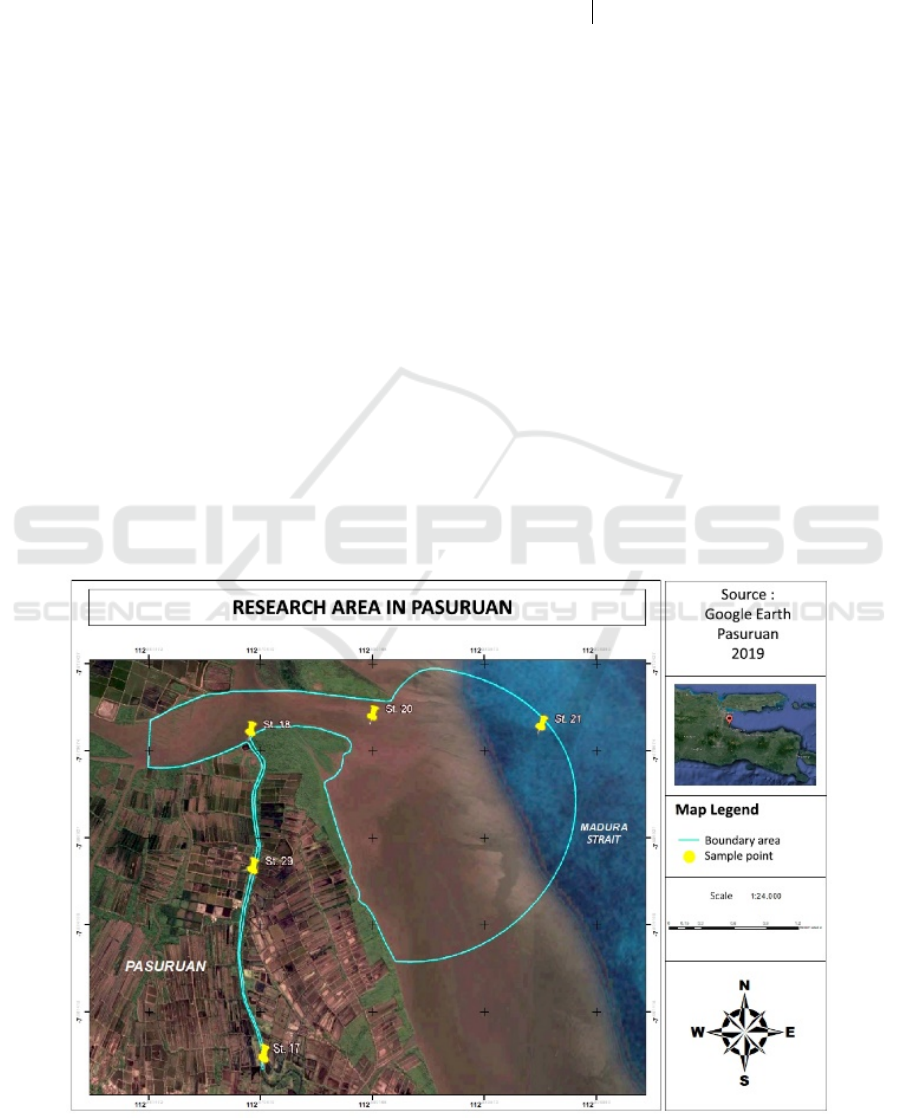
The modeling location in this study is shown in
Figure 1, where the blue area indicates the modeling
area. Direct measurements consist of current,
temperature and salinity carried out at 5 sampling
stations with 3 different depths (0.2d, 0.6d and 0.8d).
The model simulation was carried out for 6 months,
from July 2019 to January 2020. Geographically, the
Welang Estuary is located at 112,861⁰E - 112,896⁰E
and 7,584⁰S -7,590⁰S.
3 METHOD
The methodology used in this research, the first step
is the study of literature to support the study to be
carried out, followed by the collection of data which
includes primary data and secondary data. Primary
data were obtained by performing direct
measurements in the field which included
temperature, flow velocity and salinity data. Whereas
secondary data was obtained from various related
agencies and this data used for input simulation
models such as bathymetry, tides, wind, and river
discharge data. After data collection, the next step is
to process bathymetry data which will become input
data in the simulation of current and temperature
distribution using 3D modeling where the output is
current and horizontal and vertical temperature
distribution. Modeling and simulation was done using
computer software with a simulation time of 30 days
or 720 hours in November 2019, to obtain the good
results, the model validation was conducted. Then
analyze the res ults and finally conclusions.
4 MODEL VALIDATION
The results of the modeling of the current pattern are
validated using tidal data obtained from measurement
results on November 1, 2019 - December 1, 2019 at
the Grati Power Plant and the current velocity
measured at point St 21 (Figure 2) by using current
meter. In general, the results of the model and
measurement data show a trend that is equal to the
MAPE (Mean Absolute Percentage Error) value of
0.35% (Figure 3). Current measurements are carried
out on 14 November 2019 at 12.00-21.00 WIB within
all three depths (0.2d, 0.6d, and 0.8d) using a current
meter (Figure 4). The results of the current velocity
from the three depths are then averaged. The results
of the current validation at point St 21 show a MAPE
value of 27.5%, while the RMSE value is below 1.00.
Model validation is acceptable because the error is
still below 30%. The validation of current velocity
modeling is classified as Reasonable forecasting.
Figure 1: Study Area Including of Observational Stations (Google Earth).
ISOCEEN 2019 - The 7th International Seminar on Ocean and Coastal Engineering, Environmental and Natural Disaster Management
258
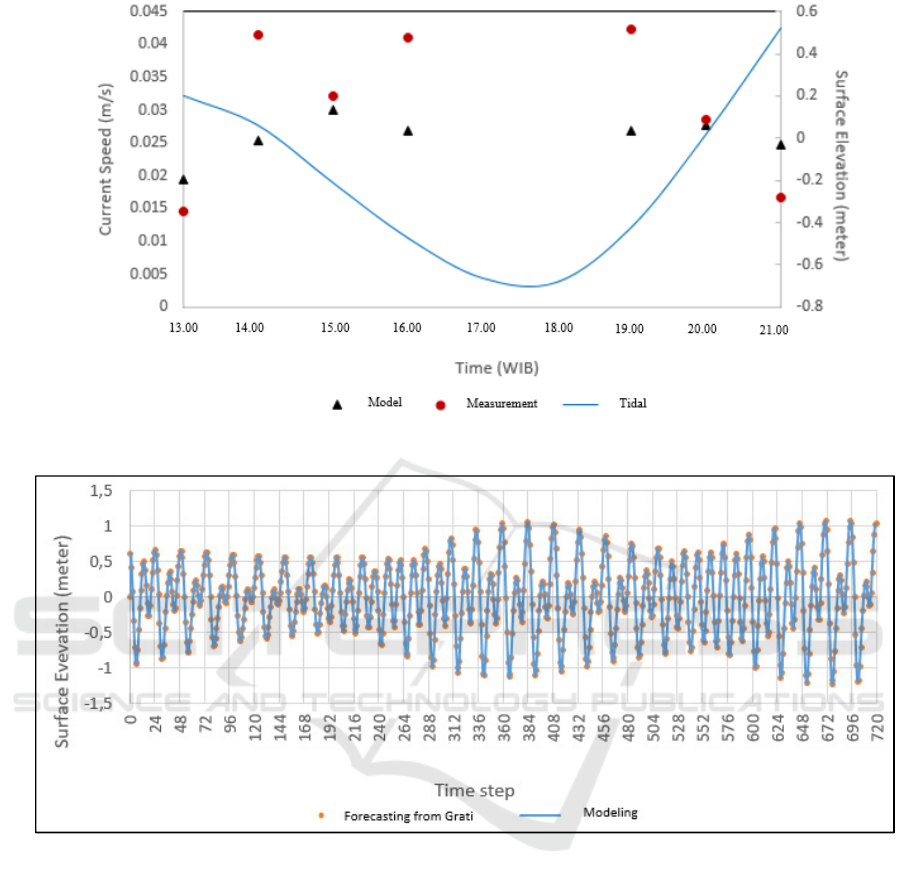
Figure 2: Validation of Current Velocity at Point St 21.
Figure 3: Comparison of Tidal Elevations between Forecasting Data and Model Results.
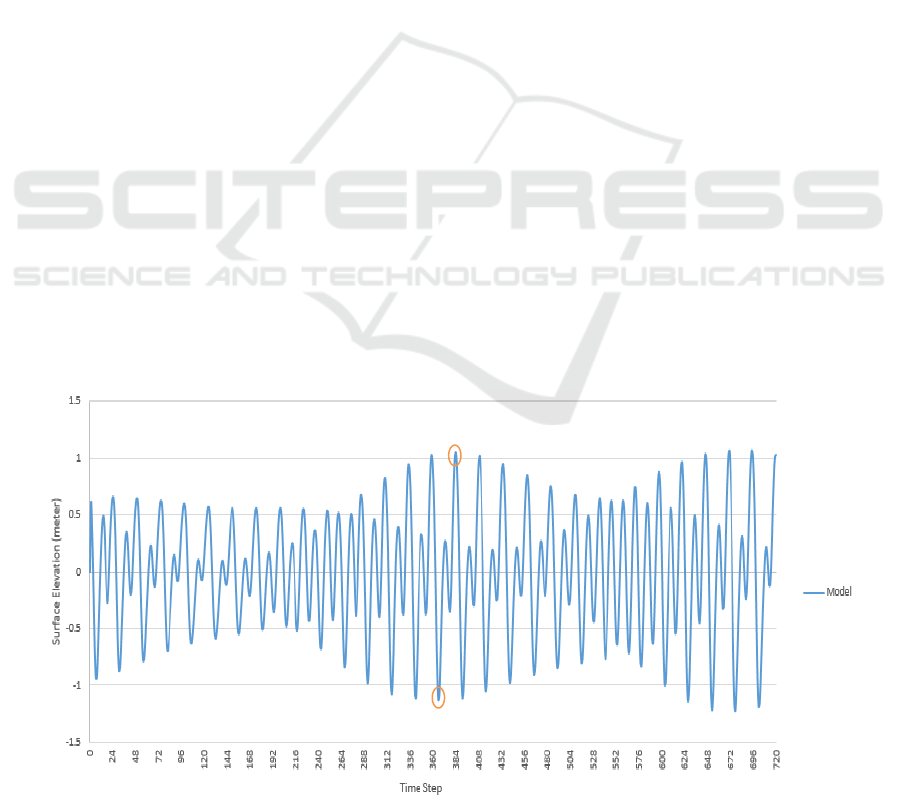
5 RESULTS AND DISCUSSION
The modeling results presented in this paper are the
horizontal and vertical distribution of velocity and
temperature. From the simulation results, the sea level
with the highest tide is 1.052 m in step 384, while the
lowest tide with -1.132 m in step 366. Where the
highest tide conditions occur on November 17, 2019
at 00.00 WIB and the lowest tides occur on November
16, 2019 at 06.00 WIB. Based on tidal data analysis,
the Welang estuary is a valid semi-diurnal tidal type
(Figure 4).
At highest tide conditions, the current pattern
moves from southeast to west toward the estuary,
while the current pattern at lowest ebb moves east
towards the sea. The frequency of the direction
current is more dominant in the west-northwest
direction, this is due to the east monsoon wind pattern
as well as shown by (Sugianto, 2009). The current
velocity at point 18 show that the highest tide occurs
between 0-0,06 m/s and the lowest tidal current
between 0.015-0.105 m/s presented in Figure 5.A and
5B. The current velocity at the highest tide tends to
be lower than at lowest ebb. The Reason is at high
tide, seawater moves into the river and at the same
time, the river water pushes upstream. At lowest ebb,
currents tend to be higher because the water just
Distribution of Current and Temperature at Welang Estuary, Pasuruan
259
pushes out towards the river mouth and increases the
current velocity.
From the distribution of current at the highest tide
and lowest ebb shows that the value of the current
speed at the top is greater than at the bottom of the
waters. this is due to the effect of the wind coming
from the southeast as well as the bottom shear stress
reduced the velocity in the sea bottom (Figure 6).
In the vertical distribution, reviewed at 2 points
namely point IP1 and IP2 (see Figure 7) which are
around the point 18 estuary. Current distribution at
the highest tide conditions (384 step), at a distance of
0-80 m from IP 1, the speed current is varies from
surface to bottom waters. On the surface the current
velocity ranges from 0.008 to 0.096 m/s while the
current velocity at the bottom of the waters is around
0.008-0.072 m/s. at a distance of 80-220 m, uniform
current velocity distribution from surface to bottom.
Where the current speed is around 0-0.016 m/s
(Figure 8 A.).
Current distribution at the lowest ebb condition
(step 366), at a distance of 0-80 m from IP 1, the
current speed is varies from surface to bottom of the
waters. On the surface the current speed ranges from
0.048-0.120 m/s. while at the bottom of the waters,
the current speed is around 0-0,024 m/s. At a distance
of 80-220 m, the current surface velocity values are
around 0-0,048 m/s and at the bottom of the waters
the current speed is around 0-0,032 m/s (Figure 8.B).
At the highest tide conditions, high temperatures
from the sea towards the river mouth. The
temperature in the river body area ranges from 30.10-
30.50 °C. Whereas in river mouths the temperature is
around 30.55-30.65 °C, and at sea temperatures
above 30.65 °C (Figure 9.A.). The pattern of
temperature distribution at the lowest ebb conditions
shown in Figure 9.B. In the river body area, the
temperature value is around 30.10-30.2 ° C, while the
temperature value in the river mouth area is around
30.2-30.45 ° C and in the sea area the temperature
value is around 30.5-30.7 ° C.
Overall the temperature at highest tide in the
estuary area is caused by the push coming from the
sea which has high temperature. Whereas at lowest
ebb the temperature in the estuary tends to be low
because at ebb the flow is only influenced by the river
discharger that goes to the sea, so that the temperature
carried from the upstream of the river is low towards
the sea gives the effect of decreasing the temperature
in the estuary to the sea
The distribution of temperature at the highest tide
conditions at a distance of 0-20 meters, the
temperature value is around 30.58-30.61 ° C. at a
distance of 20-210 meters the temperature value is
around 30.61-30.64 ° C and the temperature value at
a distance of 210-280 meters is around 30.64-30.67 °
C (Figure 9.A). The distribution of temperature at the
lowest ebb conditions at a distance of 0-110 meters
around 30.25-30.28 ° C, while at a distance of 110-
220 meters the temperature value tends to vary at
around 30.31-30.52 ° C (Figure 9.B).
In general, the vertical temperature distribution
pattern in both conditions in the welang estuary tends
to be uniform from top to bottom. Although the value
of the surface layer is greater than the middle and base
layers. This is due to the influence of direct sunlight.
Distribution of temperature from surface to base there
is no thermocline layer. This is because in this area
including shallow water so the temperature tends to
be uniform as well as shown by (Alosairi et al. 2018).
Figure 4: Water Suface Elevation.
Highest tide
Lowest ebb
ISOCEEN 2019 - The 7th International Seminar on Ocean and Coastal Engineering, Environmental and Natural Disaster Management
260
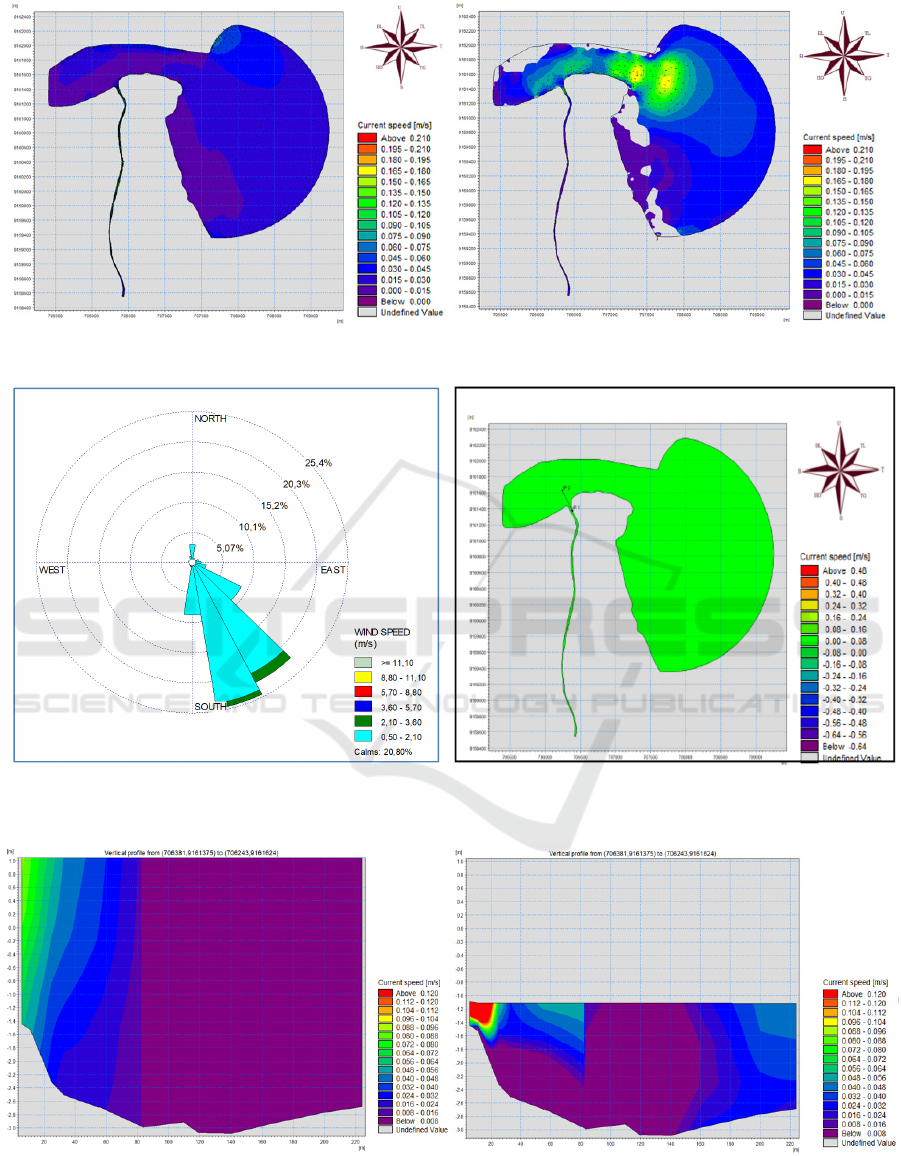
Figure 5: Horizontal Current Distribution in A: the Highest Tide, B: the Lowest Ebb.
Figure 6: Wind Rose Direction and Speed Current
Distribution.
Figure 7: Position IP1 and IP2 Cross-section.
Figure 8: Horizontal Temperature Distribution in A: the Highest Tide, B: the Lowest Ebb.
A
B
A
B
Distribution of Current and Temperature at Welang Estuary, Pasuruan
261
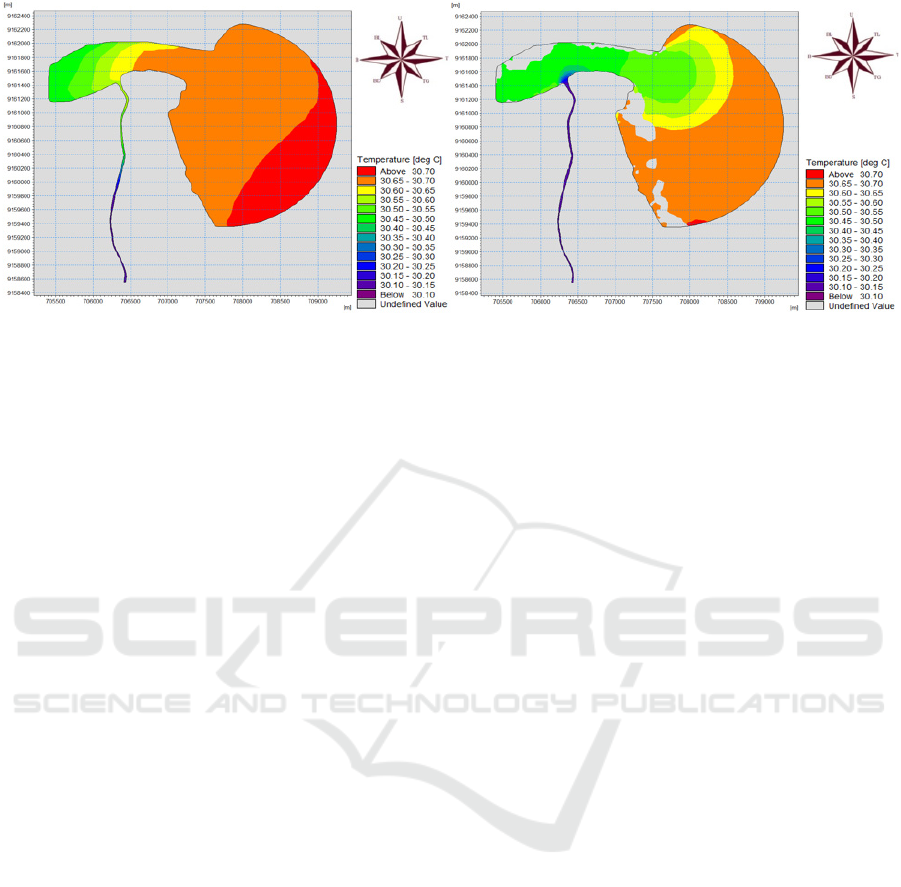
Figure 9: Horizontal Temperature Distribution in A: the Highest Tide, B: the Lowest Ebb.
6 CONCLUSION
The current pattern that occurs in the welang estuary
is moving from the southeast toward the northwest.
The speed current around the welang estuary at the
surface of the water tends to be greater than at the
bottom of the water. This is due to the effect of the
wind. The horizontal temperature distribution tends to
be uniform and vertically shows there is no
thermocline layer in the welang estuary and the
temperature distribution from the surface to the
bottom does not differend so that the distribution is
evenly distributed only slightly higher on the surface
due to direct sunlight so that the surface is hotter
compared to the bottom .
ACKNOWLEDGEMENTS
Authors would like to thank the Centre of Research
and Development of Marine and Coastal Resources,
the Ministry of Marine Affairs and Fisheries,
Republic of Indonesia for providing the facilities of
DHI’s Mike 21/3 model and the Water Resources
Public Works Department of East Java Province for
providing some informations and data related the
Welang River.
REFERENCES
Alosairi, Y. et. al., 2018. Three-dimensional hydrodynamic
modelling study of reverse estuarine circulation:
Kuwait Bay. Marine Pullution Bulletin 127:82-96.
Febriyanto, A., Hidayah, E., Halik, G., 2018. Estimasi
Debit Puncak DAS Welang di Kabupaten Pasuruan.
Jurnal Rekayasa Sipil dan Lingkungan Vol. 2, No. 2:
141-150.
Pratama, Lucky et. a., 2018. Pola Sebaran Salinitas
Menggunakan Metode Numerik di Muara Sungai
Bungin Kabupaten Banyuasin Sumatera Selatan.
Maspari Journal 10(1):9-16.
Sugianto, Denny Nugroho. 2009. Kajian Kondisi
Hidrodinamika (Pasang Surut, Arus, dan Gelombang)
di Perairan Grati Pasuruan Jawa Timur. Ilmu
Kelautan UNDIP vol. 14(2):66-75.
Suntoyo and W Sakinah. 2017. Modelling of Phenol
Contamination in Wonorejo Estuary, Indonesia. IOP
Conference Series: Earth and Environmental Science,
Volume 79, Issue 1, pp. 012005.
Suntoyo, Hasan Ikhwani, Muhammad Zikra, Noverina Ayu
Sukmasari, Gita Angraeni, Hitoshi Tanaka, Makoto
Umeda, Suichi Kure. 2015. Modelling of the COD,
TSS, Phosphate and Nitrate Distribution Due to the
Sidoardjo Mud Flow into Porong River Estuary,
Procedia Earth and Planetary Science – Elsevier, Vol.
14, pp. 144-151.
W. Sakinah, Suntoyo, Mukhtasor. 2017. "Impact
Identification of Estuarine Water Quality to Marine
Biota: A Case Study in Wonorejo Estuary, Indonesia",
Applied Mechanics and Materials, Vol. 862, pp. 96-
101. 10.4028/www.scientific.net/AMM.862.96
A. D. Pahlewi, Suntoyo, Wahyudi, M. Taufik. 2017.
"Characteristics of Temperature and Salinity
Distribution in the Wonorejo Estuary, Surabaya, Based
on Field Measurement", Applied Mechanics and
Materials, Vol. 862, pp. 102-106. 10.4028/
www.scientific.net/AMM.862.102.
Kauhl, L., Lambregts, K., Suntoyo, 2018. A comparison of
the water quality between the mangrove areas
Mulyorejo and Wonorejo, in: MATEC Web of
Conferences. EDP Sciences. https://doi.org/10.1051/
matecconf/201817701014.
A
B
ISOCEEN 2019 - The 7th International Seminar on Ocean and Coastal Engineering, Environmental and Natural Disaster Management
262
