
Hydrodynamic Modelling of Flood Inundation on Welang River,
Indonesia
Ilham Cahya and Suntoyo
Department of Ocean Engineering, Faculty of Marine Technology, Institut Teknologi Sepuluh Nopember,
Surabaya 60111, Indonesia
Keywords: A 1D-2D Coupled Hydrodynamic Model, Flood Inundation, Welang River, MIKE FLOOD.
Abstract: A flood inundation in a river can be caused by an increase in river water level due to the addition of water
discharge from both the rainfall and the tides from the sea. Flood inundation simulation can be done by using
a numerical flood model flood model. In the Welang basin, floods occur every year and cause many problems.
Floods that occurred on April 29, 2019, caused the closure of national and regional roads and many houses
that were flooded. In the present study, flood model was carried out by using MIKE FLOOD software. Semare
Village and Tambakrejo Village are critical points where floods occur. The depth of the water from the
simulation model occurs 0.3 m - 2.2 m compared to the flood map report by the Indonesian National Disaster
Management Agency which estimates it at 0.1 m - 1.5 m.
1 INTRODUCTION
The Welang Basin is threatened with flooding every
year. It happened during the rainy season from
December to June. The higher the surface of the river
water from the increasing intensity of rainfall and
rising sea level due to the tide cycle, this results in a
higher risk of flooding. The Welang River has many
tributaries (about 21) with a total watershed area of
509.5 km
2
and a length of about 53 km, so that the
river's water level becomes high when the intensity of
rainfall increases.
(Wahyudi et al., 2018) investigated a method to
apply eco-drainage to control flooding that often
occurs in the Welang river, however, the flood can’t
be predicted how far it can spread of eventhough the
flood affects Pasuruan districts so that flood control
using the method of harvesting rainwater, by using
infiltration ponds requires a large number of wells to
be applied. (Wahyudi and Sumirman, 2019), showed
how the flood management in the Welang basin can
be done by injecting flood water into ground water
using Artificial Storage Recharge (ASR). However,
there have been no studies on two-dimensional flood
inundation models in the Welang River Basin.
MIKE FLOOD 1D-2D coupled model is a
powerful software for integrated hydraulic (1D) –
hydrodynamic (2D) modelling purpose. A lot of
research has been done using MIKE FLOOD 1D-2D
coupled model (e.g., Dat, et al., 2019, CTCN, 2017,
Timbadiya et al., 2014, Kadam and Sen, 2012, Patro
et al., 2008). In the present paper, the existing
condition of flood in the Welang river is simulated by
using the MIKE FLOOD 1D-2D coupled model. The
expected final result is a flooding map.
2 STUDY AREA
The modelling area is located at the downstream of
Welang River. The desired model area is located at
Kraton sub-district, Pohjentrek sub-district (Pasuruan
district), and Gadingrejo sub-district (Pasuruan City)
from Dhompo village to river mouth on the north,
where river levels data is measured at Dhompo
village in the coordinate system (-7.665908 latitude,
112.856342 longitude). The model area showed in
Figure 1 within the red area.
Cahya, I. and Suntoyo, .
Hydrodynamic Modelling of Flood Inundation on Welang River, Indonesia.
DOI: 10.5220/0010218602450250
In Proceedings of the 7th International Seminar on Ocean and Coastal Engineering, Environmental and Natural Disaster Management (ISOCEEN 2019), pages 245-250
ISBN: 978-989-758-516-6
Copyright
c
2021 by SCITEPRESS – Science and Technology Publications, Lda. All rights reserved
245
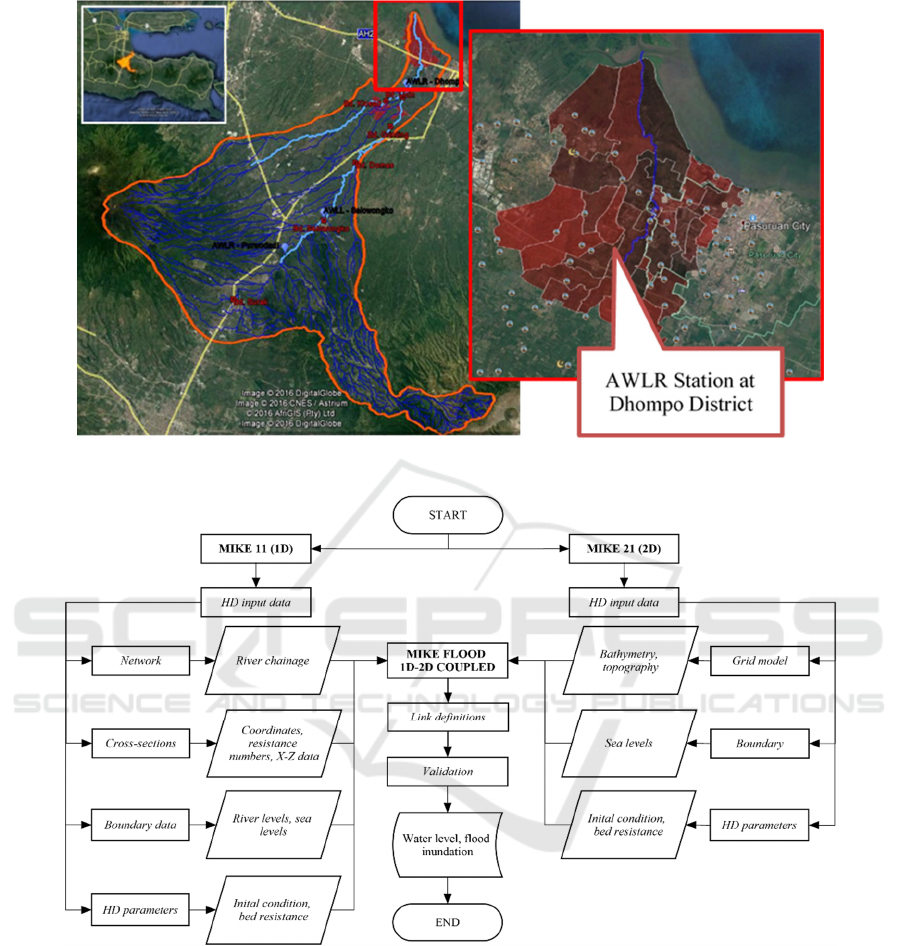
Figure 1: Modelling area of Welang River (Google Earth Pro).
Figure 2: Flow chart of MIKE FLOOD 1D-2D coupled model.
3 METHOD
The methodology applied for solving this problem
consists of the data collection, the model settings on
MIKE 11 1D and MIKE 21 2D, the models added
MIKE FLOOD 1D-2D, and the model validation can
be seen in Figure 2. The MIKE FLOOD 1D-2D
coupled model consists of upstream river surface and
sea level at the river mouth (Figure 3). Hourly river
level data collected for 1 year in 2019 and sea level
forecast data were collected from measurements for
15 days in 2014 in Grati, Pasuruan.
Bathymetry and topography data were collected
from the Indonesian Geospatial Information Agency.
Surface height and cross-section data collected from
the Water Resources Public Works Department of
East Java Province. The model runs from 27 April
2019 11:00 PM and finishes on 29 April 2019 6:00
AM.
ISOCEEN 2019 - The 7th International Seminar on Ocean and Coastal Engineering, Environmental and Natural Disaster Management
246
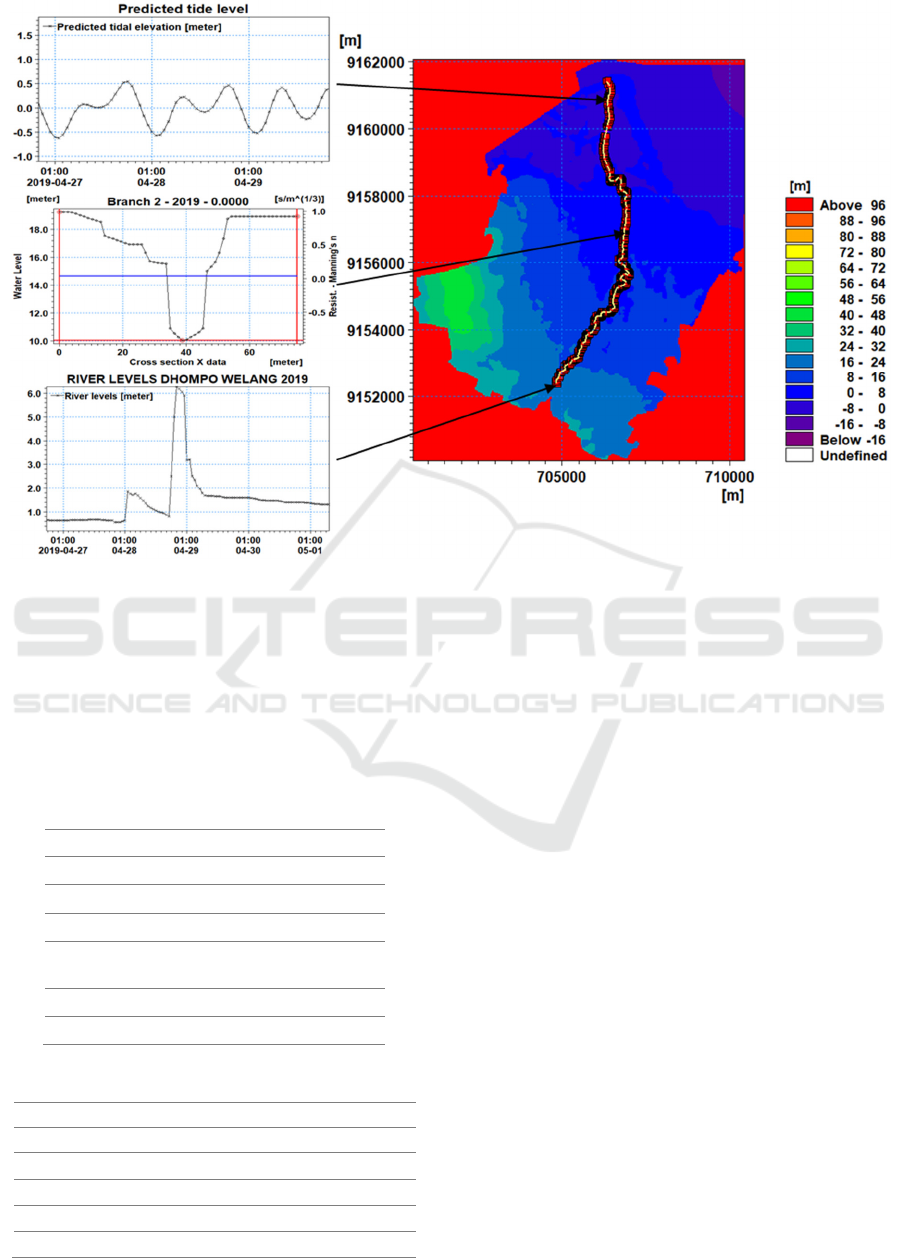
Figure 3: Modelling setup of MIKE FLOOD coupled model.
Manning coefficient is used for determining the
bed roughness parameters. Applied bed roughness
coefficients are divided into river, landuse and sea
bed areas, which use a uniform distribution. The bed
roughness coefficient values are estimated based on
(Chow, 1959) and the MIKE 21 recommendation
summarized in Table 1.
Table 1: Applied Manning number.
Natural stream Manning’s n
River upstream 0.040
River downstream 0.045
Landuse Manning’s M
Vegetation,
natural areas
22
Sea Manning’s M
Seabed 32
Table 2: Average Bed Slope of Welang River.
Area Stations (m) Slope
Dhompo 0 – 1000 0.002408
Sungi Wetan 1000 – 3000 0.001601
Sukorejo 3000 – 5200 0.001890
Tambakrejo 5200 - 6000 0.002657
Semare 6000 – 11400 0.000870
According to the Manning equation, the slope of
the river bed also contributes to the increase in river
water flow and flow discharge. Areas that have a low
slope are at risk of water deposition, causing flooding
to occur. Semare village has a low slope shown in
Table 2. Because the location of the Sumare village
close to the river mouth causes a very high tidal effect
as seen in Figure 4.
Model validation was performed using the flood
map data from National Disaster Management
Authority of Indonesia (BNPB, 2019) shown in
Figure 5.
4 RESULTS AND DISCUSSION
Comparison of flood maps from flood models and
flood map reports from BNPB is shown in Figure 6.
Green polygons represent inundation in Tambakrejo
Village and yellow polygons represent inundation in
Sukorejo Village. At 01:00 28 April 2019, this model
showed good results compared to the flood map
report from BNPB, 2019. The validation process is
carried out through water depth data where the results
of this validation are shown in Table 3.
The time of the flood occurs when the highest tide
is 0.47 m MSL at 20:00 28 April 2019. At 20:00, 28
Hydrodynamic Modelling of Flood Inundation on Welang River, Indonesia
247
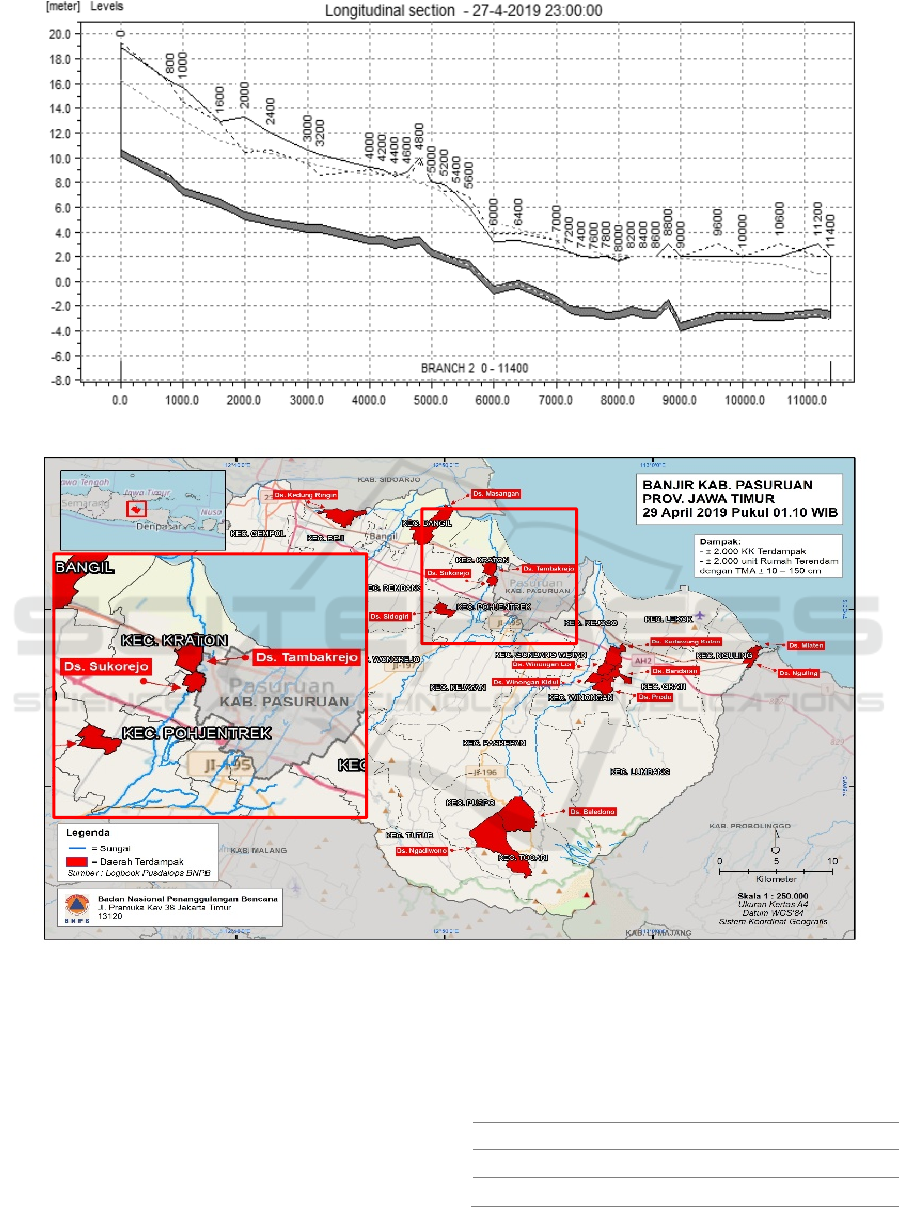
Figure 4: Modelling setup of MIKE FLOOD coupled model.
Figure 5: Flood map report from National Disaster Management Authority of Indonesia, (BNPB, 2019).
April 2019, the surface of the river shows 5 m as
the initial flood time. At 21:00 April 28, 2019, the
highest river water level reached 6.27 m which
occurred at a tidal height of 0.39 m MSL until 0:00
April 29, 2019 with a river height of 5.91 m at tidal
height -0 , 24 m MSL (Figure 7). At 3 am on April 29,
2019, the height of the river did not exceed the height
of the riverbank so that the flood spill subsided.
Figure 7 shows the relationship between river water
level and tidal change when flooding occurs in the
Welang river from the results of a modeling
simulation. However, the temporal variation of flood
map on Welang River has not been examined in
detail, yet.
Table 3: Water depth validation 4/28/19 1:00 AM.
Type Water depth (m)
Model 0.3 – 2.2
BNPB 0.1 – 1.5
ISOCEEN 2019 - The 7th International Seminar on Ocean and Coastal Engineering, Environmental and Natural Disaster Management
248
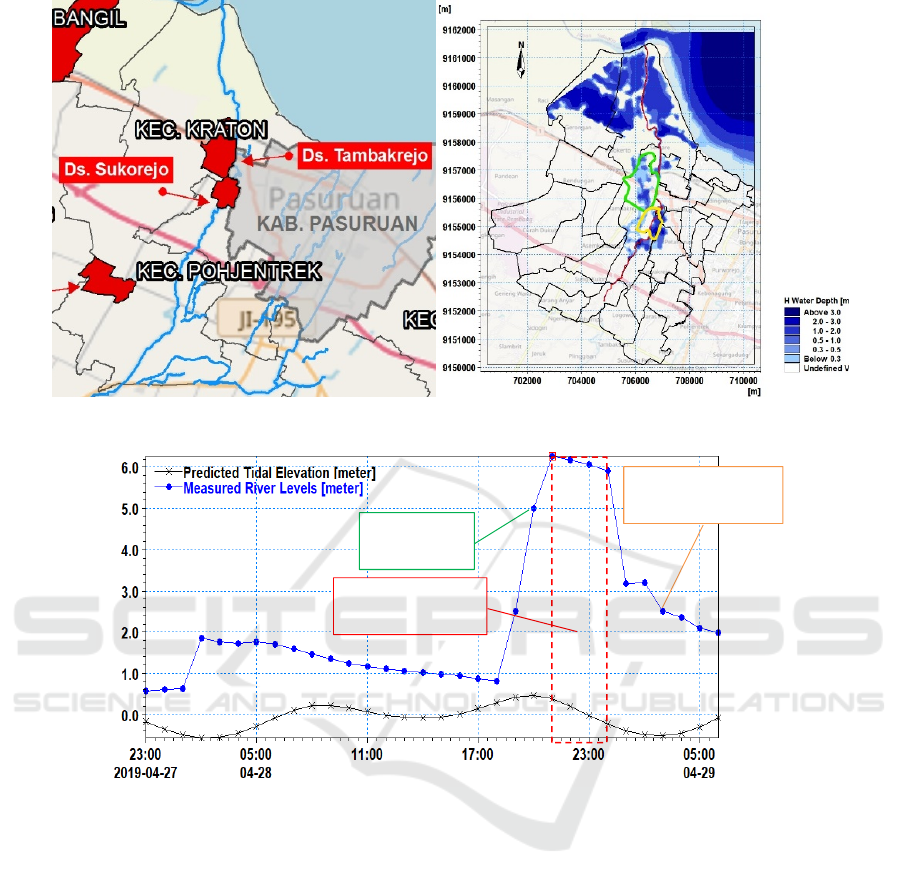
Figure 6: Flood model validation at 1:00 AM 28 April 2019.
Figure 7: The relation of the river levels and tide levels when flood occured on Welang River.
5 CONCLUSION
Based on the modeling results and analysis in the
paper, a few conclusions can be drawn as follows:
1. From the results of the hydrodynamic model it
has been shown the critical point at which floods
begin to overflow. Semare Village and
Tambakrejo Village are critical areas where
floods begin to overflow.
2. This Kali Welang flood modeling simulation is
validated using water level data from the flood
map report of the Indonesian National Disaster
Management Agency (2019), which shows quite
valid results, the simulation model results show
0.3 m - 2.2 m while the data used for this tie tie
is 0.1 m - 1.5 m.
3. River water level 6.27 m occurs during tidal
height 0.39 m MSL until 0:00 April 29, 2019
with river height 5.91 m at tidal height -0.24 m
MSL. At 3 am on April 29, 2019, the height of
the river did not exceed the height of the
riverbank so that the flood spill subsided.
ACKNOWLEDGEMENTS
Authors are grateful for the supported to the Centre of
Research and Development of Marine and Coastal
Resources, the Ministry of Marine Affairs and
Fisheries, Republic of Indonesia for providing the
facilities of DHI’s Mike 21/3 model. And authors also
thank to the Water Resources Public Works
Critical moment
Flood spill eased
Flood start
Hydrodynamic Modelling of Flood Inundation on Welang River, Indonesia
249

Department of East Java Province for providing some
informations and data related the Welang River.
REFERENCES
Chow, V. T., 1959. Open-channel Hydraulics. McGraw-
Hill, New York. 680 pp.
CTCN., 2017. Hydrodynamic modelling for flood
reduction and climate resilient infrastructure
development pathways in Jakarta, Final Substantive
Report. https://www.ctc-n.org/system/files/dossier/3b/
final_substantive_report_indonesia_20150000011.pdf.
(accessed: 5 May 2020).
Dat, T. T., D. Q. Tri, D. D. Truong, N. N. Hoa., 2019. The
Aplication of Mike Flood Model in Inundation
Simulation with the Dam-break Scenarios: a Case
Study of DakDrinh Reservoir in Vietnam, International
Journal of Earth Sciences and Engineering, vol. 12, no.
1, 60-70. doi: 10.21276/ijee.2019.12.0106.
Kadam, P., & Sen, D., 2012. Flood inundation simulation
in Ajoy River using MIKE-FLOOD. ISH Journal of
Hydraulic Engineering, 18(2), 129–141. doi:
10.1080/09715010.2012.695449.
National Disaster Management Authority of Indonesia
(BNPB), 2019. Peta Kejadian Banjir Kabupaten
Pasuruan, Jawa Timur, 29 April 2019.
http://geospasial.bnpb.go.id/2019/04/30/peta-kejadian-
banjir-kab-pasuruan-jawa-timur-29-april-2019/.
(accessed: 5 May 2020).
Patro, S., Chatterjee, C., Mohanty, S., Singh, R.,
Raghuwanshi, N. S., 2009. Flood inundation modeling
using MIKE FLOOD and remote sensing data. Journal
of the Indian Society of Remote Sensing, 37(1), 107–
118. doi: 10.1007/s12524-009-0002-1.
Timbadiya, P. V., Patel, P. L., Porey, P. D., 2015. A 1D–
2D Coupled Hydrodynamic Model for River Flood
Prediction in a Coastal Urban Floodplain. Journal of
Hydrologic Engineering, 20(2), 05014017. doi:
10.1061/(asce)he.1943-5584.0001029.
Wahyudi, H., K. Aziz, Sumirman, E., 2018. Eco Drainage
Implementation for Flood Handling in DAS Welang
Pasuruan District. Journal of Civil Engineering and
Technology (IJCIET), Vol. 9, Issue 8, 1076-1082.
Wahyudi, H., Sumirman, E., 2018. Implementation of
Artificial Storage For Flood Management in Welang
Watershed, Pasuruan District, International Journal of
Civil Engineering and Technology (IJCIET), Vol. 10,
Issue 11, 107-112.
ISOCEEN 2019 - The 7th International Seminar on Ocean and Coastal Engineering, Environmental and Natural Disaster Management
250
