
Heat Transfer Mechanism by Natural Circulation for Cooling
Material in Nuclear Reactors as a Passive Safety System
Novitrian
1
, Khairul Basar
1
and Robi Dany Riupassa
2
1
Nuclear Physics & Biophysics Research Division, Department of Physics, Faculty of Mathematics and Natural Sciences,
Institut Teknologi Bandung, Indonesia
2
Department of Physics, Faculty of Mathematics and Natural Sciences, Institut Teknologi Bandung, Indonesia
Keywords: natural circulation, computational fluid dynamics
Abstract: Natural circulation in nuclear reactor cooling systems can be modeled based on computational fluid
dynamics (CFD). Modeling is done to study the fluid flow in a closed loop system that occurs due to
differences in fluid density. The closed loop system model is fitted with a heater and cooler on the opposite
side. Because the density of the fluid depends on the temperature, then by adjusting the temperature
difference between the heater and the cooler it can produce a fluid flow that occurs naturally. The initial
condition in this study uses water as a working fluid with flow properties that are laminar and
incompressible. Variations in temperature differences between heaters and coolers are done to get the
temperature distribution and fluid flow velocity. The model is built for time-dependent conditions so that
the time needed to transfer heat in a closed loop system can be known. Variations in temperature differences
between heaters and coolers are carried out until the maximum conditions of water temperature to remain in
the liquid phase. For this condition the maximum temperature is set to 80 C. This research was also
developed by using several other types of fluids to determine the effect of density on fluid flow velocity.
Other fluids used are gasoline, liquid helium, liquid sodium, and liquid mercury. The height of the closed
loop system at the beginning of this study was used by three meters which then varied for heights of up to
five and eight meters. Model testing is also carried out for working temperatures with differences between
heaters and coolers above 80 C.
1 INTRODUCTION
The nuclear reactor accident that occurred at
Fukushima-Daiichi in 2011 made public acceptance
of nuclear reactor technology decrease. Nuclear
reactors that are in operation now and that are being
developed are expected to have a high level of
safety. Some conditions that can cause reactor
accidents such as pump failure or reactor power loss
must be overcome as well as possible.
The phenomenon of natural circulation is used as
a mechanism of passive cooling in nuclear reactors.
This mechanism will help to dispose of residual heat
in nuclear reactors when emergency conditions for
example due to pump failure. Testing natural
circulation systems can be done with experiments or
closed-loop system simulations. Previous studies
have conducted experiments with closed loop
systems with variations in temperature differences
between heaters and coolers.
In this study, the natural circulation in a nuclear
reactor cooling system is modeled using
computational fluid dynamics (CFD). Modeling is
done to study the fluid flow in a closed loop system
that occurs due to differences in fluid density
(Antariksawan, 2019). Calculations are made for
several conditions. First is the variation in
temperature differences between heating and
cooling, then the use of several types of fluid to see
the effect of fluid density on temperature
distribution, and also the height variation of closed-
loop system.
2 METHODOLOGY
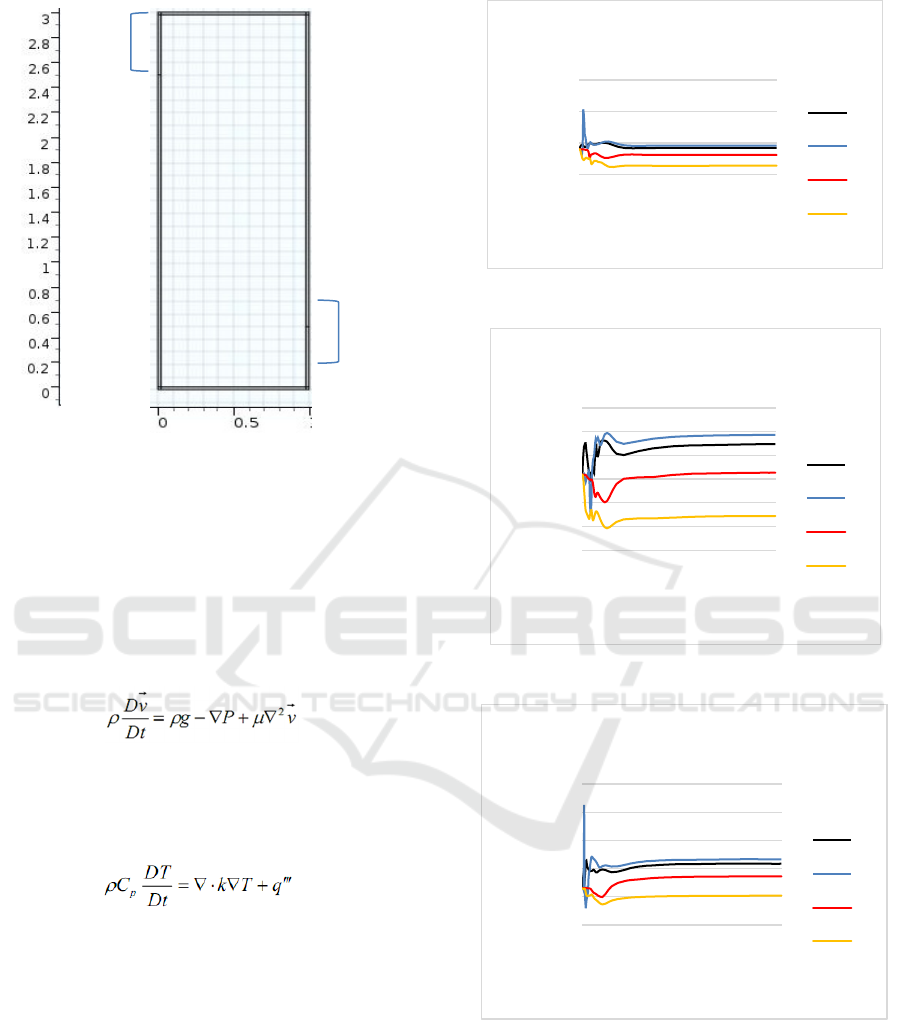
The two-dimensional model for the closed loop
system in this study is shown in Figure 1.
Novitrian, ., Basar, K. and Riupassa, R.
Heat Transfer Mechanism by Natural Circulation for Cooling Material in Nuclear Reactors as a Passive Safety System.
DOI: 10.5220/0010210300002775
In Proceedings of the 1st International MIPAnet Conference on Science and Mathematics (IMC-SciMath 2019), pages 519-525
ISBN: 978-989-758-556-2
Copyright
c
2022 by SCITEPRESS – Science and Technology Publications, Lda. All rights reserved
519
Cooler
Heater
Figure 1. Two-dimensional models of the closed-loop
system
The design specifications of this model are the same
as those done in previous studies experimentally
(Abdillah, 2019)
Flow velocity in this simulation is a solution of
the differential form of the Navier-Stokes equation
for incompressible flow (Cengel, 2015)
The change in fluid temperature in each region in
this two-dimensional model is determined based on
the relationship of the heat transfer equation for
fluid.
3 RESULTS AND DISCUSSION
Calculation results for variations in temperature
differences between heating and cooling (T) are
obtained in the form of temperature distributions and
velocity. The temperature distribution is shown as in
figures 2, 3, 4, and 5.
Figure 2. Temperature versus time (T = 30
C)
Figure 3. Temperature versus time (T = 40
C)
Figure 4. Temperature versus time (T = 60
C)
10
30
50
70
1
42
83
124
165
206
247
288
329
T(C)
t(s)
Temperaturevstime
(T=30C)
A
B
C
D
10
15
20
25
30
35
40
1
47
93
139
185
231
277
323
T(C)
t(s)
Temperaturevstime
(T=40C)
A
B
C
D
0
20
40
60
80
100
1
42
83
124
165
206
247
288
329
T(C)
t(s)
Temperaturevstime
(T=60C)
A
B
C
D
B
A
D
C
IMC-SciMath 2019 - The International MIPAnet Conference on Science and Mathematics (IMC-SciMath)
520
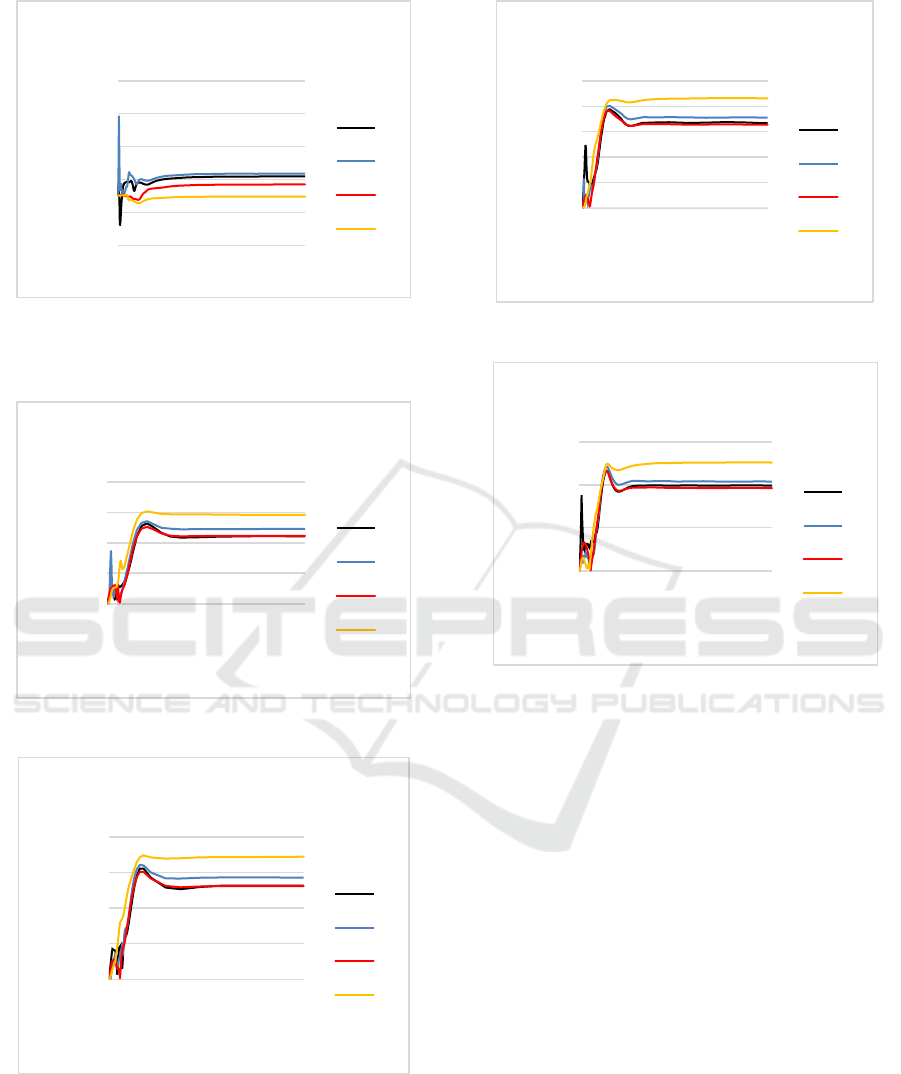
Figure 5. Temperature versus time (T = 80
C)
For flow velocity, the calculation results are shown
in Figures 6, 7, 8, and 9.
Figure 6. Flow velocity versus time (T = 30
C)
Figure 7. Flow velocity versus time (T = 40
C)
Figure 8. Flow velocity versus time (T = 60
C)
Figure 9. Flow velocity versus time (T = 80
C)
From these results it was found that the largest
flow velocity was obtained for T = 80 C. The
calculation results show that for all points reviewed
have velocity between 20 to 25 cm/s. In accordance
with the objectives of the natural circulation system
that is expected to achieve a large fluid flow
velocity, so for this research the optimal results are
at T = 80 C. Although this is the optimum value
that can be achieved for a cooling material in the
form of water, if it is reviewed again for its
application to the reactor cooling system of course it
still needs to be optimized again. Optimization can
be done by choosing another type of fluid because
the results obtained using water have reached the
threshold of changing the phase of liquid to gas.
The next optimization in this research is to use a
height of 5 and 8 meters. Fluid types used are water,
liquid gasoline, and liquid mercury. The simulation
results are plotted for several observation points
namely point A, B, C, and D. Point A is the point on
the heater, point B is the point after exiting the
heater, point C is the point on cooling, and point D is
the point after exiting the cooler. Calculation results
‐50
0
50
100
150
200
1
47
93
139
185
231
277
323
T(C)
t(s)
Temperaturevstime
(T=80C)
A
B
C
D
0
5
10
15
20
1
42
83
124
165
206
247
288
329
V
elocityMagnitude(cm/s)
t(s)
VelocityMagnitudevstime
(T=30C)
A
B
C
D
0
5
10
15
20
1
47
93
139
185
231
277
323
VelocityMagnitude(cm/s)
t(s)
VelocityMagnitudevstime
(T=40C)
A
B
C
D
0
5
10
15
20
25
1
47
93
139
185
231
277
323
VelocityMagnitude(cm/s)
t(s)
VelocityMagnitudevstime
(T=60C)
A
B
C
D
0
10
20
30
1
47
93
139
185
231
277
323
VelocityMagnitude(cm/s)
t(s)
VelocityMagnitudevstime
(T=80C)
A
B
C
D
Heat Transfer Mechanism by Natural Circulation for Cooling Material in Nuclear Reactors as a Passive Safety System
521
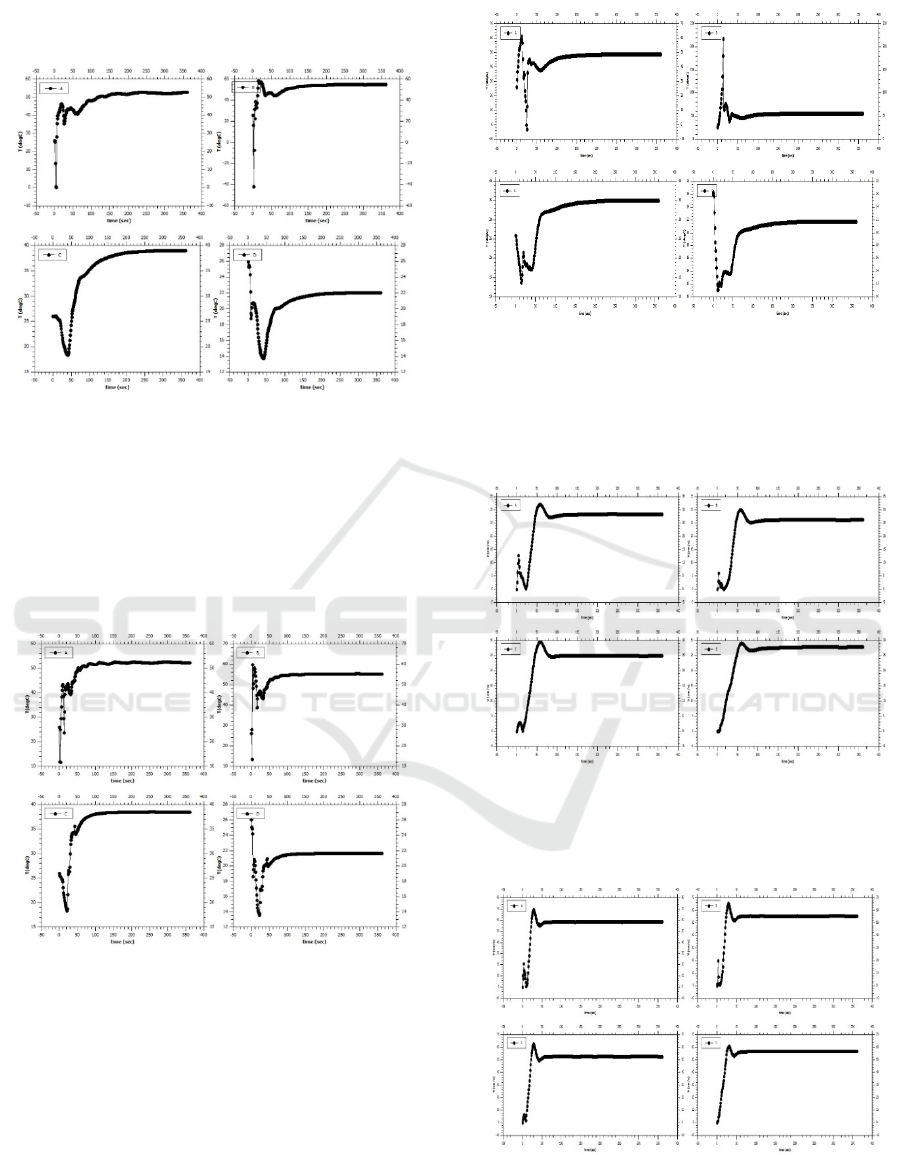
for height is 5 m are shown in figures 10, 11, 12, 13,
14, and 15.
Figure 10. Temperature distribution of water
Figure 10 shows that water reached the saturation
temperature at about 150 s since starting of the
calculation. After saturation, temperature difference
between point A and point B smaller than
temperature difference between point C and point D.
Point A is 52
C and point B is 55
C while point C
is 38
C and point D is 21
C.
Figure 11. Temperature distribution of liquid gasoline
Liquid gasoline reaches saturation temperature at 80
s. The temperature at saturation for point A is 52
C,
point B is 54
C, point C is 39
C, while point D is
21
C. Calculation results for liquid mercury show
saturation temperature reached at 125 s.
Figure 12. Temperature distribution of liquid mercury
The results of the calculation of fluid flow velocity
at saturation temperature indicate that there is no
significant difference between each measurement
point (A, B, C, and D).
Figure 13. Velocity of water flow
Water has a fluid flow rate of 25 to 30 cm/s for all
points. As shown in figure 13.
Figure 14. Velocity of liquid gasoline
IMC-SciMath 2019 - The International MIPAnet Conference on Science and Mathematics (IMC-SciMath)
522
Liquid gasoline has a flow velocity for all points that
is between 50 to 60 cm/s. As for liquid mercury, the
value is not much different from water.
Figure 15. Velocity of liquid mercury
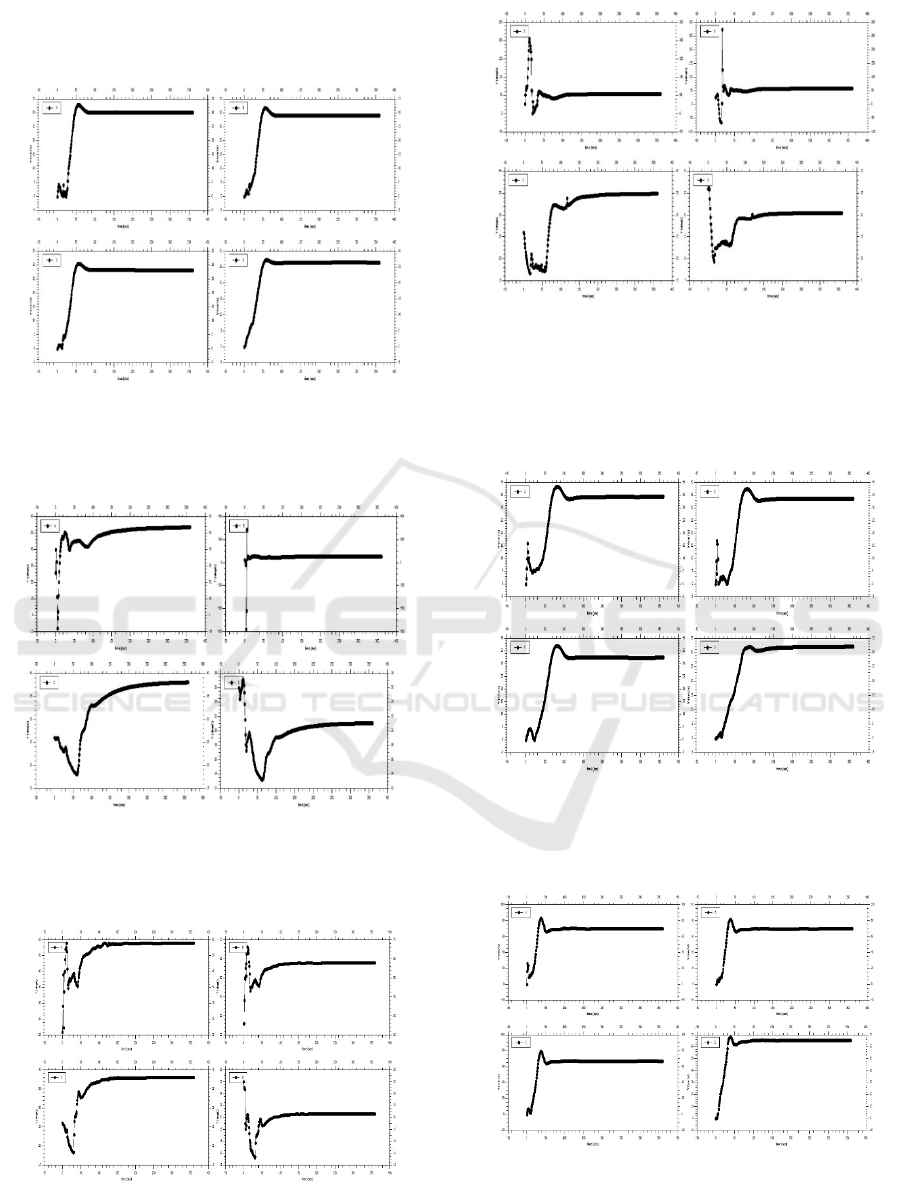
Calculation results for height is 8 m are shown in
figures 16, 17, 18, 19, 20, and 21.
Figure 16. Temperature distribution of water
The saturation point when given an increase in
system height does not show a significant difference.
Figure 17. Temperature distribution of liquid gasoline
Figure 18. Temperature distribution of liquid mercury
Increasing the height of the system causes the
velocity of fluid flow to be increased. The velocity
of the water flow becomes greater, ie between 30 to
35 cm/s for all points.
Figure 19. Velocity of water flow
For liquid gasoline, the flow velocity increases to
between 60 to 70 cm/s for all points.
Figure 20. Velocity of liquid gasoline
Heat Transfer Mechanism by Natural Circulation for Cooling Material in Nuclear Reactors as a Passive Safety System
523
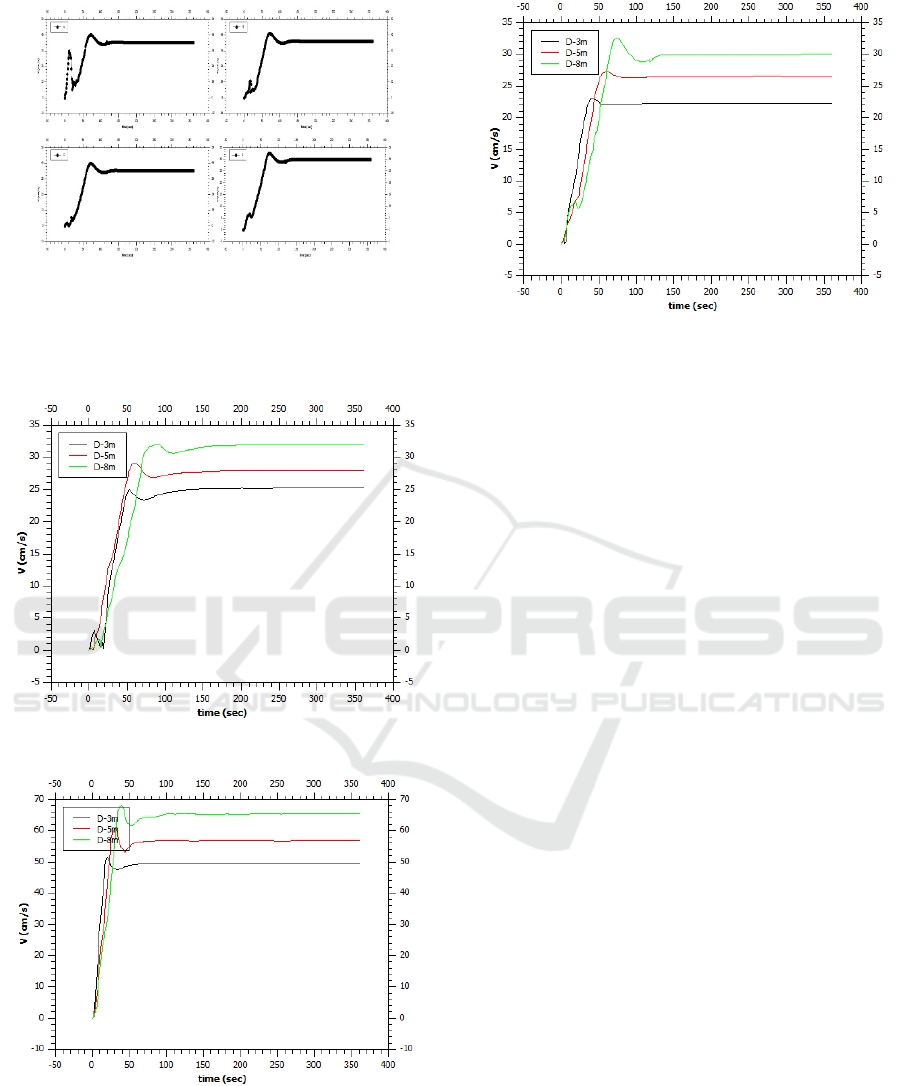
Figure 21. Velocity of liquid mercury
The relationship of height variation versus changes
in flow velocity can be seen for heights of 3, 5, and
8 meters for each type of fluid at point D, as follows.
Figure 22. Height variation versus velocity of water flow
Figure 23. Height variation versus velocity of liquid
gasoline
Figure 24. Height variation versus velocity of liquid
mercury
These results show the comparability between
the relationship of fluid density and flow velocity.
As explained in the previous simulation results, the
fluid density values from the smallest to the largest
are liquid gasoline (0.751 gr/cm
3
), water (0.999
gr/cm
3
), and liquid mercury (13.63 gr/cm
3
). The
change in flow velocity is also proportional to the
increase in fluid density. For example, from the
results at point D with a height of 3 meters, the
saturation state of the water velocity reaches 25
cm/s, liquid mercury reaches 23 cm/s, and liquid
gasoline reaches 50 cm/. For a height of 5 meters the
saturation state of flow velocity for each fluid is
water reaching 28 cm/s, liquid mercury reaching 26
cm/s, and liquid gasoline reaching 56 cm/s. As for
the loop system with a height of 8 meters, the results
show that water reaches 32 cm/s, liquid mercury
reaches 30 cm/s, and liquid gasoline reaches 66
cm/s.
4 CONCLUSION
A study of heat transfer mechanism by natural
circulation for cooling material in nuclear reactors
has been conducted. Calculations with variations in
the difference between heating and cooling
temperatures show that the greatest flow velocity is
obtained for T = 80 C. For T = 80 C, the
velocity is between 20 and 25 cm/s. Calculation
results by varying the height of the closed loop
system show that the height of the closed loop
system is proportional to the velocity of fluid flow.
IMC-SciMath 2019 - The International MIPAnet Conference on Science and Mathematics (IMC-SciMath)
524

REFERENCES
Abdillah, H and Novitrian. 2019, Experiments on Natural
Convection as Cooling System Mechanism on Nuclear
Reactors, Journal of Physics : Conference Series,
1204, 012111.
Abdillah, H., Saputra, G., Novitrian and Permana, S.,
2017, Study of Natural Convection Passive Cooling
System for Nuclear Reactors, Journal of Physics :
Conference Series, 877, 012047.
Bejan, A and Kraus, A D. 2003, Heat Transfer Handbook,
New Jersey: John Wiley and Sons.
Antariksawan, A, et al. 2019, Experimental and Numerical
Simulation Investigation of Single-Phase Natural
Circulation in a Large Scale Rectangular Loop, Atom
Indonesia, 45, 17-25.
Cengel, Y. A., Ghajar, A. J. 2015, Heat and mass transfer,
fundamentals and applications 5
th
edition, McGraw-
Hill Education, New York, 910.
Heat Transfer Mechanism by Natural Circulation for Cooling Material in Nuclear Reactors as a Passive Safety System
525
