
Implementation for WASH Program in Households and
Its Relationship with Nutritional Status of Children in Susuk Village
Nenni Dwi Aprianti Lubis, Sri Amelia, Merina Panggabean and Hemma Yulfi
Faculty of Medicine, Universitas Sumatera Utara, Medan, Indonesia
Keywords: Age-school children, households, nutritional status, WASH facilities.
Abstract: Water, Sanitation, and Hygiene (WASH) are basic human needs that are strictly related to health and
therefore, having a significant impact on the economy. Studies on the effects of WASH have a paramount
benefit to improve the nutritional status of children. This study aimed to describe the implementation of the
WASH program in households in Susuk Village. This research is analytic with a cross-sectional design,
using a total sampling technique. The population of this study is the whole of 135 student’s families in SDN
040494 Susuk, Sub-district of Tiganderket, District of Karo. Data was obtained by conducting direct
observation and interviews at the study site. According to Body mass Index per ages, there are 85.2% of
students have a normal nutritional status, and 14.8% of students with wasting. Based on the nutritional
status of students according to TB per age, there are 47 people (34.82%) classified as stunting and the rest
classified as normal (65.18%). The results also show that 97% of the households were at the level of basic
service according to the drinking water indicator, and 3% were of limited service. Based on the sanitation
indicator, 74.8% of households were at the level of limited service, and 25.2% were of no service. While in
the hygiene indicator, 84.4% of households were at the level of basic service and 15.6% were of limited
service. Based on these results, we suggest that further intervention from the government and contribution
from private sectors are required in the WASH program. Therefore, it will provide evidence on the concern
to improve public health, since the program has a direct impact on community health.
1 INTRODUCTION
The Government of Indonesia has launched a Health
Development National Movement based on Healthy
Paradigma. This paradigma is a perspective or
mindset that sees the importance of maintaining
health and preventing disease rather than restoring
health or treating illness. Therefore we need a
preventive, promotive effort that is balanced with
curative-rehabilitative efforts.
Water, Sanitation, and Hygiene (WASH) are basic
human needs that are strictly related to health and
have a significant impact on business and the
economy. The study report on the effect of sanitation
reports that poor sanitation is a contributor to the
increasing incidence of diarrhea in Indonesia. There
are 120 million disease occurrences each year; even
100,000 Indonesian children die from diarrhea every
year. According to WHO (2014), 94% of the
incidence of diarrhea can be prevented through
increased clean water supply (25%), improved
sanitation (32%), and improved hygiene practices,
specifically handwashing with soap (43%) (USAID,
2017).
Indonesian children as part of excellent and quality
human resources are needed in increasing national
development - one way to improve the nutrition and
health of children. Optimal nutritional status can be
achieved if dietary needs are required for physical
growth and brain development (Almatsier, 2001).
Nutritional problems are caused by three main
factors, namely low consumption of food, not to be
exact parenting, and the high number of infectious
diseases related to the environment. In 2009, FAO
mentioned that health, food availability, socio-
economic, and environmental problems could cause
a decrease in nutritional status. Furthermore, the
2017 USAID Report states that poor sanitation is
one of the reasons for solving nutrition problems in
Indonesia. Families play a role in overcoming
nutritional challenges through meeting food and
nutrition needs, improving parenting, and increasing
access to clean water-sanitation and adequate health
services.
Lubis, N., Amelia, S., Panggabean, M. and Yulfi, H.
Implementation for WASH Program in Households and Its Relationship with Nutritional Status of Children in Susuk Village.
DOI: 10.5220/0010204400002775
In Proceedings of the 1st International MIPAnet Conference on Science and Mathematics (IMC-SciMath 2019), pages 445-449
ISBN: 978-989-758-556-2
Copyright
c
2022 by SCITEPRESS – Science and Technology Publications, Lda. All rights reserved
445
2 METHODS
This research was an observational analytic study
with a cross-sectional design that was carried out
with a combination of quantitative and qualitative
methods. The study population was all households,
namely the families of students of SDN 040494
Susuk, Tiganderket District, Karo District. A sample
of 135 families was taken in total sampling.
Quantitative data collected included respondent
characteristics, observations of drinking water,
sanitation, and family hand washing facilities as
distinguished as Table 1. Besides that, we assess the
nutritional status of school children according to
body weight per age - classified as stunting and
normal and body mass index per age – divided into
wasting and normal. Public perception regarding the
implementation of the WASH program is qualitative
data. This data was collected through focus group
discussions (FGD). This activity was attended by ten
families consisting of three families whose children
were classified as stunting and or wasting, and seven
other families had children with normal nutritional
status. The selection of families for this work is
carried out randomly.
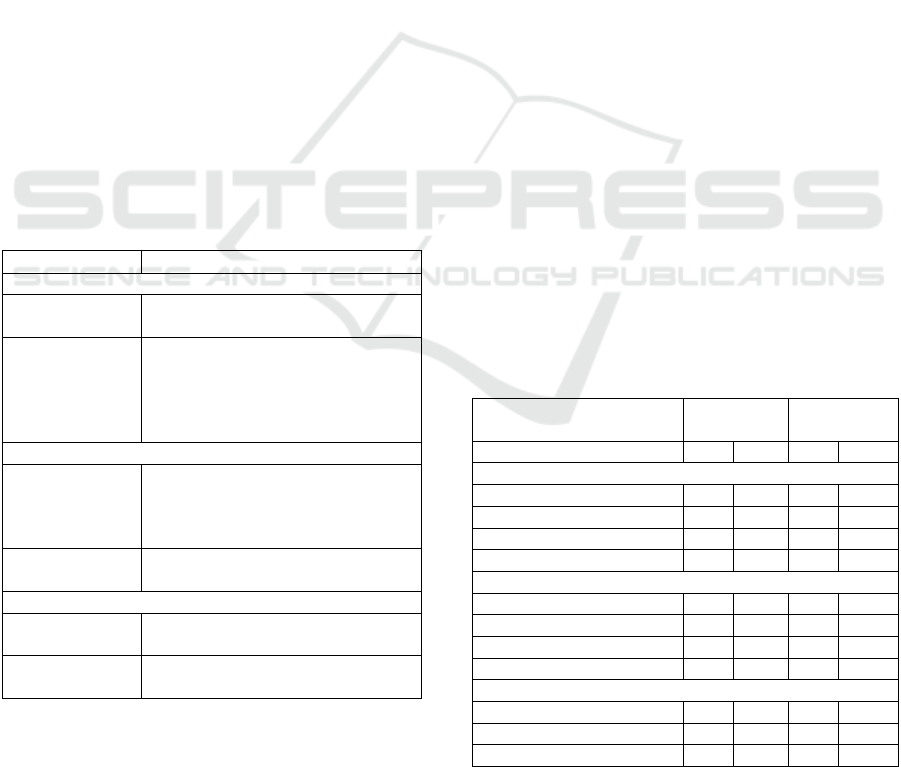
Table 1: Classification of indicator household WASH
(Modificafion from Emerging JMP Service Ladders for
Monitoring WASH in Schools the SDGs).
Service Ladder Criteria
Drinkin
g
Wate
r
Basic service Drinking water from an improve
source is available at the household
Limited service There is an improved source (piped
water, protected well/spring,
rainwater, bottled
water), but water not available at
time of surve
y
Sanitation
Limited service There are improved facilities
(flush/pour flush, pit latrine with
slab, composting toilet) or not
usable
No service No toilet or latrines or unimproved
facilities
H
yg
iene
Basic service Handwashing facilities, which have
water and soap available
Limited service Handwashing facilities with water,
but no soap
Univariate analysis was used to describe the
characteristics of respondents and the implementation
of WASH facilities. Furthermore, the bivariate
analysis uses the chi-square test to determine the
relationship between the implementation of WASH
facilities and the nutritional status of children.
3 RESULTS AND DISCUSSION
Primary data in the form of qualitative data include
data on family characteristics, student
characteristics, and WASH indicators.
3.1 Family Characteristics
The socioeconomic characteristics of the family
describe the demographic status of parents,
including age, level of education, employment, and
income. Professional level classification data are
assumed to represent the economic level of the
family, which indirectly influences family income.
Based on the results of the study note, the majority
of the age of the head of the family is above 40 years
and included in the productive age (36-45 years).
This condition is almost balanced with the
proportion of wives in the same age group.
The highest percentage is in the heads of families
and wives with high school education. The research
location is an agricultural area so that most of the
family heads and wives have non-permanent income,
namely as farmers/ranchers. The characteristics of
the respondent's family can be seen in Table 2. The
monthly family income is around Rp 2,100,000 - this
figure is lower than the Karo Regency UMK in 2019
which is Rp 2,829,558.
Table 2: Respondent characteristic according to ages, level
of education and occupational.
The socioeconomic
chararacteristics
Husbands* Wives
n % n %
Ages (years)
<= 25 - - 1 0.7
26-35 16 12.1 49 36.3
36-45 74 56.0 68 50.4
>= 46 42 31.9 17 12.6
Level of education
Primary school 32 24.2 17 12.6
Junior hi
g
h school 45 34.1 36 26.7
Hi
g
h school 51 38.6 78 57.8
Universit
y
4 3.1 4 3.0
Occupational
Permanent income 1 0.8 1 0.7
Non-
p
ermanent income 131 99.2 111 82.2
Housewives - - 23 17.1
* Three families do not have a husband as the head of
family because they have died and divorced.
IMC-SciMath 2019 - The International MIPAnet Conference on Science and Mathematics (IMC-SciMath)
446
3.2 Student Characteristics
Referring to the age grouping issued by the Ministry
of Health in 2009, most students are aged 5-11 years
(82.22%) - classified as childhood. There were 69
male students (51.1%) and the remaining 66 female
students (48.9%).
Table 3: Nutritional status for students
The demographic
chararacteristics
Students
n %
Ages (years)
5-11 111 82.8
12-16 24 17.8
Gender
Male 69 51.1
Female 66 48.9
According to the anthropometric index, the
nutritional status of school children is differentiated
based on the body height per age index and the body
mass index for ages (BMI index). The proportion of
stunting school children, according to body height
per ages, occupies the highest proportion compared
to BMI per age. Data analysis shows 14.8% wasting
suffered, and 34.8% stunting. This figures is hingher
than tUhe prevalence of nutritional status of school
children in Indonesia and North Sumatra are
respectively 10.9% and 9.8% for wasting and 27.7%
and 33.7% for stunting (NIHRDI, 2018).
Table 4: Distribution of nutritional status of students
The demographic
chararacteristics
Students
n %
Body Mass Index per Ages
Wasting 20 14.8
Normal 115 85.2
Body Height per Ages
Stunting 47 34.8
Normal 88 65.2
3.3 Wash Implementations
Table 5 shows the distribution of WASH program
implementation, which includes indicators of
drinking water, sanitation, and hygiene. In the
drinking water indicator of 135 families studied, the
majority of households are in the category of basic
service, as many as 131 respondents (97.0%), while
the remaining 4 respondents (3.0%) are in the
limited-service category. In the sanitation indicator
of 135 respondents studied, the majority of
households are in the limited service category, with
101 respondents (74.8%), while the remaining 34
respondents (25.2%) are in the no service category.
In the hygiene indicator of 135 respondents studied,
the majority of households are in the basic service
category, namely 114 respondents (84.4%), while
the remaining 21 respondents (15.6%) are in the
limited-service category.
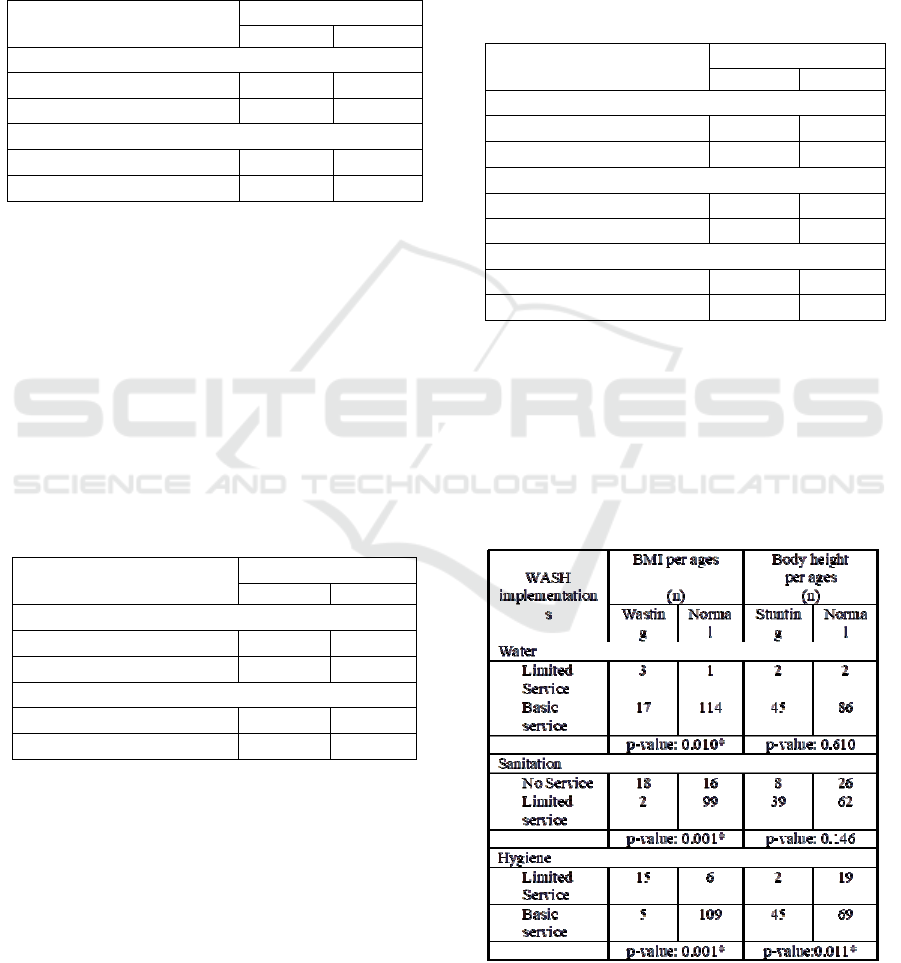
Table 5: Distribution respondents according to indicator
household WASH
Indicator households
WASH
Households
n %
Drinking Water
Limited service (LS) 4 3.0
Basic service (BS) 131 97.0
Sanitation
No service 34 25.2
Limited service 101 74.8
Hygiene
Limited service 21 15.6
Basic service 114 84.4
Environmental health affects individual health which
is an indirect cause of nutritional status. In this
study, ecological health includes access to clean
water for drinking, sanitation, and hygiene. Table 6
presents statistical data that looks at the relationship
between WASH indicators and nutritional status.
Table 6: Distribution of nutritional status of students
according to the WASH indicator
*significant, p value <0.05
Implementation for WASH Program in Households and Its Relationship with Nutritional Status of Children in Susuk Village
447

The analysis shows that students who are
wasting (BMI index) in families with limited access
to clean water are greater in number than another
normal nutritional status. In contrast, families with
adequate access to clean water have more normal
nutritional status than those classified as wasting.
Statistically shows a significant relationship (p-value
= 0.010). Likewise, based on the classification of
nutritional status of body height per age, a similar
situation also occurs, only statistically shows a
meaningless relationship.
The proportion of wasting students from families
who do not have bathrooms and lavatories and the
lack of handwashing facilities is higher than the
percentage of students with normal nutritional status.
Statistical analysis also showed a significant
relationship between nutritional status based on BMI
index with sanitation and hygiene (p-value = 0.001).
Different things happen to students with nutritional
status classification based on body height per age,
and only hygiene is related to nutritional status.
The prevalence of nutritional status based on
BMI index provides information about a nutritional
status that is acute. Stunting (body height per age)
gives an overview of chronic nutritional status. The
nutritional problem is a result of long-standing
conditions such as poverty, inadequate parenting,
and recurring illness. Low community access to
clean water and basic sanitation can increase the
incidence of diarrhea that affects nutritional status
(WHO & Unicef, 2006). By addressing the problems
that cause disease due to the availability of clean
water and poor hygiene and sanitation,
environmental issues can be overcome (Hapsari,
Supraptini, Hananto, 2010).
The results of qualitative studies based on focus
group discussions are described as follows. From the
question about "what and how is the WASH
Program?" The majority of informants answered the
following: "in our opinion, this program is a
community-based sanitation drinking water supply
program, where the program aims to meet clean
water and community drinking water and try to help
change the habits of people who are less clean to
have a clean and healthy lifestyle."
To the question "how was the implementation of
the WASH program at the research site?" Most of
the informants answered as follows:"not going well,
it can be seen from the fact that there are still many
people who do not want to change clean and healthy
behavior such as defecating improperly, not washing
their hands with soap. The most dominant reason is
the financial inability to build bathrooms, lavatories,
and handwashing facilities."
To the question about "is an aid for water sources
needed by the community?", The majority of
informants answered as follows: "in our opinion,
what is currently needed by the community is easy
access to clean water for drinking and daily needs
from water sources, such as the availability of pipes
and water installations that can flow water from the
mountains to people's homes."
In the sanitation indicator, the community is
asked to assess the scope of the toilet and bathroom
supply program. From the question about "how is
the description of sanitation coverage covering
bathrooms and latrines?" The majority of informants
answered as follows: "there are still many people
who do not have bathrooms and lavatories. The
community wants its toilet and lavatory in each
house, but the lack of funds is a barrier. Besides,
defecation in fields or rivers have become a habit."
The final question, from the question "What are
the main WASH indicators for improving health,
especially the nutritional status of children?" The
majority of informants answered as follows: "the
availability of sanitation facilities, namely
bathrooms and lavatories. Because defecation in any
place will transmit diseases that have an impact on
the nutritional status of children. Therefore, the
community wants assistance from the government
and the private sector to realize adequate and
adequate sanitation facilities."
Lack of community access to clean water and
poor sanitation and hygiene behavior contribute to
death (Musadad and Hananto, 2008). Diarrhea and
or other infectious diseases are the cause of death.
One of the efforts to reduce the mortality rate is
by creating healthy environmental sanitation that
ultimately affects the nutritional status of the family.
Various studies have shown that malnutrition is
associated with poor WASH behavior (Prüss-Üstün
et al, 2008; Langford et al, 2011; Spears, 2013; Rah
et al, 2015).
A meta-analysis study conducted by Gizaw and
Worku (2019) states that interventions on WASH
have an impact on improving children's nutritional
status. The research also indicates that policymakers,
health practitioners, nutritionists, and WASH experts
are responsible for improving the health status and
nutritional status of children and improving sanitary
conditions to prevent infectious diseases. WASH
interventions are the most holistic and approaches to
prevent wasting and stunting among children
especially among two children.
IMC-SciMath 2019 - The International MIPAnet Conference on Science and Mathematics (IMC-SciMath)
448

4 CONCLUSIONS
The prevalence of school students who suffer from
wasting and stunting is higher than the national data
and the Province of North Sumatra. Based on the
WASH indicator, most families have access to clean
water, sanitation, and adequate hygiene. The results
of statistical analysis show that indicator of WASH
i.e. drinking water, sanitation facilities (bathrooms
and latrines) and cleanliness (handwashing) are
related to the nutritional status of students according
to the BMI index.
ACKNOWLEDGEMENTS
Thank you to Universitas Sumatera Utara for
providing research funding under the TALENTA -
Basic Scheme by Non-PNBP USU of the Year 2019
No. 4167/UN5.1.R/PPM/ 2019, April 1st 2019.
REFERENCES
Gizaw, Z., A. Worku. Effects of single and combined
water, sanitation and hygiene (WASH) interventions
on nutritional status of children: a systematic review
and meta-analysis. Italian Journal of Pediatrics. 2019;
45(77).
Hapsari, D., Supraptini, Hananto, M. Air pollution factors
in the home related to the incidence of Upper
Respiratory Tract Infections in infants in Indonesia.
Journal of Health Ecology. 2010;9(2):1238-47.
Langford, R., Lunn, P., Brick, C.P. Hand-washing,
subclinical infections, and growth: a longitudinal
evaluation of an intervention in Nepali slums. Am J
Hum Biol. 2011;23(5):621-9.
Musadad, D.A., Irianto, J. The level of risk of drinking
water facilities in Sukabumi Regency. Journal of
Health Ecology. 2008;7(3):819-28.
National Institute of Health Research and
Development (Indonesia) (NIHRDI). 2018. National
Report: Baseline Health Research. Jakarta: Ministry of
Health of the Republic of Indonesia
Prüss-Üstün, A., Bos, R., Gore, F., Bartram, J. Safer
water, better health: costs, benefits and sustainability
of interventions to protect and promote health: World
Health Organization; 2008. Available at
https://apps.who.int/iris/bitstream/handle/10665/43840
/9789241596435_eng.pdf;jsessionid=42B6FA8EA51E
1FAE0FE6B292E79B0D4D?sequence=1.
Rah J.H., Cronin, A.A., Badgaiyan, B., Aguayo, V.M.,
Coates, S., Ahmed, S. Household sanitation and
personal hygiene practices are associated with child
stunting in rural India: a cross-sectional analysis of
surveys. BMJ Open. 2015;5(2):e005180.
Spears, D. How much international variation in child
height can sanitation explain?: The World Bank; 2013.
Available at https://rpds.princeton.edu/sites/rpds/files/
media/spears_how_much_international_variation. pdf.
WHO & UNICEF. 2006. Meeting the Millenium
Development Goals Drinking Water and Sanitation
Target: The urban and Rural Challenges of the
Decade. Geneva.
UNICEF & WHO. 2016. Core questions and indicators for
monitoring WASH in Schools in the Sustainable
Development Goals. Geneva.
Implementation for WASH Program in Households and Its Relationship with Nutritional Status of Children in Susuk Village
449
