
The Development of Microcontroller-based Electrostatic Air Filter
Device using Flyback Transformer
Nasruddin M. Noer, Harris Fadhilla Said, Zikri Noer and Siti Utari Rahayu
Department of Physics, Faculty of Mathematics and Natural Sciences, University of Sumatera Utara, Medan 20155,
Sumatera Utara, Indonesia
Keywords: Air Filter Device, Electrostatic Method, ATmega328 Microcontroller, Flyback Transformer
Abstract:
This study aimed to develop a microcontroller-based air filter device using electrostatic method with high
voltage obtained from flyback transformer. The design of flyback transformer required several circuits, such
as ATmega 328 microcontroller, optocoupler, and driver, whereas the electrostatic method was applied by
arranging aluminum metal plates parallel with three anodes and cathodes. The results showed that the duty
cycles of 30%, 40%, 50%, 60%, and 70%, produced an output voltage of 2.632 kV, 7.250 kV, 13.16 kV,
20.01 kV and 27.55 kV, respectively, with the amount of dust particles as much as 0.2122 grams, 0.5147
grams, 0.8960 grams, 1.1620 grams and 1.9267 grams. These results suggest that higher the duty cycle
results in higher output voltage and larger amount of filtered dust.
1 INTRODUCTION
The development of research on high voltage is
rapidly increased; It requires a large and complicated
circuit. However, the research on the application of
high voltage is not only for industrial scale, but also
must be developed in all fields, especially in the
health sector (Barsoum, 2015). In the field of high
voltage health, it can be used as an air filter. Air is
an environmental medium that is a basic human
need, so it needs to get serious attention. Healthy air
at homes and offices is a necessity in the era of
modern society. We cannot deny that particulate air
in homes and offices can endanger human health
(Sudrajad A, 2019). Based on WHO data in 2012,
around 7 million people die each year from diseases
related to air pollution. In this case including heart
disease, stroke, lung and breathing, and cancer. On
the other hand, pollutants in the air not only
endanger health but also disrupt the climate such as
fine particle, black carbon, and surface ozone
(O
3
)(Soemirat, 2014).
Dust particles are in the air for a relatively long
time in a state of floating and then entering the
human body through breathing so that it can
endanger health. Every material including dust can
be considered as an electrically charged particle that
will have the property of attraction with other
particles of different charge and repel with particles
that have the same charge (Gianto, 2015).
Regarding that, a study conducted by Raditya et al.
showed an air filter with a trade capacity of 8 kV
using the Walton Cockroft method electrostatically.
However, they could only precipitate dust of
0.001541 grams in 60 hours with an average of
0.000154 for six hours (Raditya, 2011). Therefore,
further study needs to be done on the development
of air filter device.
Based on those explanations, in this research,
an electrostatic air filter was developed using high
voltage obtained from flyback transformer. The air
filter is carried out using aluminum plates arranged
in a parallel order, by providing an electric field so
that dust particles in the air settle to the plates with
different charges. The system was controlled by
utilizing ATmega328 microcontroller.
2 METHODS
The method of conducting this research was carried
out in two stages, namely the design of a high
voltage device using the flyback transformer method
and an air filter device using the electrostatic
method.
438
Noer, N., Said, H., Noer, Z. and Rahayu, S.
The Development of Microcontroller-based Electrostatic Air Filter Device using Flyback Transformer.
DOI: 10.5220/0010200500002775
In Proceedings of the 1st International MIPAnet Conference on Science and Mathematics (IMC-SciMath 2019), pages 438-444
ISBN: 978-989-758-556-2
Copyright
c
2022 by SCITEPRESS – Science and Technology Publications, Lda. All rights reserved
2.1 Design High Voltage Devices using
the Flyback Transformer Method
Flyback Transformer is a transformer with a ferrite
core that generates a high voltage on the cathode ray
(CRT) both on television and on the monitor. The
main function of this transformer is to trigger (fire)
electrons in a CRT tube. Flyback transformer has
several winding namely primary and secondary
winding. Secondary windings are wound in geater
amounts than primary winding with the aim of
different voltage levels so that they can bend and
accelerate the electron beam. Flyback transformers
are made of a coil with quality wire wrapped around
the ferrite core with air blemishes. This function is
to store energy in air blemishes and induce.
To get the output voltage in kilovolts, several
circuits are needed, namely the ATmega 328
Microcontroller, optocoupler, and driver. The
advantage of using the flyback method is that it can
produce high output voltages with low input
voltages. The process of the circuit can be seen in
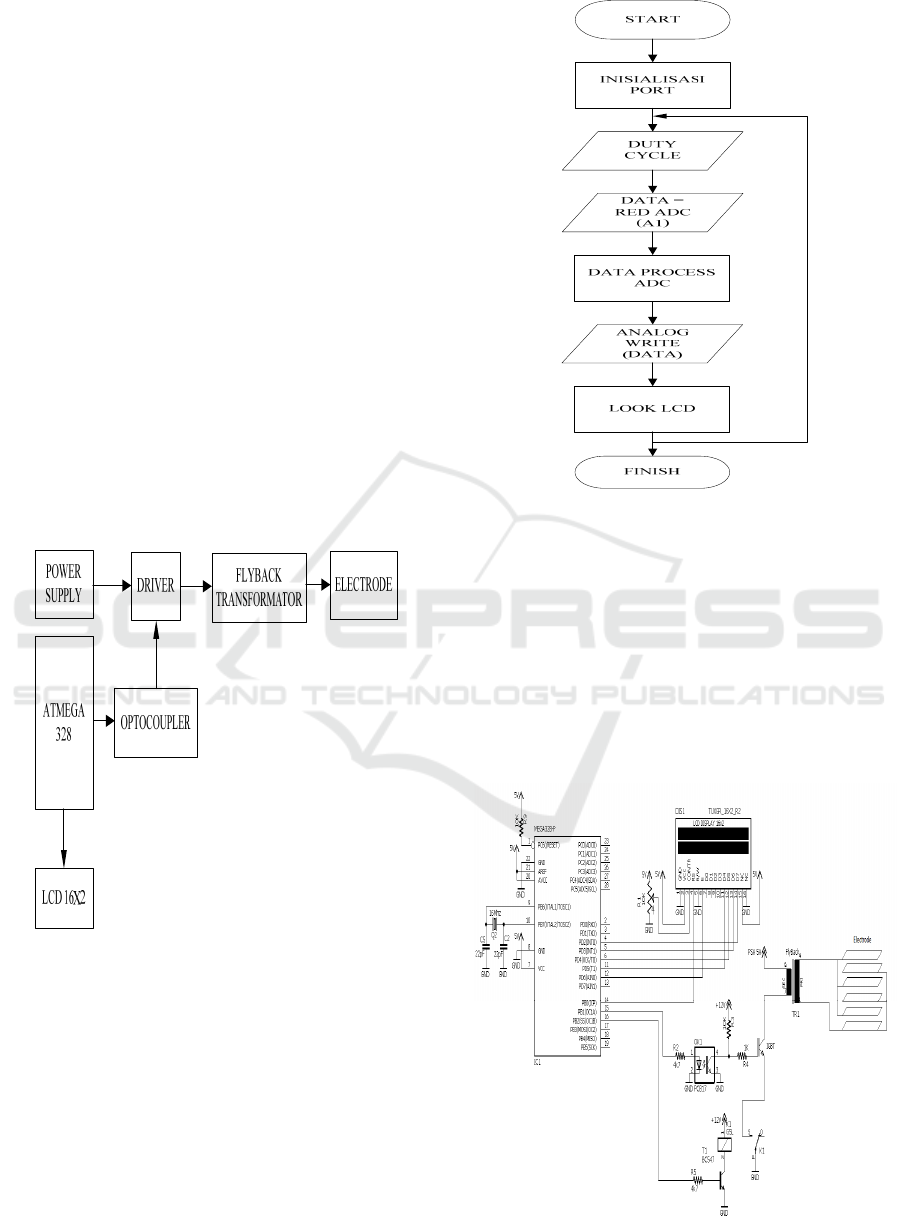
Figure 1 below:
Figure 1: Block diagam
In the process a minimum voltage of 5 volts is
needed to activate ATgaga 328, to provide
regulating the duty cycle at the foot of the Atmega
328, the duty cycle setting uses a progam that is
entered through a computer to the Atmega 328, the
duty cycle can be adjusted using a potentiometer
which will then be displayed on the LCD. The
progam process of the Atmega series can be seen in
Figure 2 below:
Figure 2: Flowchart
In this circuit, all components must be in a high
voltage phase, so it is not damaged, such as the
optocoupler. The function of the optocoupler is to
deliver high voltage to the Insulated Gate Bipolar
Transistor (IGBT) driver, which will then be
transmitted to the flyback transformer leg. Then
from the flyback will come a high voltage in the
kilovolt scale, which is measured using a 40kV high
Lutron High Voltage Probe. The series of all the
tools can be seen in Figure 3 below:
Figure 3: Overall circuit
The Development of Microcontroller-based Electrostatic Air Filter Device using Flyback Transformer
439
0
5
10
15
20
25
30
30 40 50 60 70
Output Voltage (kV)
Duty Cycle (%)
2.2 Design the Air Filter using the
Electrostatic Method
The dust has to settle properties due to the earth's
gavity force. Also, the dust has static electricity
(electrostatic) properties that will be attracted to
particles opposite the charge and away from
similarly charged particles. The material that we
normally experience can be seen from a form of
three kinds of particles which have mass and particle
charge can be seen in Table 1 below:
Table 1: Mass and particle charge
Particles S
y
mbol Loa
d
Mass
(
k
g)
Proton P +e 1.67 x 10
-27
Neutron N 0 1.67 x 10
-27
Electron E -e 9.10 x 10
-31
Electrostatic is the force that arises on two objects
that have static electricity, this is in accordance with
the sound of Colomb's law "The electric force
(attraction or repulsion) between two electric
charges is proportional to the amount of electric
charge each and is inversely proportional to the
square of the distance split between the two electric
charges. "
F = k
(1)
The design of the air filter referred to here is an
aluminum metal plate arranged parallel to three
anodes and three cathodes intermittent with a length
of 30 cm, width 20 cm and 0.8 mm thick, aligned
with a distance of 2.5 cm. This is done so that no
plasma discharge occurs when connected to a
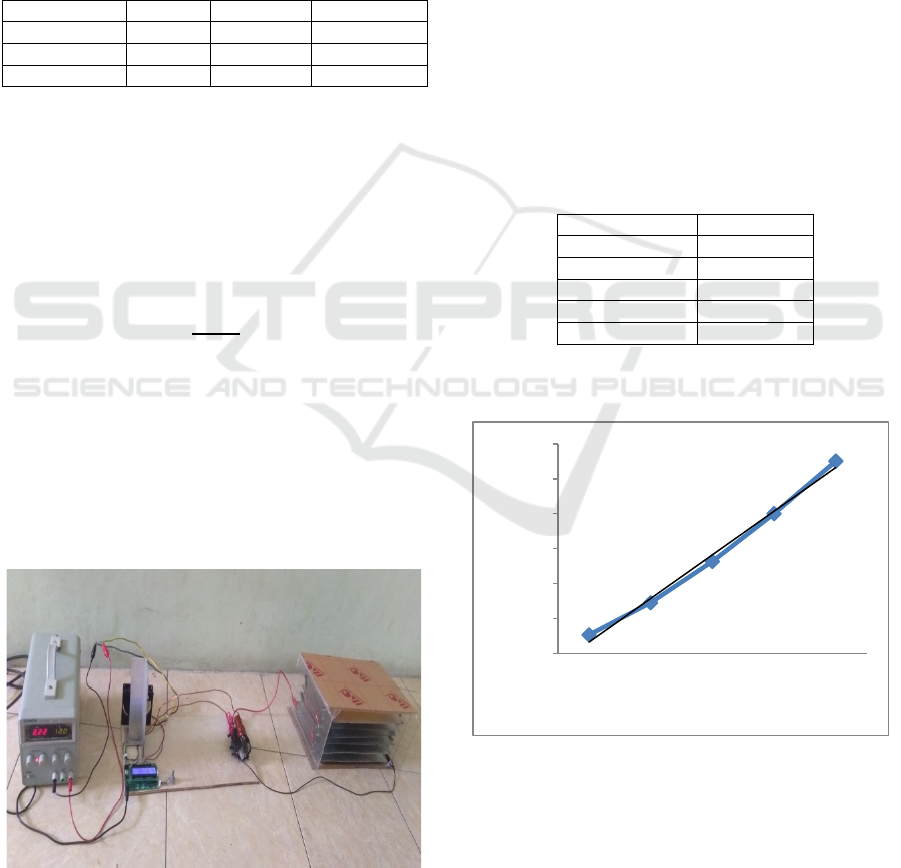
flyback. The series of overall tools can be seen in
Figure 4 below:
Figure 4: Overall set of tools
3 RESULT AND DISCUSION
From a current of 220 ACV, the current is changed
to 12 DCV using a power supply and then converted
to 5 DCV using a Regulator IC, which will then be
connected to the Atmega 328. The Atmega 328
microcontroller circuit also obtained a frequency
that passes through the optocoupler that is equal to 3
kHz.
3.1 Measurement of High Voltage
using the Lutron 40kV HV Probe
With an input voltage of 12 volts on the flyback, an
output voltage using a 40kV Lutron HV probe is
obtained. The Lutron 40kV HV Probe readout used a
scale with a ratio of 1: 1000 on the multimeter
reading, the output voltage obtained from the
flyback at a duty cycle of 30%, 40%, 50%, 60%, and
70% can be seen in Table 2 below:
Table 2: Measurements with the 40kV Lutron HV Probe
Duty Cycle (%) Vout (kV)
30 % 2.632
40 % 7.250
50 % 13.16
60 % 20.01
70 % 27.55
From the data in table 2, can be illustrated graph
output voltage vs. duty cycle as in Figure 5 below:
Figure 5: Graph of output voltage vs duty cycle
Figure 5 shows that the higher the duty cycle, the
higher the output voltage. This is because the PWM
pulse width expressed in the duty cycle changes
linearly which causes the output voltage to change.
IMC-SciMath 2019 - The International MIPAnet Conference on Science and Mathematics (IMC-SciMath)
440
0
0,02
0,04
0,06
0,08
0,1
0,12
Dust Weight (grams)
Time (Hours)
3.2 Dust Weight with 2.632kV (30%
Duty Cycle)
Dust weight with a voltage of 2.632kV at a 30%
duty cycle. And obtained the weight of dust at each
time of data collection, in table 3 below:
Table 3:
Dust weight at any time at 2.632kV
Time (Hours) Dust Weight (g)
18:00
–
00:00
0.0205
00:15
–
06:15 0.0032
06:30
–
12:30 0.0211
12:45
–
18:45 0.0668
19:00
–
01:00 0.0135
01:15
–
07:15 0.0033
07:30
–
13:30 0.0303
13:45
–
19:45 0.0404
20:00
–
02:00 0.0070
02:15
–
08:15 0.0061
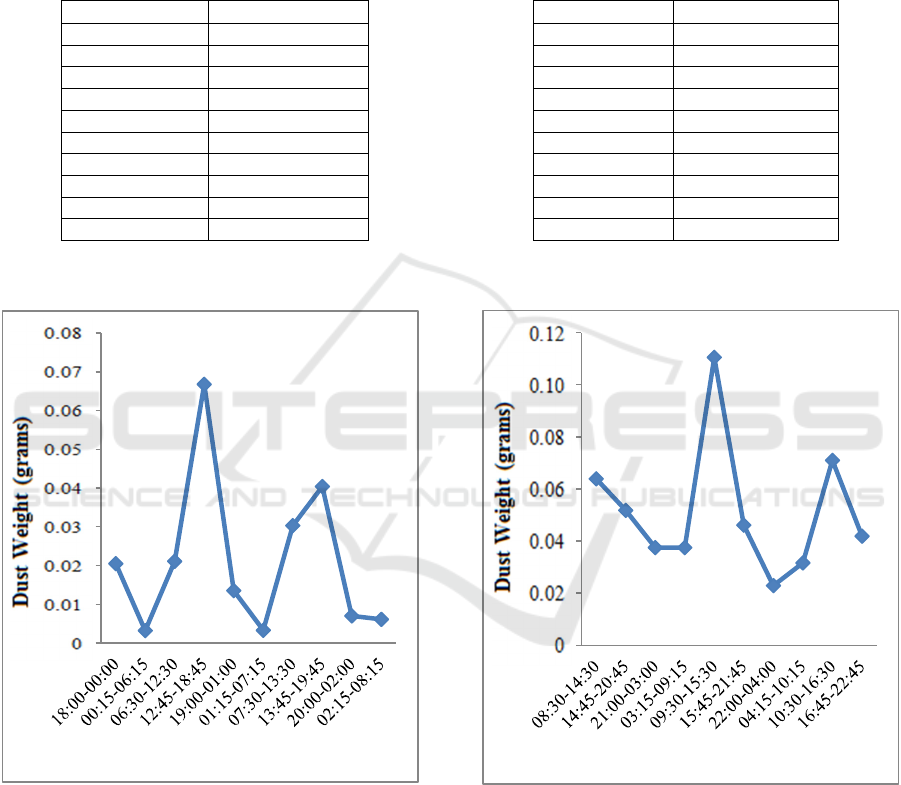
From the data in table 3, we can illustrate the dust
vs. time weight graph as in Figure 6 below:
Figure 6: Dust weight vs time graph at 2.632kV
Based on the graph above, it can be seen that the
weight of dust at 12:45 - 18:45 WIB more than the
others, the weight obtained is as much as 0.0668
grams, this is because at that hour many vehicles are
passing or congestion that occurs occur. Whereas at
00:15 - 06:15 WIB less than the others, the weight
obtained is 0.0032 grams, this is because at that hour
it can be said that there is almost no driving activity.
3.3 Dust Weight with 7.250kV (Duty
Cycle 40%)
Dust weight with a voltage of 7.250kV at a 40%
duty cycle. And obtained the weight of dust at each
time of data collection, in the following table 4:
Table 4:
Dust weight at any time at
7.250kV
Time (Hours) Dust Weight (g)
08:30
–
14:30 0.0639
14:45
–
20:45 0.0518
21:00
–
03:00 0.0375
03:15
–
09:15 0.0375
09:30
–
15:30 0.1105
15:45
–
21:45 0.0461
22:00
–
04:00 0.0229
04:15
–
10:15 0.0316
10:30
–
16:30 0.0710
16:45
–
22:45 0.0419
From the data in table 4, we can illustrate the dust
Figure 7: Dust weight vs time graph at 7.250kV
Based on the graph above, it can be seen that the
weight of dust at 09:30 - 15:30 WIB more than the
others, the weight obtained is as much as 0.1105
grams, this is because at that hour many vehicles are
passing or congestion that occurs occur. While at the
time of 22:00 - 04:00 WIB less than the others, the
weight obtained is as much as 0.0229 grams, this is
because at that hour it can be said that there is
almost no driving activity.
0
0,01
0,02
0,03
0,04
0,05
0,06
0,07
0,08
Dust Weight (grams)
Time (Hours)
The Development of Microcontroller-based Electrostatic Air Filter Device using Flyback Transformer
441
0
0,05
0,1
0,15
0,2
0,25
23:00-05:00
05:15-11:15
11:30-17:30
17:45-23:45
00:00-06:00
06:15-12:15
12:30-18:30
18:45-00:45
01:00-07:00
07:15-13:15
Dust Weight (grams)
Time (Hours)
0
0,05
0,1
0,15
0,2
0,25
13:30-19:30
19:45-01:45
02:00-08:00
08:15-14:15
14:30-20:30
20:45-02:45
03:00-09:00
09:15-15:15
15:30-21:30
21:45-03:45
Dust Weight (grams)
Time (Hours)
3.4 Dust Weight with 13.16kV (Duty
Cycle 50%)
Dust weight with a voltage of 13.16kV at a 50%
duty cycle. And obtained weight of dust at each time
of data collection, in the following table 5:
Table 5:
Dust weight at any time at
13.16kV
Time (Hours) Dust Weight (g)
23:00
–
05:00
0.0449
05:15
–
11:15 0.0741
11:30
–
17:30 0.1912
17:45
–
23:45 0.0820
00:00
–
06:00 0.0594
06:15
–
12:15 0.0746
12:30
–
18:30 0.1282
18:45
–
00:45 0.0724
01:00
–
07:00 0.0628
07:15
–
13:15 0.1064
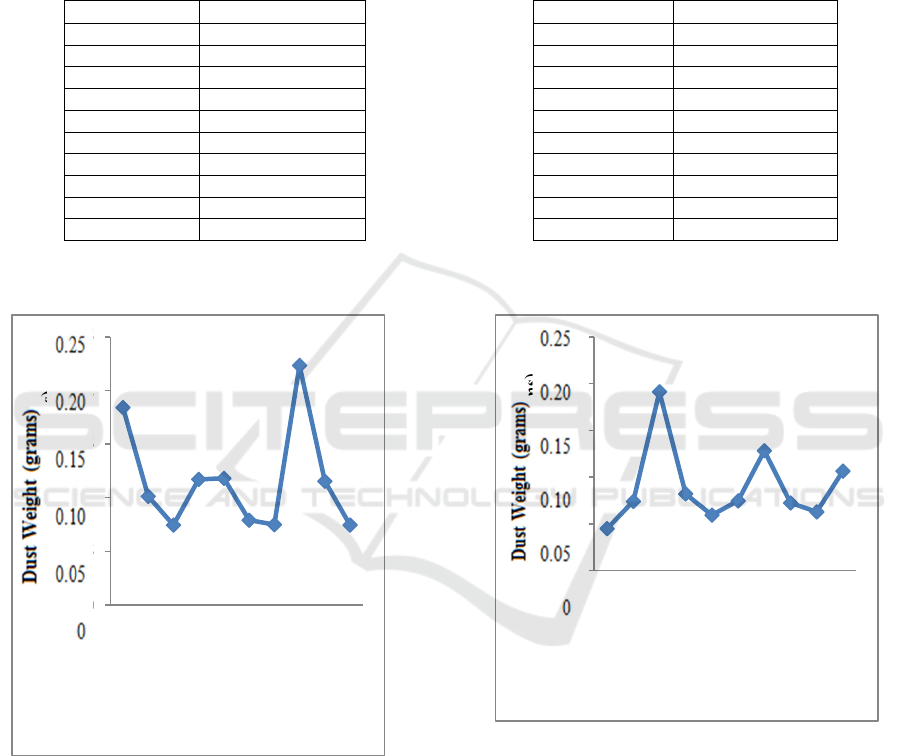
From the data in table 5, we can illustrate the dust
vs. time weight graph as in Figure 8 below:
Figure 8: Dust weight vs time graph at 13.16kV
Based on the graph above, it can be seen that the
weight of dust at 11:30 - 17:30 WIB is more than the
others, the weight obtained is as much as 0.1912
grams, this is because at that hour many vehicles are
passing or congested occur. Whereas at 23:00 -
05:00 WIB less than the others, the weight obtained
is 0.0449 grams, this is because at that hour it can be
said that there is almost no driving activity.
3.5 Dust Weight with 20.01kV (Duty
Cycle 60%)
Dust weight with a voltage of 20.01kV at a 60%
duty cycle. And obtained the weight of dust at each
time of data collection, in the following table 6:
Table 6:
Dust weight at any time at
20.01kV
Time (Hours) Dust Weight (g)
13:30
–
19:30 0.1840
19:45
–
01:45 0.1013
02:00
–
08:00 0.0745
08:15
–
14:15 0.1170
14:30
–
20:30 0.1181
20:45
–
02:45 0.0790
03:00
–
09:00 0.0749
09:15
–
15:15 0.2233
15:30
–
21:30 0.1554
21:45
–
03:45 0.0745
From the data in table 6, we can illustrate the dust
vs. time weight graph as in Figure 9 below:
Figure 9: Dust weight vs time graph at 20.01kV
Based on the graph above, it can be seen that the
weight of dust at 09:15 - 15:15 WIB more than the
others, the weight obtained is as much as 0.2233
grams, this is because at that hour many vehicles are
passing or congested occur. While at the time of
21:45 - 03:45 WIB less than the others, the weight
obtained is as much as 0.0745 grams, this is because
at that hour it can be said that there is almost no
driving activity.
IMC-SciMath 2019 - The International MIPAnet Conference on Science and Mathematics (IMC-SciMath)
442
0
0,5
1
1,5
2
2,5
2.632 7.250 13.16 20.01 27.55
Dust Weight (grams)
Output Voltage (kV)
0
0,05
0,1
0,15
0,2
0,25
0,3
0,35
04:00-10:00
10:15-16:15
16:30-22:30
22:45-04:45
05:00-11:00
11:15-17:15
17:30-23:30
23:45-05:45
06:00-12:00
12:15-18:15
Dust Weight (grams)
Time (Hours)
3.6 Dust Weight with 27.55kV (Duty
Cycle 70%)
Dust weight with a voltage of 27.55kV at 70% duty
cycle. And obtained the weight of dust at each time
of data collection, in the following table 7:
Table 7:
Dust weight at any time at
27.55kV
Time (Hours) Dust Weight (g)
04:00
–
10:00 0.1288
10:15
–
16:15 0.2588
16:30
–
22:30 0.1922
22:45
–
04:45 0.0948
05:00
–
11:00 0.1289
11:15
–
17:15 0.3179
17:30
–
23:30 0.1677
23:45
–
05:45 0.0901
06:00
–
12:00 0.2571
12:15
–
18:15 0.2905
From the data in table 7, we can illustrate the dust
vs. time weight graph as in Figure 10 below:
Figure 10: Dust weight vs time graph at 27.55kV
Based on the graph above, it can be seen that the
weight of dust at 11:15 - 17:15 WIB more than the
others, the weight obtained is as much as 0.3178
grams, this is because at that hour many vehicles are
passing or congested occur. Whereas at 23:45 -
05:45 WIB less than the others, the weight obtained
is 0.0901 grams, this is because at that hour it can be
said that there is almost no driving activity.
3.7 Relationship of Heavy Dust with
Output Voltage
With the voltage released by the flyback on duty
cycles of 30%, 40%, 50%, 60%, and 70%. Then
obtained the amount of dust that can be generated
during ten times of data collection, each data
collection is carried out for 6 hours. Can be seen in
the following table 8:
Table 8:
Dust weight at each output voltage
Vout (kV)
Dust Wei
g
ht (
g
)
2.632
0.2122
7.250 0.5147
13.16 0.8960
20.01 1.1620
27.55
1.9267
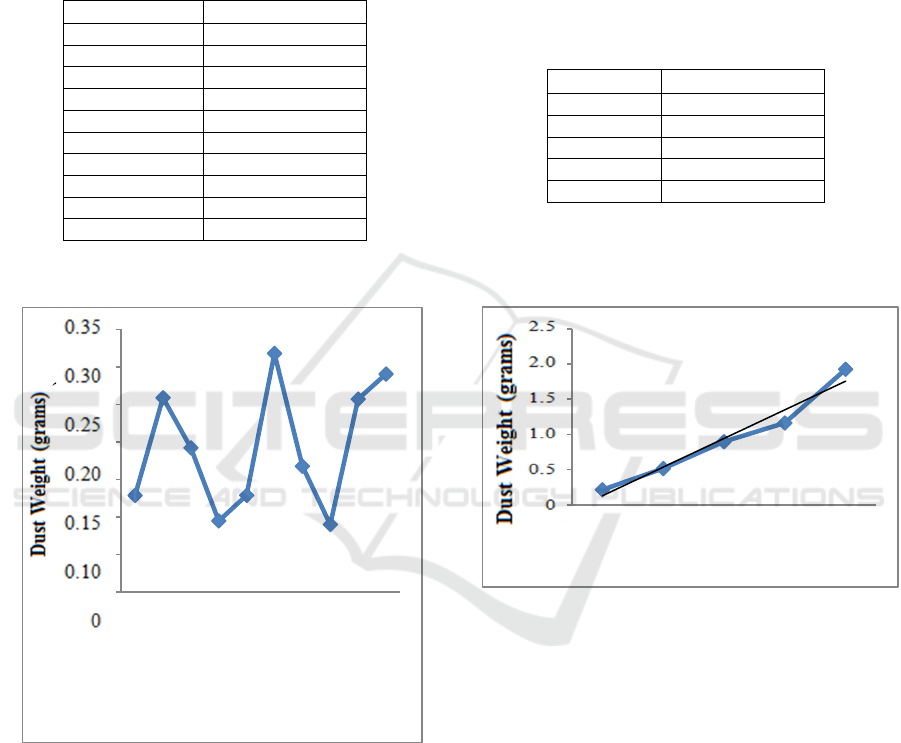
From the data in table 8, we can draw a graph of
dust weight vs. output voltage as shown in Figure 11
below:
Figure 11: Dust weight vs output voltage graph
Figure 11 shows that the higher the output voltage
the more dust weight. This is due to the electrostatic
process of aluminum metal plates with dust running
well.
4 CONCLUSIONS
The results show that with duty cycles of 30%, 40%,
50%, 60%, and 70%, producing an output voltage of
2.632kV, 7.250kV, 13.16kV, 20.01kV, and
27.55kV, with dust successfully absorbed as many
as 0.2122 grams, 0.5147 grams, 0.8960 grams,
1.1620 grams, and 1.9267 grams. So it can be
concluded that the higher the duty cycle, the higher
the output voltage and the more dust that can be
filtered.
The Development of Microcontroller-based Electrostatic Air Filter Device using Flyback Transformer
443

REFERENCES
Borsoum. Nader, and Glenn Isaiah Stanly. 2015. Design of
High VoltageLow Power Supply Device. Malaysia:
University Malaysia Sabah. Universal Journal of
Electrical and Electronic Engineering 3(1): 6-12, 2015.
DOI: 10.1389/ujeee.2015.030102.
Gianto, Mas Sarwoko Suratmadja, dan Ekki Kurniawan.
2015. Perancangan dan Implementasi Pengendap
Debu dengan Tegangan Tinggi secara Elektrostatik.
Bandung: Universitas Telkom. e-Proceeding of
Engineering: Vol.2, No.2, Agustus 2015. Page 2091.
ISSN: 2355-9365.
Raditya. Achmad, Agung Warsito, dan Abdul Syakur.
2011. Perancangan Pembangkit Tegangan Tinggi DC
Full Wave Walton Cockroft dan Aplikasi sebagai
Pengendap Debu secara Elektret. Semarang:
Universitas Diponegoro.
Soemirat, J. 2014. Kesehatan Lingkungan. Gadjah Mada
University Press, Yogyakarta.
Sudrajad A, dan Firmansyah. 2019.Studi Variasi
Tegangan Discharge pada Alat Electrostatic
Precipitator untuk Filter Udara. Banten: Universitas
Sultan Agung Tirtayasa. Vol. V, No.1,April 2019, hal.
70-73.
IMC-SciMath 2019 - The International MIPAnet Conference on Science and Mathematics (IMC-SciMath)
444
