
Abundance and Length-weight Relationship of Anchovy Pekto
(Stolephorus waitei) in Tanjung Beringin Water, Serdang Bedagai,
Sumatera Utara
Miswar Budi Mulya
1*
, Arlen Hanel Jhon
1
and Zulham Apandy Harahap
2
1
Department of Biology,
Faculty of Mathematics and Natural Sciences, Universitas Sumatera Utara, Medan, Indonesia
2
Faculty of Agriculture, Universitas Sumatera Utara, Medan, Indonesia
Keywords: Abundance, Distribution Pattern, Length-Weight Relationship.
Abstract: Research about the abundance and length-weight relationship of anchovy pekto (Stolephorus waitei) has
been carried out in Tanjung Beringin Water, Serdang Bedagai Regency, Sumatera Utara. This study aims to
analyze the abundance, distribution pattern, and length-weight relationship of anchovy pekto. This research
use purposive sampling methods. Sampling of anchovy pecto use a mini purse seine. Abundance and
distribution of anchovies were analyzed using the equation according to [1] and the length-weight
relationship using the Fish Stock Assessment Tool version 2. This study obtained 1238 ind/60 m
2
. The
highest abundance of anchovy at station 1 is 490 ind/60m
2
, followed by station 2 is 386 ind/60m
2
, and the
lowest at station 3 is 362 ind/60m
2
. The distribution pattern of anchovy pecto is group distribution. The
length-weight relationship of anchovy pekto showed that increase in anchovy body weight faster than its
length, which illustrates a positive allometric growth pattern, with a value of b > 3.
1 INTRODUCTION
Utilization of marine fishery resources is an
important issue, as a food and trade commodity,
including anchovy pecto (S. waitei). Anchovy pecto
is often found in Indonesia waters, including the
water of Tanjung Beringin, Serdang Bedagai
Regency, Sumatera Utara. Anchovy pecto is very
widely used by the community, both for sale and
consumption to meet protein needs. The high selling
price and market demand for this commodity has
caused many fishermen around the Tanjung
Beringin water of Serdang Bedagai Regency to catch
this commodity, without any restrictions. This
condition can affect population abundance and
growth of this commodities in nature. Until now,
there is no data on the abundance and growth of
anchovy in the Malacca Strait Waters of Serdang
Bedagai Regency, Sumatera Utara. This study aims
to analyze the abundance and length-weight
relationship of anchovy pekto.
2 ANCHOVY SAMPLING
Anchovy sampling was carried out in the waters of
Tanjung Beringin, Serdang Bedagai Regency, every
12 days for 7 months of observation. This research
use purposive sampling methods. Sampling of
anchovy pecto use a mini purse seine. Samples of
captured anchovies were collected, then measured
the total length from the anterior end to the posterior
end of the body using millimeter blocks to the
nearest 0.1 mm. Fresh weights of anchovies were
also measured per individual by weighing each
individual using a digital scale with an accuracy of
0.1 g, then an analysis of abundance, distribution,
and growth pattern.
Abundance of anchovy pecto were analyzed
using the equation according to Silaen and Mulya
(2018):
K (ind/m
2
) = n
i
/A
with:
K = abundance (ind/m
2
)
n
i
= number of individuals spesies i
A = plot area (m
2
)
Mulya, M., Jhon, A. and Harahap, Z.
Abundance and Length-weight Relationship of Anchovy Pekto (Stolephorus waitei) in Tanjung Beringin Water, Serdang Bedagai, Sumatera Utara.
DOI: 10.5220/0010200400002775
In Proceedings of the 1st International MIPAnet Conference on Science and Mathematics (IMC-SciMath 2019), pages 435-437
ISBN: 978-989-758-556-2
Copyright
c
2022 by SCITEPRESS – Science and Technology Publications, Lda. All rights reserved
435
Distribution patterns were analyzed based on the
Morisita Distribution Index (Bengen, 1998) with the
equation:
1
1
2
ii
i
n
i
i
NN
Nx
nID
ID = Morisita distribution index
N = number of plots (ranging from 1 to n)
N
i
= total number of individuals in the total plot
x
i
2
= number of individual squares in the total
plot
Length-weight relationship using the Fish Stock
Assessment Tool version 2 according to Sparre and
Venema, (1998), with regretion equation:
W = a L
b
or Ln W = Ln a + bLn L,
W = wet weight (g)
L = total length (cm)
a and b = constans
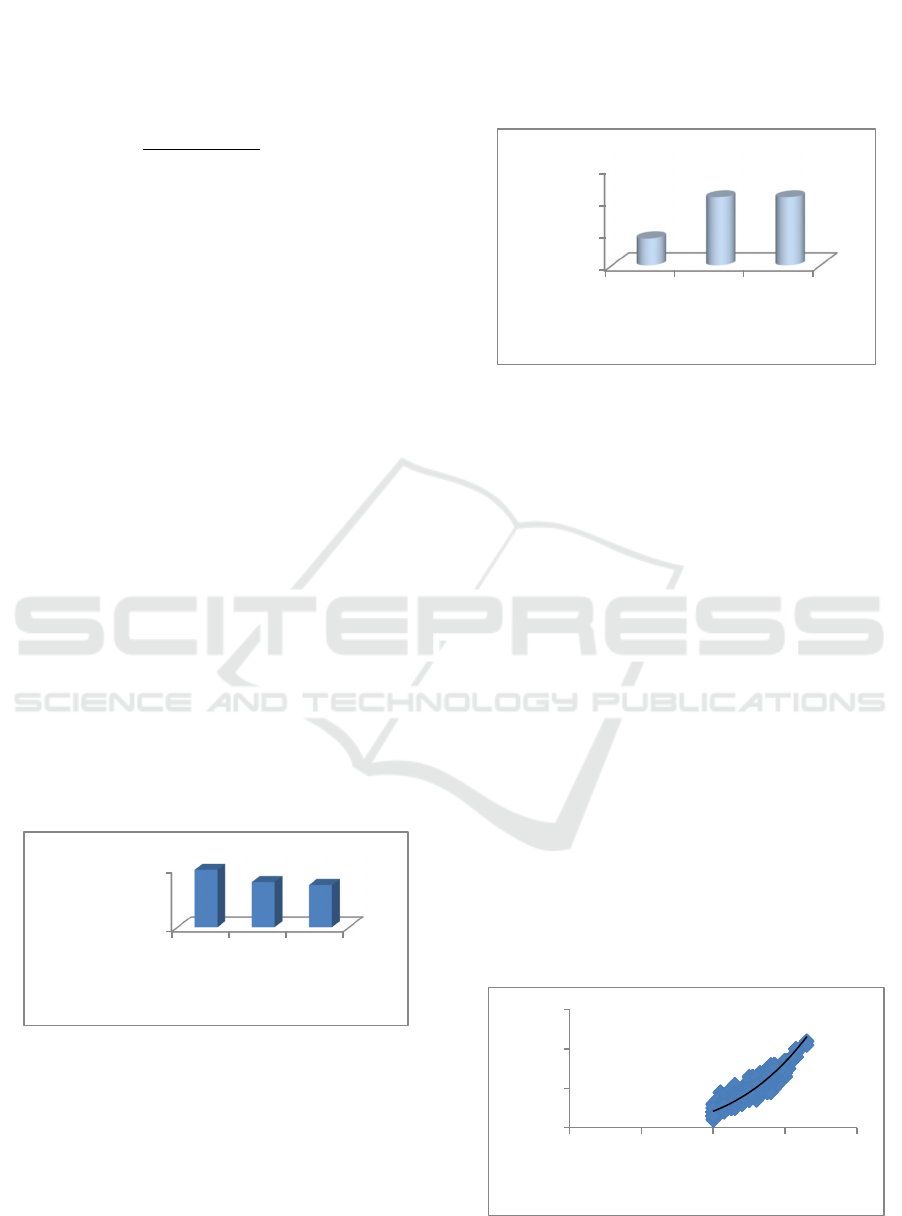
2.1 Abundance
The abundance analysis of anchovy pecto can be
seen in Figure 1. This study obtained 1238 ind/60
m
2
. The highest abundance of anchovy at station 1 is
490 ind/60m
2
, followed by station 3 is 386 ind/60m
2
,
and the lowest at station 2 is 62 ind/60m
2
. High
abundance at station 1 is due to the fact that this
station is 15 km from the beach leading to the sea,
and is an anchovy catchment area. The water
temperature at this station is 28°C, and strongly
supports the life of this biota.
Figure 1: Abundance of anchovy pecto in each station.
Yuanda et al. (2017) stated that anchovy
generally lives in groups, the number reaches
hundreds individuals, and has a length of about 6-9
cm. Fitriani and Pursetyo, (2012) stated that the
anchovy pecto belongs to a group of small pelagic
fish that can live in a temperature range of 26⁰C-
29⁰C.
2.2 Distribution
The distribution of anchovy pecto at each station,
which was analyzed using the morisita distribution
index can be seen in Figure 2.
Figure 2: Distribution of anchovy pecto at each station.
The results of the distribution analysis of
anchovies get a distribution index value greater than
3 or Id > 3, which illustrates the distribution of
anchovies at each station, classified into the pattern
of group distribution. This can be seen from the
anchovy found at each station generally has a size
that is not much different and found always in
groups. Mulya and Harahap, (2019) stated that,
distribution criteria can be grouped into three groups
based on the value of the morista distribution index.
The distribution of a population is categorized
randomly, if it has a distribution index value (Id) =
1.00. The distribution of a population is categorized
as normal if it has a distribution index value (Id) = 0,
and the distribution of a population is categorized as
a group if it has a distribution index value (Id) ≠ 1 or
Id ≠ 0.
2.3 Growth Pattern
The results of the length-weight analysis of
anchovies obtained, it appears that the growth of
anchovy pecto at each station is a positive
allometric, with a value of b > 3 (Figure 3).
Figure 3: Growth pattern of anchovy pecto.
0
500
123
490
386
362
Abundance
(ind/60m
2
Station
0
10
20
30
123
8
21 21
Distribution index
Station
y = 0,0037x
3,4079
R² = 0,9026
0
1
2
3
02468
Weigth (g)
Length (cm)
IMC-SciMath 2019 - The International MIPAnet Conference on Science and Mathematics (IMC-SciMath)
436

The result of analysis show that equation: Log W
= 0,0037 + 3,4079 log L, or in exponential form: W
= 0,0037L
3,4079
with coefficient of determination
(R
2
) = 0,8828. Mulya (2019) states that the growth is
said to be isometric, if the value of b = 3, whereas if
the value of b is greater or smaller than 3 then
growth is said to be allometric, assuming if the value
of b < 3 body length increases faster than weight
gain, whereas if the value of b > 3 increases weight
faster than increasing body length.
Some factors that cause positive allometric
growth are physiological and environmental
conditions, such as temperature, pH, salinity,
geographical location and sampling
technique (Mulfizar et al. 2012). The results also
found that anchovies at each station had a fat size.
3 CONCLUSIONS
1) The highest abundance of anchovy at station 1 is
490 ind/60m
2
, followed by station 3 is 386
ind/60m
2
, and the lowest at station 2 is 362
ind/60m
2
.
2) The distribution pattern of anchovy pecto is
group distribution.
3) The length-weight relationship of anchovy pekto
showed that increase in anchovy body weight
faster than its length, which illustrates a positive
allometric growth pattern, with a value of b > 3.
ACKNOWLEDGEMENT
Authors would like to express our gratitude to
DRPM for the financial support by PDUPT 2019
scheme.
REFERENCES
Bengen. (1998). Synopsis of
Multivariable/Multidimensional Statistical Analysis.
Bogor Agricultural University Postgraduate Program.
Fitriani, N., & Pursetyo, K. (2012). Technique of Catching
Anchovy With a Fishing Gear in Water of Pamekasan,
East Java. Media Journal of Marine and Coastal
Science, 1(3), 1–2.
Mulfizar, Z. ., Muchlisin, & Dewiyanti, I. (2012). Long-
Weight Relationship, and Condition Factors, Three
Types of Fish Caught in Kuala Gigieng Waters, Aceh
Besar, Aceh Province. Depik Journal, 1(1), 1–9.
Mulya, M. (2019). Condition Factor and Exploitation
Rates of Scylla serrata in Karang Gading Sumatera
Utara. The 4th International Conference on Biological
Sciences and Biotechnology, 305(1), 1–6.
Mulya, M., & Harahap, Z. (2019). Abundance and Growth
Parameter of Mangrove Crab (Scylla serrata) in
Estuary Water of Karang Gading, District Deli
Serdang. The 4th International Conference on
Biological Sciences and Biotechnology, 305(1), 1–5.
Silaen, S., & Mulya, M. (2018). Density and White
Shrimp Growth Pattern (Penaeus merguiensis) in
Kampung Nipah Waters of Perbaungan North
Sumatera. IOP Conference Series: Earth and
Environmental Science, 130(1), 1–7.
Sparre, P., & Venema, S. C. (1998). Introduction to
Tropical Fish Stock Assessement. FAO Fisheries
Tehnical Paper.
Yuanda, D., Mulya, M., & Muhtadi, A. (2017). “Growth
and the Rate Exploitation of Anchovy Pekto
(Stolephorus waitei) in the sea of Belawan, Medan,
Sumatera Utara. Aquacoastmarine Journal, 5(1), 1–
11.
Abundance and Length-weight Relationship of Anchovy Pekto (Stolephorus waitei) in Tanjung Beringin Water, Serdang Bedagai, Sumatera
Utara
437
