
Blood Glucose Determination by Fourier Transform near Infrared
Spectroscopy
F. S. Rondonuwu
1,2
, A. Setiawan
2,4
and F. F. Karwur
3
1
Research Center for NIR Applications, Universitas Kristen Satya Wacana, Salatiga, Indonesia
2
Department of Physics, Faculty of Mathematics and Natural Sciences, Universitas Kristen Satya Wacana,
Salatiga, Indonesia
3
Faculty of Health Science, Universitas Kristen Satya Wacana, Salatiga, Indonesia
4
Study Center for Multidicplinary Applied Research and Technology (SeMARTy), Universitas Kristen Satya Wacana,
Salatiga, Indonesia
Keywords: Near-infrared spectroscopy, PCA, blood glucose, non-invasive
Abstract: Diabetes is a metabolic disorder that is caused by unregulated blood glucose and therefore requires regular
and intensive monitoring. Currently, blood sugar monitoring is mostly done invasively by withdrawing
blood through a needle or piercing of the fingertips. This method can cause trauma and an infection.
However, there is the potential for using a non-invasive measurement of blood glucose levels with near-
infrared spectroscopy (NIRS) combined with partial least-square regression. As a pathway to actualize it,
the spectrum of whole blood was measured with different glucose levels. A total of 72 NIR spectrum from 8
whole blood samples with different types of glucose levels were measured. A principal component analysis
(PCA) and partial least square regression (PLSR) were applied to the spectral data matrix. The results
showed that PCA is successfully classified as spectral data based on the glucose content and PLSR model
within the clinically accurate region of the Clarke error grid. These results indicate that NIRS has an
immense potential to be applied in measuring blood glucose non-invasively.
1 INTRODUCTION
Diabetes is a disease caused by a deficiency of
insulin in the body (American Diabetes Association
(2004). This disease can increase or decrease blood
glucose levels. Under normal conditions, blood
sugar levels vary from 80-130 mg/dL. Insulin is
created by the pancreas to mediate metabolic
reactions with blood and maintain glucose levels in a
normal range (Torpy et al. 2014; Center for Disease
Control and Prevention, 2016. Uncontrolled diabetes
may result in various medical conditions such as a
stroke, kidney failure, heart disease, and blindness
(Center for Disease Control and Prevention, 2016).
Recently, the number of diabetics in the world
continues to increase. This increase makes it
necessary to be able to detect blood glucose levels.
This detection is important not only for those with
diabetes but also for non-diabetes people as a part of
their routine clinical monitoring. This monitoring
often requires fast, painless, non-invasive, and self-
measurement methods (Ferrante et al. 2008;
Kurasawa et al. 2017)
Various studies and developments of detection
models have been done, such as a glucometer design
to non-invasively check blood glucose by applying
NIR at a single wavelength (Saleh et al. 2018). This
is a promising method. Nevertheless, an assortment
of other organic compounds present on the tissue
can have an effect on the accuracy. Therefore,
spectrum-based measurements are significant to
boost the absorbance dynamics for a more thorough
analysis. Yano et al. (2001) discussed the possibility
of using NIR spectroscopy to simultaneously
estimate glucose and citric acid in an aqueous
solution of a blood anticoagulant. Zhang et al.
(2014) utilized two-dimensional correlation
spectroscopy (2DCS) to make the data analysis
better. Essential investigations into the NIR
spectrum of different organic samples have been
carried out since the 1970s. The NIR glucose
spectrum was also studied by Simeone et al. (2017)
and Yano et al. (2001). In addition, a number of
302
Rondonuwu, F., Setiawan, A. and Karwur, F.
Blood Glucose Determination by Fourier Transform near Infrared Spectroscopy.
DOI: 10.5220/0010163200002775
In Proceedings of the 1st International MIPAnet Conference on Science and Mathematics (IMC-SciMath 2019), pages 302-307
ISBN: 978-989-758-556-2
Copyright
c
2022 by SCITEPRESS – Science and Technology Publications, Lda. All rights reserved

measurement techniques have been devised like NIR
Raman spectroscopy Zhang et al., 2013; Lam et al.,
2010 , direct diagnostics that utilize an NIR detector
chip implanted under the skin Saleh et al., 2018;
Uwadaira et al, 2016) and wireless long-term
constant observations (Dingari et al. 2011). The
NIRS approach with an exploration into different
spectral ranges and additional measurement methods
has also been reviewed (Pandey et al. 2017) and
studied using chemometrics.
Near-infrared spectroscopy (NIRS) facilitates the
workflow analysis and enables measurements of a
large number of samples in a reasonably quick
amount of time. It can gauge the concentration of
several constituents. In numerous instances, a
specific spectrum of a constituent can be connected
to its fingerprint. Samples containing functional
groups such as OH, CH, and NH are susceptible to
NIR due to the overtones of their fundamental
vibrations (R-H) in the IR region which match with
the NIR absorptions. Even though the C=C and C-C
bonds are not visible in the NIR region, their C-H
vibrational frequencies can reveal the C=C and C-C
bonds. The NIR absorption is commonly more
comprehensive compared to the IR absorption
because of the overlapping overtones and
combination bands discussed above. Consequently,
NIR analyses are complex and necessitate more
detailed processes. Fortunately, the development of
chemometrics enables NIR data to be utilized in
appropriate processes.
This research inspected the application of NIRS
to decide the glucose content in whole blood from a
healthy volunteer between a range of 80 and 130
mg/dL. This study strove to elaborate on the
previous measurements of glucose in an aqueous
solution and examine the likelihood of using NIRS
and PLSR as a substitute method to devise a non-
invasive blood glucose apparatus.
2 METHODS
2.1 Sample Preparations
In this experiment, lifeblood samples were retrieved
from a healthy volunteer with the intention of only
focusing on the effects of glucose. All the blood
drawings were completed within 120 minutes after
the volunteer had finished eating and drinking
sugary drinks. Blood drawings were taken in 15-
minute intervals using a lancet that punctured the
individual’s fingertips. The drawing procedures
followed standard measures using a portable
glucometer. The amount of blood drawn each time
was about one drop. A small amount of blood was
used to measure the blood sugar levels with a
glucometer while the rest was used for scanning by
NIRS. There was a total of 8 blood drawings with
the glucose levels indicated by a glucometer at 84,
86, 98, 100, 111, 116, 119, and 121 mg/dL. Within 2
hours, the blood sugar levels then returned to their
initial levels.
2.2 Data Acquisition
Each blood sample was put on a metal reflector
covered by optical glass. The space between the
glass and metal reflector was 0.2 mm (thus a 0.4 mm
path length with a double pass). A Fourier transform
near-infrared spectrometer (Buchi NIRFLEX 500
solid) with a spectral region of 4000-10000 cm
-1
was
applied in a reflectance mode using fiber optics to
test each of the sample spectra. Each spectrum had 4
cm
-1
intervals (thus, each spectrum consisted of 1250
data points) and averaged over 32 measurements.
The sample temperatures were sustained at 26°C
during the spectral acquisitions. A total of 73 spectra
was collected with 9, 8, 9, 9, 11, 9, 8, and 10 spectra
for the blood samples with 84, 86, 98, 100, 111, 116,
119, and 121 mg/dL of glucose, respectively.
2.3 Data Analysis
A PCA analysis was applied for the 73 spectra after
the smoothing, normalizations, and derivatives. The
smoothing procedure was implemented using the
Savitzky-Golay method employing a third order
polynomial at a frame size of 21. Spectral
normalizations were applied to eliminate
multiplicative scattering and baseline variations. The
details for PLSR have been clarified elsewhere. A
total of 73 spectra were divided into two groups, 37
spectra for the calibration set, and 36 spectra for the
validation set. The calibration spectra were utilized
to devise a prediction model using the partial least
square regression (PLSR) method. PLSR attempts to
show the relationships between groups of observed
variables and latent variables. Validation spectra
were applied to cross-validate them by using the
PLSR parameters to estimate the concentrations of
the validation samples. Both PCA and PLSR
procedures were coded using Matlab version 2017b.
Blood Glucose Determination by Fourier Transform near Infrared Spectroscopy
303
3 RESULTS AND DISCUSSION
Red blood cells (erythrocytes), white blood cells
(leukocytes), platelets (thrombocytes), and plasma
are the main constituents of whole blood (Basu and
Kulkami 2014). Nearly half of whole blood is
plasma, and about 90% of it is actually water, while
the remaining 10% is protein. Therefore, the NIR
spectrum of whole blood resembles the NIR
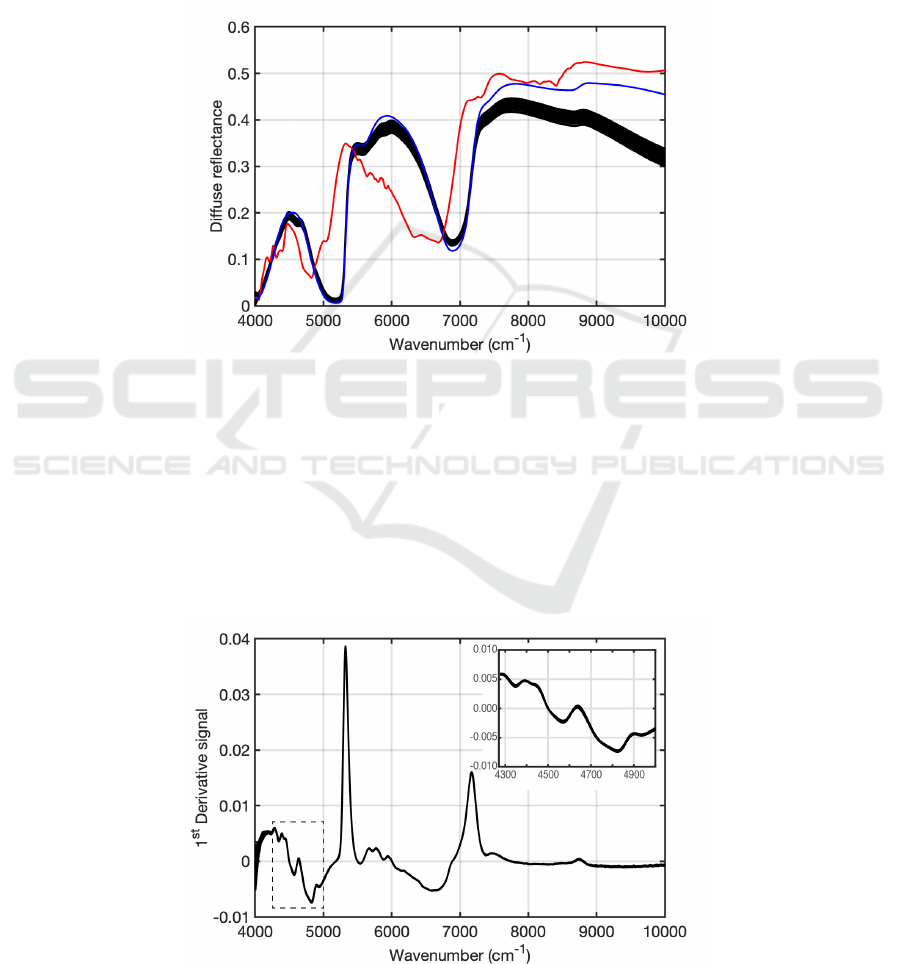
spectrum of water. Figure 1 shows the NIR spectra
of 27 samples, the spectrum of glucose (red) and
water (blue). Water and glucose spectra are
presented to indicate their bands' positions and
widths to the whole blood spectra. The whole blood
spectra are characterized by the well-recognized two
strong water absorptions that appear at around 5200
cm
-1
and 7000 cm
-1
. The absorption of glucose is
much weaker when compared to that of water.
However, a small skirt at around 4800 cm
-1
strongly
suggests that glucose is present in the whole blood.
Figure 1. Near-infrared diffuse-reflectance spectra of whole blood (black). For comparison, the diffuse-reflectance spectra
of powder glucose (red) and pure water (blue) are also shown. In this figure, the intensity of diffuse-reflectance spectra for
powder glucose and water are unscaled.
Although the whole blood spectral patterns are
similar to each other, the baseline and intensity are
relatively different. They do not entirely overlap due
to the baseline variations and multiplicative
scattering. For PCA and PLSR analyses, each
spectrum was normalized to avoid a multiplicative
scattering effect and then the first derivative was
taken to correct the baseline variations. Figure 2
shows the first derivative spectra. The box with the
broken line shown at 4200-5000 cm
-1
indicates this
study’s target region for analyses (vide infra). The
inset at the top right corner of the figure enlarges the
spectral structure around the target region.
Figure 2. First derivative spectra of the whole blood. The target region for the analyses is indicated by a box with a broken
line and enlarged in the inset for clarity.
IMC-SciMath 2019 - The International MIPAnet Conference on Science and Mathematics (IMC-SciMath)
304
A singular value decomposition (SVD) analysis of
the data matrix was applied to determine the spectral
region that effectively contributed to the PCA and
PLSR models. It shows that the effective spectral
region is 4200 - 500 cm
-1
. The details of the PCA
and PLSR calculations used in this paper are
published elsewhere (Abdi, 2010; Tharwat (2016).
The PCA and PLSR models were then calculated
using a
target spectral region of 4200 - 5000 cm
-1
. The
specified target region was chosen based on the
minimum predicted residual error sum of square
(PRESS) at the optimum number of latent variables
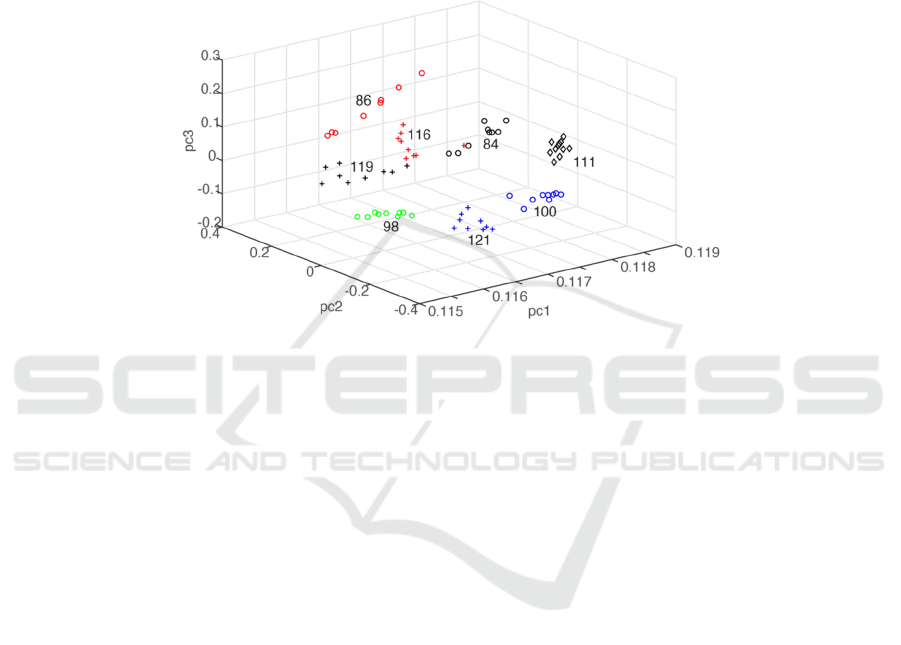
in PLSR calculations. Figure 3 depicts the PCA plot
of the 73 spectral data. Each of the eight groups has
different glucose clustering at their unique pc1- pc2
-pc3 space coordinates except one spectrum of 116
mg/dL located at the 84mg/dL group coordinate.
Figure 3. PCA results of seventy-three spectral data. The spectra are grouped into eight clusters based on their glucose
content in whole blood. The value indicated in each group designates the glucose content in mg/dL.
In the PLSR analysis, the 73 spectral data were
divided into two parts; 37 spectra were used for the
calibration data set, while the remaining 36 were
used for the validation data set. It was ensured that
in each set, the spectrum from samples containing
glucose of 84, 86, 98, 100, 111, 116, 119, and 121
mg/dL were represented in almost equal numbers.
Initially, the regression parameters were calculated
using a calibration data set. Finally, these parameters
were employed to predict the glucose levels through
the corresponding spectrum in the validation data
set. The region for analysis remained the same as
that used in the PCA analysis. The number of latent
variables was N=8, by which the PRESS value
reached a minimum. The latent variable obtained in
this analysis was the same as that obtained for cases
of glucose in an aqueous solution. Figure 4 shows
the results of the NIR predictions compared to the
ones measured by electrode strips (reference). The
blue circles indicate the results of the NIR
predictions of the glucose content for samples in the
calibration data set, while the red ones represent NIR
predictions for the validation data set. The
coefficients of the determination (R
2
) were 0.97 and
0.75 for the calibration and validation, respectively.
For PRESS, the obtained values were 70.7 and 181.4
for the calibration and validation, respectively.
Normally, both the R
2
and PRESS for the validation
data will be smaller than that of the calibration data
set, as in the present case.
Blood Glucose Determination by Fourier Transform near Infrared Spectroscopy
305
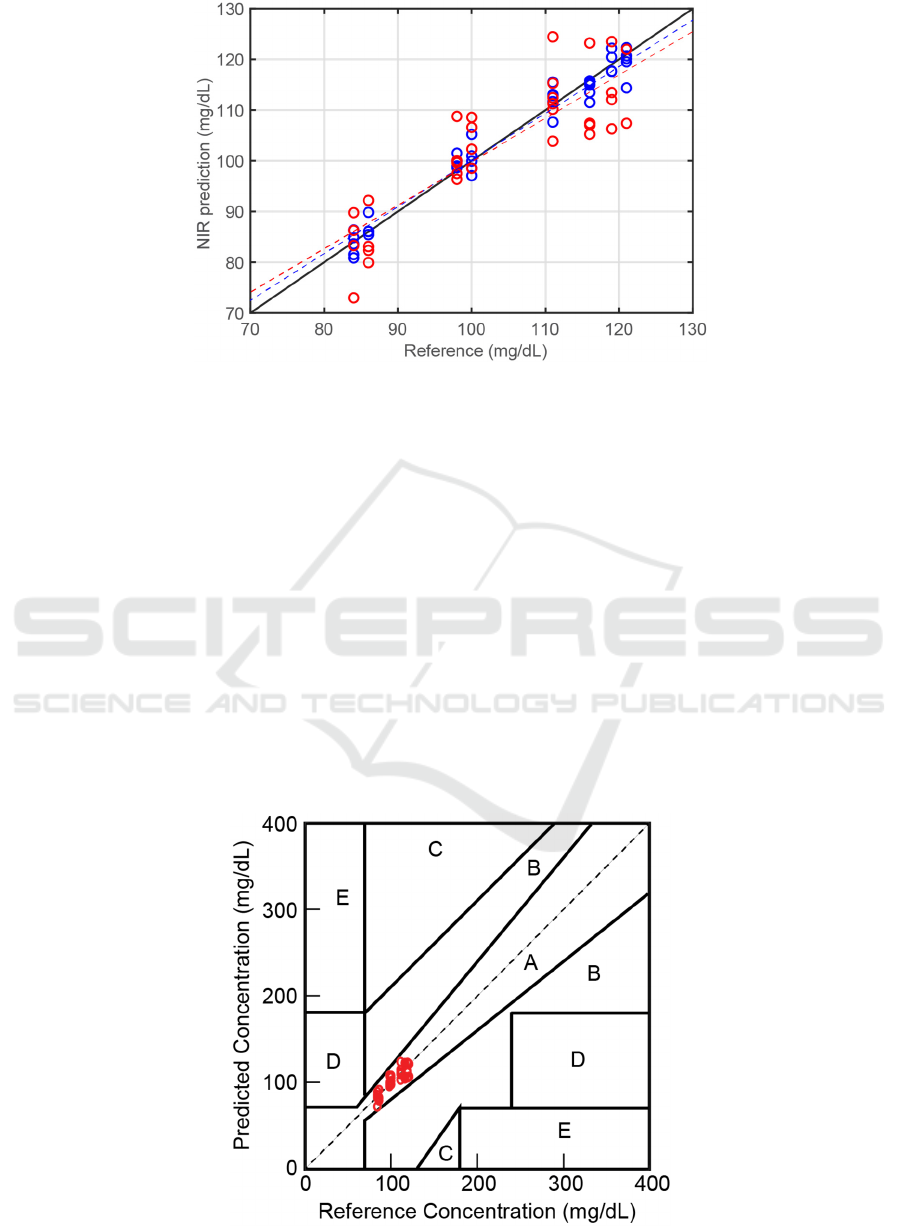
Figure 4. Comparisons between the NIR predictions and the reference values of the glucose content in whole blood. The
blue and red circles represent the calibration and validation sets, respectively. The broken blue line shows the linear fitting
for the calibration data set, while the broken red line shows the linear fitting for the validation data set. The solid black line
is displayed for guidance purposes.
The results of the NIR prediction of glucose in the
present study appear relatively scattered as though
less precise when compared to the NIR predictions
obtained in previous studies Rondonuwu et al., F
(2019). In the previous studies, however, the glucose
contents were systematically prepared at a certain
level so that the reference values were highly
accurate. In this study, the reference values solely
relied on the strip electrode measurements using a
glucometer that has relatively large random
deviation values. To evaluate the NIR predictions of
the validation set in terms of clinical accuracy, we
applied the Clarke error grid analysis. All of the NIR
prediction data points in the validation data set were
then transferred into the Clarke diagram, as
indicated in Figure 5. In the Clarke diagram, region
A was estimated to be clinically accurate, while
region B was considered clinically acceptable. In
this model, all of the 36 NIR predictions fall into
region A, which means they are clinically accurate.
Note that the examination range in this study is
limited within 80 to 130 mg/dL, which is the range
of healthy subjects. A more extensive range is
necessary but requires diabetic volunteers. In this
study, diabetic volunteers were not employed since
they need specialized medical attention, and it is
relatively challenging to promote them with extra
food and beverages with high calories.
Figure 5. Clarke error grid diagram. The red circles indicate the NIR predictions of the validation data set.
IMC-SciMath 2019 - The International MIPAnet Conference on Science and Mathematics (IMC-SciMath)
306

In this study, we only employed a single volunteer
for a short time, which means the only differential
factor affecting the measurement is glucose. The rest
of the constituents, including lipids, proteins, and the
physical parameters such as viscosity and
temperature, are practically unaltered. In a more
realistic model, different volunteers having a variety
of whole blood conditions must be included in a
database of PLSR calculations to increase the
validity and accuracy of the method.
4 CONCLUSION
The glucose content in whole blood can be
determined by employing near-infrared spectroscopy
followed by the partial least squares regression
model in the 4200-5000 cm
-1
spectral region. Based
on the Clarke error grid, the NIR spectroscopy
technique followed by a PLSR analysis from a
single volunteer in the 80-130 mg/dL was
successfully predicted to be clinically accurate.
These results shed light on the NIRS technique
followed by the PLSR calculation to provide an
effective and non-invasive approach to measure
blood glucose levels.
ACKNOWLEDGMENTS
This research was supported by a grant (ID#:
c4c249c1-1f90-432b-affd-45d9544c8e89) from the
Ministry of Research, Technology, and Higher
Education, of the Republic of Indonesia, the
Directorate Research and Community Service
(DRPM) under the scheme of PDUPT 2019.
REFERENCES
Abdi H 2010 Partial least squares regression and
projection on latent structure regression (PLS
Regression) (London: Wiley Interdisciplinary
Reviews: Computational Statistics) chapter 2 pp 97–
106
American Diabetes Association 2004 Diagnosis and
classification of diabetes mellitus. Diabetes Care, pp
27, 5–10.
Basu D, Kulkami R 2014 Indian Journal of Anaesthesia 58
529.
Center for Disease Control and Prevention 2016 National
Diabetes Statistics Report: Estimates of Diabetes and
Its Burden in the United States.
Dingari N C, Barman I, Singh G P, Kang J W, Dasari R R
and Feld M S 2011 Analytical and Bioanalytical
Chemistry 400 2871
Ferrante do Amaral C E, Wolf B 2008 Med. Eng. Phys.,
30, 541
Kurasawa S, Koyama S, Ishizawa H, Fujimoto K and
Chino S 2017 Sensors 17 2702
Lam S C H, Chung J W Y, Fan K L and Wong T K S 2010
Spectroscopy 24 629
Maria L F Simone, Rafael A. C. Parrela, Robert E
Schaffert, Cynthia M B Damasceno 2017
Microchemical Journal 134 125
Oliver N S, Toumazou C, Cass A E, Johnston D G 2009
Diabet. Med., 26, 197.
Pandey R, Paidi S K, Valdez T A, Zhang C, Spegazzini N,
Dasari R R and Barman I 2017 Accounts of Chemical
Research 50 264
Rondonuwu F S, Setiawan A, Karwur F F 2019 J. Phys.:
Conf. Ser. 1307 012019
Robinson M R, Eaton R P, Haaland D M, Koepp G W,
Thomas E V, Stallard B R, Robinson, P L 1992 Clin.
Chem., 38, 1618
Saleh G, Alkaabi F, Al-Hajhouj N, Al-Towailib F, Al-
Hamza S 2018 J. Med. Eng. Technol 42(2) 140
Sekulic S, Wakemen J, Doherty P, Hailey P 1998 J.
Pharm. Biomed. Anal. 17 1285
Simeone M L F, Parrella R A C, Schaffert R E,
Damasceno C M B, Leal M C B and Pasquini C 2017
Microchemical Journal 134 125
Torpy J M, Lynm, C, Glass R M 2014 Tharwat A 2016
International Journal of Applied Pattern Recognition
197 1
Uwadaira Y, Ikehata A, Momose A and Miura M 2016
Biomedical Optics Express 7 2729
Yano T, Funatsu T, Suehara KI, and Nakano Y 2001
JNIRS 9 43
Zhang W, Liu R, Zhang W, Jia H and Xu K 2013
Biomedical Optics Express 4 789
Zhang C and Su J 2014 Acta Pharmaceutica Sinica B
4 182
Blood Glucose Determination by Fourier Transform near Infrared Spectroscopy
307
