
Analysis of Lard Adulterated in Beef Sausages:
Influence of n-hexane Concentration and Maceration Time
Desi Ardilla
1*,
Muhammad Taufik
2
, Dafni Mawar Tarigan
1
, Muhammad Thamrin
1
, Mariany Razali
3
,
Revi Trisna Siregar
1
, Irfan Kurniawan
1
, Nur Waridah Angriani Nasution
1
, Rika Astuti Pulungan
1
and
Sri Dewi Sihotang
4
1
Agricultural Technology Department, Universitas Muhammadiyah Sumatera Utara, Medan, Indonesia
2
Chemistry Department, Universitas Sumatera Utara, Medan, Indonesia
3
Pharmacy Department, Universitas Tjut Nyak Dhien, Medan, Indonesia
4
Pharmacy Department, Universitas Muslim Nusantara Al Washliyah, Medan, Indonesia
irfankurniawan0987, nurwaridahnst}@gmail.com, {rikaastuti, sridewi}@yahoo.com
Keywords: Beef Sausages, Nohexane, Lard, Concentration, Solven.
Abstract: Prime food products must pay attention to product halal factors that have an impact on consumers. some
products that are circulating in the general public are often adapted with other ingredients. Beef sausages is
a processed product that is often adulterated with lard. This work aims to study the comparison of solven
concentration (n-hexane) and maceration time on the analysis of beef sausage hat were added with lard. The
Factorial Completely Randomized Design (CRD) was developed used two (2) replications. Factor I was the
Solvent Concentration (C) which consists of four levels : C
1
= 20%, C
2
= 30%, C
3
= 40%, C
4
= 50% and
Factor II was the maceration time (W) consisting of four levels : W
1
= 6 Hours, W
2
= 12 Hours, W
3
= 18
Hours, W
4
= 24 Hours. The results showed that the concentration of n-hexane in beef sausages adulterated
with lard gave a significant difference (P> 0.01) on specific gravity, a significantly different effect (P> 0.01)
on iodine numbers. Real and tangible realization (P <0.05) to iodine numbers. The maceration gives a
significant difference (P> 0.01) to the specific gravity, the difference is significantly different (P> 0.01) with
respect to iodine number. The Concentration of lard at C
1
W
1
, C
2
W
2
, C
3
W
3
and C
4
W
4
were analyzed using
UV spectroscopy respectively 23, 35, 41, and 54%.
1 INTRODUCTION
At the present time it often happens important food
ingredients in the form of processed or raw from
other countries to Indonesia without going through
in-depth testing. The rate of increase in population
followed by improvement in living standards and
changes in consumer tastes have changed
consumption patterns that lead to animal protein
(Fadzlillah et al., 2011). Meat is a food that is widely
used as an ingredient for food diversification,
because meat contains many nutrients and can be
processed into a variety of dishes (Liu et al., 2018).
The increase in beef consumption has not been
offset by an increase in domestic production, both in
quality and quantity, resulting in an increasingly
large gap between demand and supply. Based on the
prognosis of beef production in the country in 2017
amounted to 354.770 tons, while the estimated
domestic demand for beef in 2017 amounted to
604.968 tons (Doosti & Dehkordi, 2014).
The halalness of a food product is very important
to be considered in consuming food products
(Sukmawati, 2018). For the category of processed
food, the halal status of a food product is highly
dependent on halal and the prohibition of raw
materials and additives about food (Hilda & Si,
2014). Explanation of the Food Law states that the
implementation of food safety for activities or
processes of food production for consumption must
be done through food sanitation, regulation of food
additives, setting food packaging standards,
providing food safety guarantees and food quality,
and guaranteeing halal products for the required
(Burlian, 2013).
One of the halal concepts in Islam is that food
does not contain "lard" or food fat derived from pigs.
Ardilla, D., Taufik, M., Mawar Tarigan, D., Thamrin, M., Razali, M., Trisna Siregar, R., Kurniawan, I., Waridah Angriani Nasution, N., Astuti Pulungan, R. and Dewi Sihotang, S.
Analysis of Lard Adulterated in Beef Sausages: Influence of n-hexane Concentration and Maceration Time.
DOI: 10.5220/0010137900002775
In Proceedings of the 1st Inter national MIPAnet Conference on Science and Mathematics (IMC-SciMath 2019), pages 149-154
ISBN: 978-989-758-556-2
Copyright
c
2022 by SCITEPRESS – Science and Technology Publications, Lda. All rights reserved
149

The presence of this component of lard, as low as
any of its ingredients in food, will bring the food to
be forbidden for consumption (Mayasari, 2019).
Several studies have been conducted to find the right
method to detect the presence of lard in food. In
previous studies identification of lard in vegetable
oils was carried out with Gas-Liquid
Chromatography combined with multivariate
analysis. Using GLC, lard of 2% can be detected in
vegetable oils (Naquiah et al., 2017). In addition to
GLC, HPLC has also been used to identify lard by
5% in meat products. However, most of these
methods require a lot of time and are impractical to
apply. This requires the development of a fast and
practical method for identification of lard (Lopes et
al., 2017).
Another method that can be used to identify the
presence of lard in beef is the Fourier Transform
Infra Red (FTIR) method to analyze the presence of
lard in goat and beef fat combined with multivariate
PLS analysis. Multivariate PLS analysis was used to
detect lard in the mixture with goat fat for detection
of lard in the mixture with beef fat. Lard
identification with FTIR combined with
Discriminant Analysis and PLS Analysis (Rohman
& Fadzillah, 2018). The FTIR method has the
potential to be used as a tool to detect lard quickly
with consistent results. This is because FTIR can
provide analysis results of fat from pigs that are
mixed with other fats consistently, even with a low
content . The weakness of the FTIR method is only
able to detect contamination if the prediction model
is made according to the sample being tested. This
becomes very difficult if the food sample to be
tested is unclear, and its exact composition is not
known (Fadzlillah et al., 2011). This work aims to
study the comparison of hexane concentration and
time to the analysis of beef sausage which has been
adulterated with lard
2 METHOD
Materials
The ingredients used in this research are processed
sausage and lard products. The chemicals used in
this study were n-hexane, PP indicator, KOH /
NaOH, amylum indicator, Diethyl Ether, Na
2
SO
4,
Ethanol, Aquades, Iodine, KI, CHCl
3
, Saturated
Solution, , Nutriet Agar, and Chloroform.
Equipment
In this work, we used erlenmeyer, biuret, glass
beaker drop pipette separating funnel, analytical
balance, gloves, test tube, knife, clamp, oven,
laminar, incubator, autoclave, spreader, flannel, tube
racks ice cream cup, hotplate, stirrer, cotton, plastic
wrap and petridish.
Research method
This research method was described a factorial
completely randomized design (CRD) method
consisting of 2: Factor I: Solvent Concentration
consisting of 4 levels, They are : C
1
= 20%, C
2
=
30%, C
3
= 40%, C
4
= 50% . Factor II: Maceration
Time consisting of 4 levels, namely: W
1
= 6 Hours,
W
2
= 12 Hours, W
3
= 18 Hours, W
4
= 24 Hours. The
number of treatment combinations (Tc) is 4 x 4 = 16,
so the number of replications (n) wasv as follows:
Tc (n-1) ≥ 15
16 (n-1) ≥ 15
16 n-16 ≥ 15
16 n ≥ 31
n ≥ 1,937.............rounded to n = 2
then for the accuracy of the study, repeated 2 (two)
times.
Preparation and maceration
Samples to be tested are processed products of pork
sausage and lard. Both samples were mixed. Sample
Extraction Preparation, including weighing the
sample (pork sausage and lard), smoothed material
(cut into cubes), put into a container, then add the
solvent according to the concentration and
maceration according to the specified factors.
Observation parameters
Observation parameters are based on analysis which
includes: specific gravity and iodine numbers.
Spectrofotometry UV analysis
UV spectroscopy Beckman DU640 UV / Vis was
used analyzing the lard contained in beef corneds. In
this work, the wavelangth was used in the range 200
- 400 nm. The standard of lard was determined at 5,
10, 15, 20, 25%.
3 RESULT
3.1 Statistical Test Measurement
Base of the statistical tests, in general it shows that
the concentration of n-hexane affects the observed
parameters. Data on the average observations of the
effect of n-hexane concentration on each parameter
can be seen in Table 1.
IMC-SciMath 2019 - The International MIPAnet Conference on Science and Mathematics (IMC-SciMath)
150
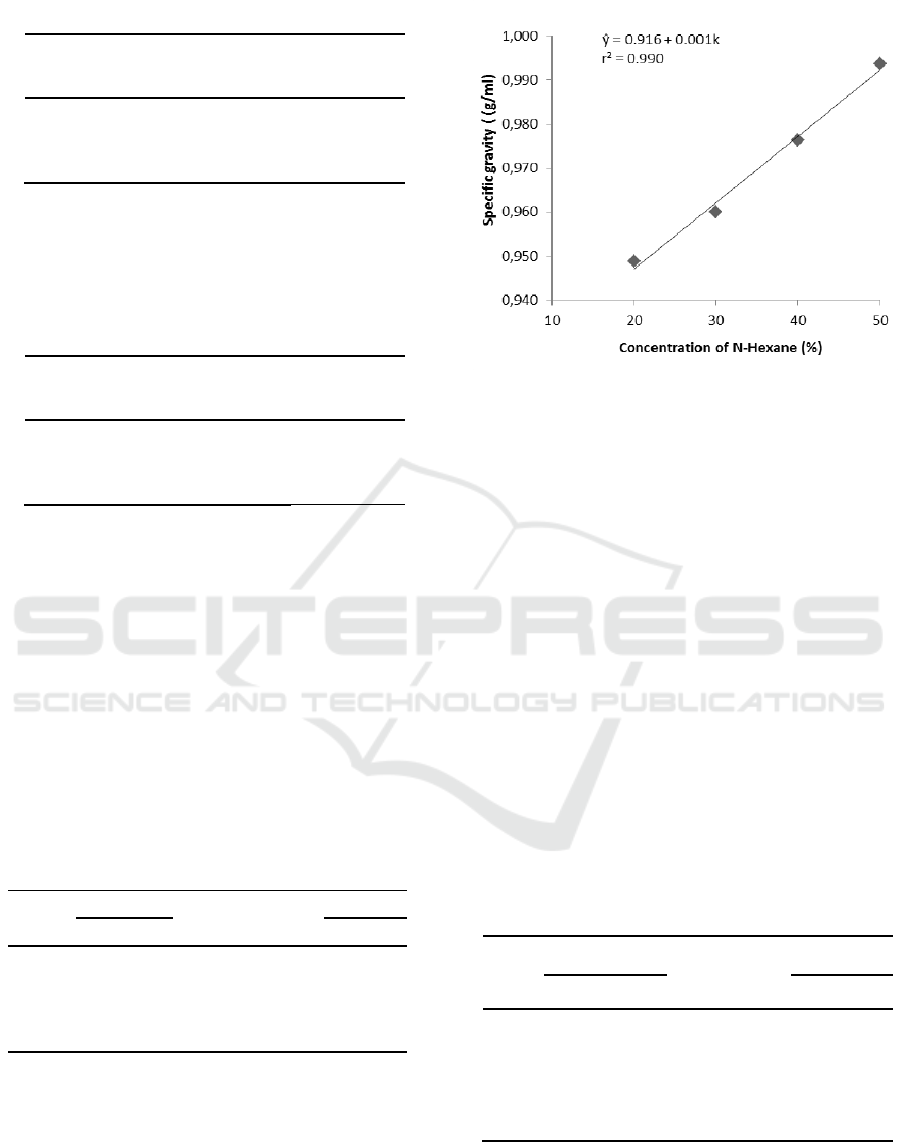
Table 1: Effect of N-Hexane concentration.
n-hexanne
Concentration
(C) (%)
Specific
gravity
(g/ml)
Iodine
number
(mg/g)
K
1
= 20 % 0.950 70.397
K
2
= 30 % 0.959 71.920
K
3
= 40 % 0.975 74.965
K
4
= 50 % 0.993 76.584
Maceration time after being tested statistically
ifluences the observed parameters. Data on the
average observation results of maceration time can
be seen in Table 2.
Table 2: Effect of maceration time.
n-hexanne
Concentration
(C) (%)
Specific
gravity
(g/ml)
Iodine
number
(mg/g)
W
1
= 6 0.942 69.850
W
2
= 12 0.958 73.251
W
3
= 18 0.972 74.314
W
4
= 24 1.002 76.452
Table 2 shown the effect of maceration time on
specific gravity and iodine number acid number,
iodine number, and the number of microbes was
increasing.
3.2 Specific Gravity
Effect of N-Hexane Concentration
Based on the list of variance it can be seen that the
concentration of N-Hexane has a significantly
different effect (P> 0.01) on specific gravity. The
level of difference has been tested with the average
difference test can be seen in Table 3.
Table 3: Average difference test results on the effect of
maceration time on specific gravity.
Distance
LSR Treatment
Average
Notation
0,05 0,01 C 0,05 0,01
- - - 20 0.950 cd CD
2 0.017 0.021 30 0.962 bc BC
3 0.018 0.022 40 0.975 b AB
4 0.018 0.023 50 0.993 a A
Table 3 shown that C
1
is not significantly different
from C
2
and very significantly different from C
3
, and
C
4
. C
2
is not significantly different from C
3
and C
4
.
C
3
is not significantly different from C
4
. The highest
type of weight is in the K4 treatment that is 0.994 gr
/ ml and the lowest is in the K1 treatment that is
equal to 0.945 gr / ml. For more details can be seen
in Figure 1.
Figure 1: Relationship of N-Hexane solvent concentration
to weight.
Figure 1 shown the concentration of n-Hexane to
specific gravity. The more concentration of n-hexane
solvent used, the specific gravity is also increasing,
namely 0.994 g / ml. This is because the number of
other components contained in beef sausage and
mixing with the components contained in lard causes
the specific gravity increases. The substance has a
large mass then the probability of its specific gravity
also becomes greater. The high specific gravity
produced from the sample is caused by other
compositions contained in lard.
Effect of maceration time
Based on the list of variance, it can be seen that the
maceration time has a very significant effect (P>
0.01) on specific gravity.
The level of difference has been tested with the
average difference test can be seen in Table 4.
Table 4: Average difference test results on the effect of
maceration time on specific gravity.
Dis
tance
LSR
Treat
ment
Ave
rage
Notation
0,05 0,01 W 0,05 0,01
- - - 6 0.943 d CD
2 0.016 0.022 12 0.960 bc BC
3 0.017 0.023 16 0.968 b B
4 0.017 0.024 24 1.009 a A
Note: Different letters in the notation column show
significantly different effects at the level (P <0.05)
and very significantly different at the level (P>
0.01).
Analysis of Lard Adulterated in Beef Sausages: Influence of n-hexane Concentration and Maceration Time
151
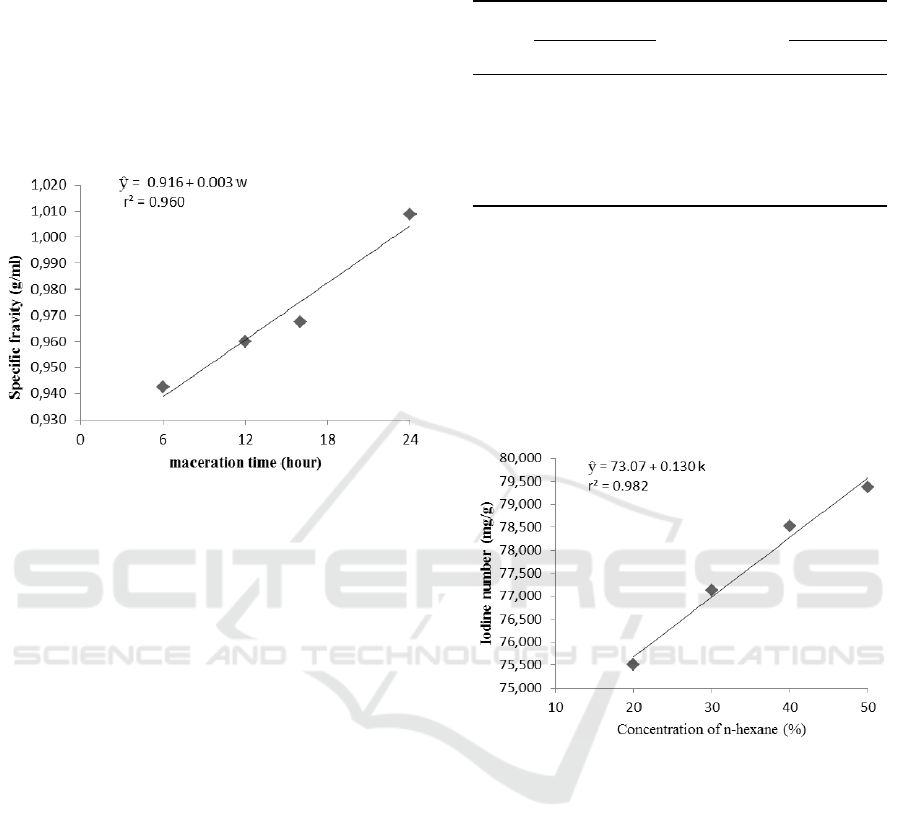
Table 4 shown that W
1
is not significantly
different from W
2
, and very significantly different
from W
3
and W
4
. W
2
is not significantly different
from W
3
and very significantly different from W
4
.
W
3
is very different from W
4
. The highest type of
weight was found in the W
4
treatment that was 1,009
gr / ml and the lowest was in the W
1
treatment which
was 0,943 g / ml. For more details can be seen in
Figure 2.
Figure 2: Relationship of macerated time to weight of
types of processed products of beef sausage adulterated
with lard.
Figure 2 shown the maceration time of specific
gravity in beef sausages adulterated. The longer of
the extraction time, the greater the specific gravity
value obtained. Maceration is done by immersing
simplex powder in a liquid solution. The search
liquid will penetrate the cell wall and enter the cell
cavity which contains the active substance, the
active substance will be dissolving at the difference
concentration. The active substance solution was
pushed out. Figure 2. shown the greater the
comparison of maceration time, the resulting yield
increases. The longer the maceration time used
would also increase the amount of dissolved
compounds (Mas et al., 2019). As a result, the
extraction rate will increase.
3.3 Iodin Number
The concentration N-hexane effect
Based on the list of variance, it can be seen that the
concentration of N-Hexane (solvent) has a
significantly different effect (P> 0.01) on the iodine
numbers. The level of difference has been tested
with the average difference test can be seen in Table
5.
Tabel 5: Average difference test results effect of the
concentration of N-Hexane on iodine numbers.
Dis
tance
LSR
Treat
ment
Ave
rage
Notation
0,05 0,01 C 0,05 0,01
- - - 6 69.859 d D
2 0.589 0.811 12 73.254 c C
3 0.618 0.852 18 74.300 b B
4 0.634 0.873 24 76.459 a A
Table 5 shown that C
1
(Concentration 1) differs
very significantly from C
2
(Concentration 2), C
3
(Concentration 3) and C
4
(Concentration 4). C
2
(Concentration 2) was very different than C
3
(Concentration 3) and C
4
(Concentration 4). The C
3
was very different than C4 (Concentration 4). The
highest iodine number in C
4
treatment is 76.459 mg
/g and the lowest in C
1
treatment is 69.859 mg /g.
This data was showed at Figure 3.
Figure 4: Relationship of N-Hexane solvent concentration
to iodine numbers.
Figure 4 shown the concentration of n-hexane
with iodine number. Iodine number gave a
determination of the level of unsaturation of a fat or
oil, therefore iodine number is equal to the
unsaturation of an acid or fat. From the above data in
this study produced a fairly high of iodine number.
Where the more the concentration of n-hexane
solvent is used, the iodine number was increasing at
76.459 mg / g. This is due to the fact that n-hexane
has better solubility or reaction (Nees et al., 2017). If
iodine number is getting higher, then the double
bond contained in lard will also be more. The more
of double bonds in the melting point of lard will be
lower and cause lard to be more easily oxidized so
that the number of peroxides is higher (Liu et al.,
2018).
IMC-SciMath 2019 - The International MIPAnet Conference on Science and Mathematics (IMC-SciMath)
152
Effect of maceration time
Based on the list of variance it can be seen that the
maceration time has a very significant effect (P>
0.01) on iodine numbers.
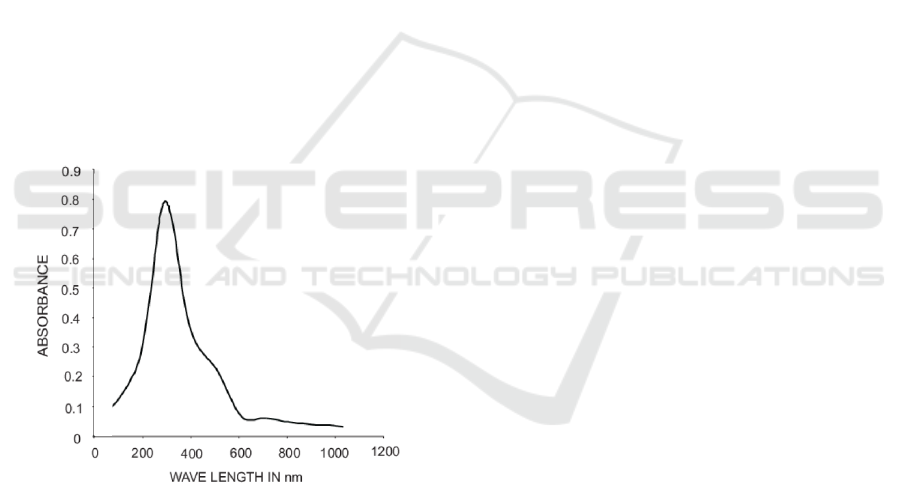
3.4 Analysis UV Spectroscopy Data
UV spectroscopy using DU640 UV / Vis type using
a wavelength of 200-400 nm. The standard lard
solution is made in concentrations of 5, 10, 15, 20,
25%. This method measured relative light energy if
the energy obtained from the sample is transmitted,
reflected or emitted as a function of the wavelength.
In this work, UV-Vis (Ultra Violet-Visible)
spectrophotometer was chosen from many
instruments commonly used in analyzing lard in
animals. Spectrophotometers are commonly used
because of their ability to analyze so many chemical
compounds and their practicality in terms of sample
preparation when compared with several methods of
analysis. The concentration of the solution analyzed
will be proportional to the amount of light absorbed
by the substance contained in the solution. The
optimum wavelength is obtained at 270 nm with the
absorbance value obtained in Figure 5.
Figure 5: UV spectrum at 270 nm.
Figure 5 shown that the UV spectral at 270 nm of
the optimum wavelength. The Concentration of lard
at W1K1, W2K2, W3K3 and W4K4 were analyzed
using UV spectroscopy respectively 23, 35, 41, and
54%.
4 CONCLUSIONS
Beef sausages was adulterated with lard have
spesification of physical properties. This product
that is often adulterated with lard. The concentration
of n-hexane in beef sausages adulterated with lard
was a significant difference (P> 0.01) on specific
gravity, gave a significantly different effect (P>
0.01) on iodine numbers, and not significant (P
<0.05) of acid numbers. Real and tangible
realization (P <0.05) to iodine numbers. The
maceration gives a significant difference (P> 0.01)
to the specific gravity, the difference is significantly
different (P> 0.01) with respect to iodine, the
difference was not significant (P <0.05) with respect
to the acid number. The Concentration of lard at
W
1
K
1
, W
2
K
2
, W
3
K
3
and W
4
K
4
were analyzed using
UV spectroscopy respectively 23, 35, 41, and 54%.
ACKNOWLEDGEMENTS
This study funded by DRPM (2019) of Ministry of
Research Technology and High Education of the
Republic of Indonesia Year.
REFERENCES
Burlian, P. (2013). Reformulasi Yuridis Pengaturan
Produk Pangan Halal. Ahkam, XIV, 43–52.
Doosti, A., & Dehkordi, P. G. (2014). Molecular assay to
fraud identification of meat products. J Food Sci
Technol, 51(January), 148–152.
https://doi.org/10.1007/s13197-011-0456-3
Fadzlillah, N. A., Man, Y. B. C., & Jamaludin, M. A.
(2011). Halal Food Issues from Islamic and Modern
Science Perspectives. 2011 2nd International
Conference on Humanities, Historical and Social
Sciences IPEDR.
Hilda, L., & Si, M. (2014). Analisis Kandungan Lemak
Babi dalam produk pangan di Padangsidimpuan secara
kualitatif dengan menggunakan Gas Kromatografi
(GC). Tazkir, 9, 1–15.
Liu, M., Lampi, A., & Ertbjerg, P. (2018). Unsaturated fat
fraction from lard increases the oxidative stability of
minced pork. Meat Science, 143, 87–92.
https://doi.org/10.1016/j.meatsci.2018.04.028
Lopes, M., Gomes, A. S., Silva, C. M., & Belo, I. (2017).
Microbial lipids and added value metabolites
production by Yarrowia lipolytica from pork lard
Microbial lipids and added value metabolites
production by Yarrowia lipolytica from pork lard.
Journal of Biotechnology, 265, 76–85.
https://doi.org/10.1016/j.jbiotec.2017.11.007
Mas, F., Bangngalino, H., Indriati, S., Todingbua, A., &
Sayuti, M. (2019). Model development to enhance the
solvent extraction of rice bran oil. OCL Journal,
26(16), 1–9.
Mayasari, N. E. (2019). Perlindungan hukum pada kasus
suplemen makanan yang mengandung babi. 1.
Analysis of Lard Adulterated in Beef Sausages: Influence of n-hexane Concentration and Maceration Time
153

Naquiah, A. N., Marikkar, J. M. N., Mirghani, M. E. S.,
Nurrulhidayah, A. F., & Yanty, N. A. M. (2017).
Differentiation of Fractionated Components of Lard
from Other Animal Fats Using Different Analytical
Techniques. Sains Malaysiana, 46(2), 209–216.
Nees, C., Blume, N., Wardatun, S., Rustiani, E., Alfiani,
N., & Rissani, D. (2017). Study Effect Type of
Extraction Method And Type of Solvent To
Cinnamaldehyde and Trans-Cinnamic Acid Dry
Extract Cinnamon. J Young Pharm, 9(1), 49–51.
https://doi.org/10.5530/jyp.2017
Rohman, A., & Fadzillah, N. A. (2018). 21 - Lipid-based
techniques used for halal and kosher food
authentication. In Preparation and Processing of
Religious and Cultural Foods. Elsevier Ltd.
https://doi.org/10.1016/B978-0-08-101892-7.00021-3
Sukmawati. (2018). Total Microbial Plates on Beef and
Beef Offal. Bioscience, 2(1), 22–28.
https://doi.org/10.24036/02018219825-0-00
IMC-SciMath 2019 - The International MIPAnet Conference on Science and Mathematics (IMC-SciMath)
154
