
Designing Performance Measurement Model for
Green Supply Chain Pulp
Kimberly Febrina Kodrat
1
, Novizar Nazir
2
and Derlini
1
1
Faculty of Engineering, Institut Teknologi Medan, Jalan Gedung Arca No. 54 Medan, Indonesia
2
Faculty of Agricultural Technology, Universitas Andalas, Padang, Indonesia
Keywords: Firm Performance, Performance Measurement Model, Supply Chain Performance.
Abstract: Measuring performance is necessary to do in order to know the effectiveness and efficiency of the supply
chain in the aspect of reducing costs and environmental impacts. The objective of this research is to
integrate the concept of lean and green supply chain to design performance measurement model for pulp
supply chain. This research was carried out only to the stage of designing system structure of supply chain
performance measurement conceptually. Integrating the green concept was designed using a Balanced
Scorecard (BSC) perspective covering financial, customer, internal process business and learning and
growth. Key Performance Indicators (KPI) was grouped according to the BSC perspective. Next, a paired
comparison process was carried out to get the weight of each KPI. The paired comparison assessment of
each KPI was based on the opinion of the selected experts referring to the experiences and knowledge
relevant to this research. Paired comparison was intended to get the weight of each KPI using the Analytical
Hierarchy Process (AHP) method. The weight generated from each KPI will be ordered in descending for
priority determination. The performance measurement model will be validated using face validity method.
The designed structure of the model showed that the customer perspective is a priority aspect in the pulp
supply chain at PT TPL. The implementation of this model requires coordination for easy access to
information among departments and the involvement of all company employees.
1 INTRODUCTION
Pulp or commonly called as paper pulp is paper
making material. Paper is a thin and flat material
produced by compression of fibers derived from
pulp containing cellulose and hemicellulose. Pulp is
the basic material of various paper-based products
ranging from boards used in factories to daily
necessities such as paper, tissue, tea bags, and
magazines. Pressures and movements influenced by
globalization drive companies to improve
environmental performance (Zhu & Sarkis, 2006).
The importance of relationships among
organizations encourages companies to integrate
networks with suppliers and consumers to create the
concept of Supply Chain Management (SCM).
Sustainable development relates to
environmental aspects. The concept of sustainable
development appears along with human awareness
to the environment. Sustainable development is
developed due to the anxiety of low earth ability
to support life. It happens as the effect of explosion
of high population, the increasing of human activity,
the intensity of natural resources explotation which
are accompanied by an increase in the waste
released by nature.
The capacity support of the environment is
decreasing day after day because pollution tends to
increase (Setiawan et al, 2011). Therefore, the
environmental aspect should be considered in the
pulp industry. Pollution produced from the pulp
industry is contamination from liquid, solid and air
waste. In addition to environmental conditions,
natural resources and the role of government in
supporting the sustainability of the pulp industry, the
supply chain management should also be improved
so that all business processes can run well. In
improving the quality and quantity of pulp, effective
strategies and performance of the industry supply
chain flow are needed.
The concept of supply chain management is
needed by companies for the selection of activities
in order to increase the added value, meet customer
needs and deliver products to the end users. The
78
Febrina Kodrat, K., Nazir, N. and Derlini, .
Designing Performance Measurement Model for Green Supply Chain Pulp.
DOI: 10.5220/0010136600002775
In Proceedings of the 1st International MIPAnet Conference on Science and Mathematics (IMC-SciMath 2019), pages 78-85
ISBN: 978-989-758-556-2
Copyright
c
2022 by SCITEPRESS – Science and Technology Publications, Lda. All rights reserved

supply chain covers all stages involved both directly
or indirectly in meeting customer demand including
producers, suppliers, transporters, warehouses,
retailers and customers (Chopra & Peter, 2007).
Supply Chain Management (SCM) is a method, tool
or approach to supply chain management (Pujawan,
2005). In this series of supply chain activities, there
is an integrated and transparent flow of information
from suppliers to end customers making it easier to
control their implementation.
The issues of supply chain are currently starting
to develop and should be implemented by
companies, namely Green Supply Chain
Management (GSCM). All stages in GSCM affect
the environmental burden from resource extraction,
manufacturing, distribution, product use, waste
disposal and other activities. Risks associated with
the environment include: excessive use of water and
energy without conservation, use of hazardous
chemicals, pollution and so forth. Various ideas are
emerged from researchers and academics to
integrate environmental aspects into the
management of business processes so that the
GSCM concept was created (Shang et al., 2010).
According to (Mudgal et al., 2009), he explains
the benefits and importance of implementing green
supply chain in companies in reducing supply chain
costs and the environmental impact produced by the
company. The concept of GSCM itself is based on
an environmental perspective, namely how to reduce
waste and environmental impacts caused by
industrial company supply chain activities.
PT. Toba Pulp Lestari (TPL), a company owned
by Asia Pacific Resources International Limited
(APRIL) was established in 1992 producing pulp
located in Porsea, Toba Samosir Regency. The
production level produced by PT. TPL uses raw
material for eucalyptus trees. In producing pulp and
in marketing its products overseas, it is necessary to
apply the supply chain concept to help to select
activities to increase added value in meeting
customer needs and delivering products to end users.
Also, it is necessary to measure the performance of
the supply chain to see the level of effectiveness and
efficiency.
The principle of sustainability is emphasized in
vision of company, namely : be one of the largest,
well-managed, most productive, sustainable pulp
companies and loved by consumers and the public.
The vision and mission can be realized with concrete
strategies and objectives. A performance
measurement system for GSCM for pulp products is
needed to see the effectiveness and productivity of
the supply chain and realize the company's
sustainable principles.
The GSCM concept is urgently required in
designing a performance measurement system with
the perspective of the Balanced Scorecard (BSC) to
achieve an effective and efficient supply chain.
Measuring performance using BSC includes
financial perspectives, customers, internal business
processes, growth and learning. Therefore, the BSC
can accommodate important aspects in performance
measurement and is often used as a method of
measuring the performance of a company's supply
chain (Kaplan & Norton, 1996).
In the design of a system for measuring the
performance of pulp concepts based on the concept
of green, it is used to analyze the procurement of
raw materials, production to marketing the pulp.
Also, it is used to know whether it has applied the
concept of green in the sense of friendly-
environment or does not cause environmental
impacts and waste minimization caused by pulp
supply chain activities. The Implementation of this
green concept will produce important indicators that
indicate the level of their respective interests in
company performance so that companies can
determine the right company policies to improve the
effectiveness and efficiency of the supply chain
(Duarte et al., 2011).
2 RESEARCH METHODOLOGY
2.1 Study Site
This research was conducted at PT. Toba Pulp
Lestari located in Porsea District, Toba Samosir
Regency. The research took place from May 2019 -
August 2019. The research focused throughout the
supply chain from suppliers to pulp distributors.
2.2 Data Collection
Data collected in this study are data on pulp supply
chain business processes, production processes, raw
materials used and the area of raw material
suppliers, transportation, distribution areas and
marketing data regarding the parties involved
(stakeholders), company profile data, vision and
mission of the company, organizational structure and
line of business, various literatures related to
research, such as the concept of green to formulate
key performance indicators (KPI). The required data
are collected using the methods of observation,
Designing Performance Measurement Model for Green Supply Chain Pulp
79

literature study, interviews, KPI weighting
questionnaires and experts' opinion.
2.3 Research Implementation
The steps to carry out this research are as follows:
1. Understanding and analyzing PT. Toba Pulp
Lestari.
2. Formulating KPI from GSCM.
3. Grouping of GSCM KPIs in a BSC perspective.
4. Weighting and Determination of KPI priorities.
5. Designing a GSCM performance measurement
model in a BSC perspective.
6. Verificating and validating the performance
measurement model created.
2.4 Data Processing
The techniques used in analyzing data in this study
are as follows:
1. Analytical Hierarchy Process (AHP), AHP is used
to weigh each KPI to get the biggest weight of KPI.
The KPI which has the highest weight will be as the
priority of other KPIs.
2. Verification, Verification is carried out on the KPI
with the interview method, which is a direct
discussion to ensure that the results of the design of
the supply chain performance measurement system
can be correctly implemented. Then, it is analyzed to
know whether the KPI that is formulated has
covered all aspects needed in accordance with the
objectives and can be operated.
3. Validation, Validation is carried out to prove that
the results of the design of the supply chain
performance measurement system are feasible to be
applied in the company. The validation technique
used in this study is the face validity technique
asking for opinions from people who have
knowledge about the problem and can assess
whether the theory underlying the conceptual model
of the supply chain performance measurement
system design is correct and acceptable.
3 RESULTS AND DISCUSSION
3.1 Key Performance Indicator
Formulation (KPI)
The obtained KPI at the data collection stage is
verified to the company in order to determine the
suitability of these indicators with the supply chain
system in PT.TPL. Verification results show that
there are 10 KPIs with performance which can be
measured and in accordance with the existing supply
chain system. KPI is an important indicator that can
answer the needs of all stakeholders involved in PT.
TPL. Verification of green KPI as many as 10 KPI
can be seen in Table 1.
The definitions and descriptive formulations of
every KPI are as follows:
1. Energy-efficient operation, i.e. reduction in
energy use for all supply chain operations. The
amount of energy used when operating can be seen
from the ratio index value between the total energy
used in production with the total amount of cement
produced.
2. Waste disposition, i.e. the amount of waste
discharged into the environment produced in the
activities of the cement industry plant. Waste
disposition is a ratio index value between the weight
of waste discharged into the environment and the
total waste produced.
3. The use of material that can be recycled, that is
the amount of material that can be recycled. The use
of recyclable material is a comparison of the amount
of material that can be recycled with the total
amount of material used.
4. Collaborating with certified suppliers, i.e.
establishing cooperation with ISO certified standard
environment suppliers. The percentage of suppliers
who have an environmental certificate is a
comparison between the number of suppliers who
have an environmental certificate with the total
number of suppliers registered with the company.
5. Environmental costs, namely costs incurred to
preserve the environment. Total environmental costs
represent the total costs incurred to preserve the
environment such as waste management costs,
greening costs and environmental costs to preserve
the environment.
6. Air and water emissions, namely air and water
pollution caused by industrial activities in the form
of combustion substances in the production of
cement. The number of substances as a result of
combustion in production.
7. The use of substances that are not dangerous,
namely using materials that are friendly environment
and not harmful. The use of hazardous substances
can be determined from the number of uses of non-
hazardous substances used.
8. Decreasing frequency for environmental
accidents, ie reducing accidents environmental
accidents that occur. This frequency can be
determined by the number of accidentswork that
happened.
9. The level of customer interest in environmentally
friendly products, i.e. how concerned are they with
the environmental impact caused by the products
they consume. This can be determined from the
value of the comparison between customer interest
IMC-SciMath 2019 - The International MIPAnet Conference on Science and Mathematics (IMC-SciMath)
80
in environmentally friendly products to the overall
existing product.
10. Recycling efficiency, namely the effectiveness
of the recycling process in terms of the length of
time and costs incurred. Recycling efficiency can be
determined by comparing the time and costs
incurred for actual recycling against the time and
costs incurred for planned recycling.
Table 1: KPI Supply Green Green Pespective.
No KPI Kode
1 Energy saving operation G1
2 Waste disposition G2
3 The use of material which can be recycled G3
4 Cooperate with certified suppliers G4
5 Environmental costs G5
6 Air and water emission G6
7 The use of substances that are not dangerous G7
8 Frequency reduction for environmental accidents G8
9 The level of customer interest in friendly enviornment products G9
10 Efficiency of recycle G10
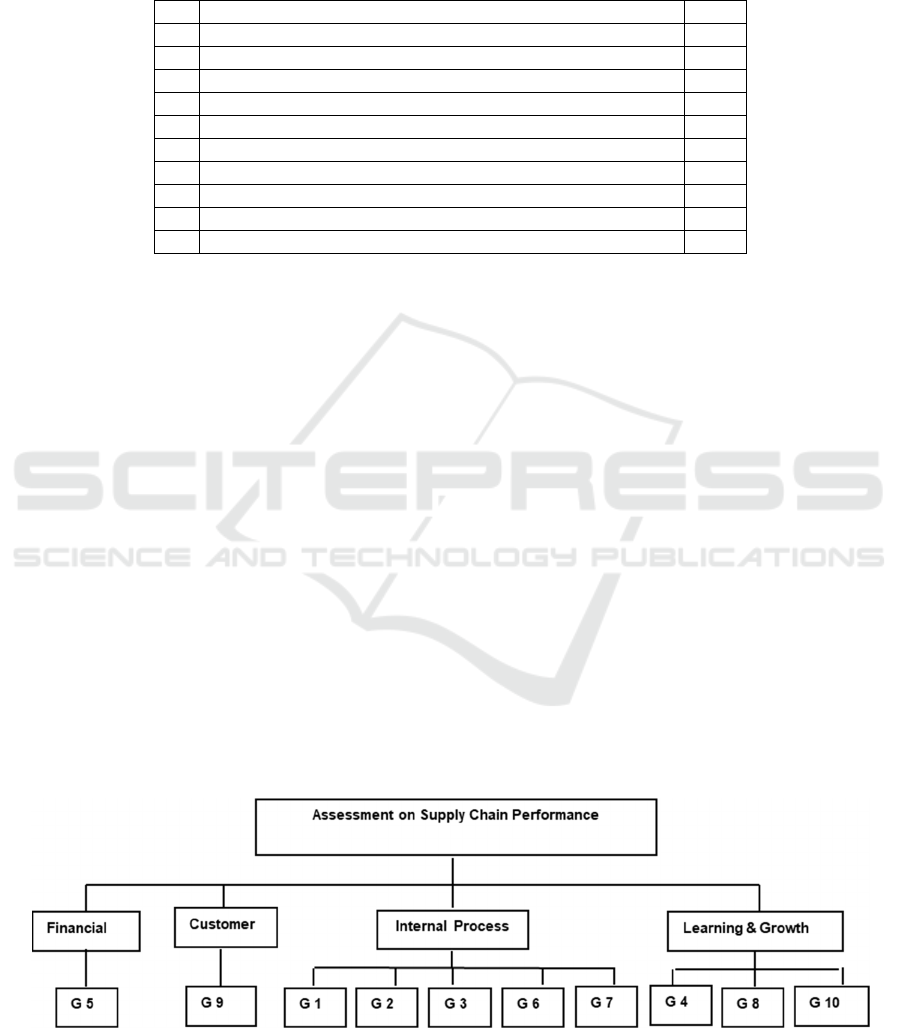
3.2 KPI Grouping in the Balanced
Scorecard (BSC) Perspective
The formulated KPIs are then grouped into a BSC
perspective consisting of financial, customer,
internal process business and learning & growth
perspectives. This is done to make it easier to do a
pairwise comparison of each indicator where the
pairwise comparison is done for each KPI that is in
the same group in the perspective of the BSC.
Financial perspective is related to how to serve the
shareholders who specifically use the measurement
of cash flow, return on capital, sales and income
growth. Customer perspective is related to the level
of customer satisfaction that specifically adds
measurements related to the level of damage, on-
time delivery, warranty support, product
development, and others derived from direct
customer input and linked to company-specific
activities. The internal perspective of business
processes and learning and growth is related to the
main competencies and areas of operating
excellence that have effective implementation as
measured by productivity, cycle times, quality
measurements, unproductive periods, various cost
measurements and others that are input to this
perspective.
The learning and growth perspective is related to
continuous improvement and value creation that
emphasizes measurements related to innovation and
organizational learning to calculate performance in
this dimension, leadership, technology, product
development cycle times, improved operating
processes, and others. The grouping of KPIs is done
by matching the understanding of each KPI to the
understanding and scope of each BSC perspective.
In addition, the grouping also refers to several
references related to the grouping of supply chain
KPIs against the BSC perspective. This grouping
can be done by structuring an integrated green
supply chain performance appraisal model in a BSC
perspective. The structure of the integrated green
supply chain performance appraisal model can be
seen in Figure 1.
Figure 1: Structure of the integrated Green Supply Chain Performance Assessment Model in the BSC Perspective
.
Designing Performance Measurement Model for Green Supply Chain Pulp
81

3.3 Weighting of KPI
Weighting of KPI is done to determine the priority
level and interest of each KPI towards other KPIs.
This weighting is done by making a pairwise
comparison among KPIs using a weighting
questionnaire that is assessed by an expert at PT.
TPL, academics in the field of green supply chain
and pulp practitioners (distributors) of PT. TPL. This
pairwise comparison value is processed with the
help of expert choice software to determine the
weight value of each KPI. The higher the weight
value of a KPI, the higher the level of importance
compared to other KPIs. The weight of each KPI can
be accepted if the inconsistency ratio value is less
than 0.1. The inconsistency ratio value shows the
level of consistency of the expert in providing value
from pairwise comparisons for each KPI.
3.3.1 Indicator Weight in BSC Scope
The results of this weighting are obtained from
pairwise comparisons between the four perspectives,
namely financial perspective, customer, internal
business processes and learning and growth using
expert choice software. Weighting results can be
seen in Table 2.
Table 2: Indicator Weight in BSC Scope.
No KPI code Definition Score
1 F Financial 0,162
2 C Customer 0,487
3 IP Internal Process 0,223
4 LG Learning & Growth 0,127
3.3.2 Weight Indicators on the Financial
Perspective
The result of weighting in this financial perspective
is obtained from pairwise comparisons between
KPIs in a financial perspective using expert choice
software. Weighting results in can be seen in Table
3.
Table 3: Indicator Score in Financial Perspective.
No KPI code Definition Score
1 G 5 Environment Cost 0,1
3.3.3 Indicator Weight on the Customer
Perspective
The result of weighting on the customer's
perspective is obtained from pairwise comparisons
between KPIs in the customer's perspective using
expert choice software. Weighting results can be
seen in Table 4.
Table 4: Indicator Score in Customer Perspective.
No KPI
code
Definition Score
1 G 9 The level of customer
interest to the product of
friendly environment
0,1
3.3.4 Indicator Weight on the Internal
Process Business Perspective
The result of weighting in the internal business
process perspective is obtained from a pairwise
comparison between KPIs in the internal process
business perspective using expert choice software.
The results of this weighting can be seen in Table 5.
Table 5: Indicator Score in Internal Process Business
Perspective.
No KPI
code
Definition Score
1 G1 Energy saving operation 0,078
2 G2 Waste disposition 0,088
3 G3 The use of materials that can
be recycled
0,099
4 G6 Water and air emission 0,106
5 G7 The use of substances that
are not dangerous
0,094
3.3.5 Indicator Weight in the Learning and
Growth Perspective
The result of weighting in the learning and growth
perspective is obtained from pairwise comparisons
between KPIs in the learning and growth perspective
using expert choice software. The results of this
weighting can be seen in Table 6.
Table 6: Indikator Weight in Learning and Growth
Perspectives.
No KPI
code
Definition Score
1 G 4 Cooperate with certified
su
pp
liers
0,082
2 G 8 Frequency reduction for
environment accident
0,262
3 G10 Recycle efficiency 0,154
IMC-SciMath 2019 - The International MIPAnet Conference on Science and Mathematics (IMC-SciMath)
82
3.3.6 KPI Priorities based on Overall
Weighting Results
The weighting of the KPI as a whole is done by
multiplying the weight of each KPI with the weight
of the perspective where the KPIs are grouped. The
overall KPI weighting results can be seen in Table 7,
while the perspective of each KPI is determined
which can be seen in Table 8. Based on the overall
weight of each KPI, the KPI priority determination
is then carried out starting from the KPI that has the
highest weight to the KPI that has the lowest weight.
KPI priorities can be seen in Table 9.
Table 7: Score on overall KPI.
No KPI
code
KPI
score
Perspective Overall
Score
1 G 1 0,078 Internal Process &
Business
0,017
2 G 2 0,088 Internal Process &
Business
0,020
3 G 3 0,099 Internal Process &
Business
0,022
4 G 4 0,082 Learning & Growth 0,010
5 G 5 0,333 Financial 0,054
6 G 6 0,106 Internal Process &
Business
0,024
7 G 7 0,094 Internal Process &
Business
0,021
8 G 8 0,262 Learning & Growth 0,033
9 G 9 0,257 Customer 0,125
10 G 10 0,154 Learning & Growth 0,020
Table 8: Perspective of each KPI.
No KPI code KPI score Perspective Score of KPI perspective Overall Score
1 G 1 0,078 Internal Process & Business
0,104
0,017
2 G 2 0,088 Internal Process & Business 0,020
3 G 3 0,099 Internal Process & Business 0,022
4 G 6 0,106 Internal Process & Business 0,024
5 G 7 0,094 Internal Process & Business 0,021
6 G 4 0,082 Learning & Growth 0,063 0,010
7 G 8 0,262 Learning & Growth 0,033
8 G 10 0,154 Learning & Growth 0,020
9 G 9 0,257 Customer 0,125 0,125
10 G 5 0,333 Financial 0,054 0,054
Table 9: KPI Priorities.
No KPI code Definition Score
1 G9 The level of customer interest in friendly environment products 0,125
2 G5 Environment cost 0,054
3 G8 Frequency reduction for environment accident 0,033
4 G6 Water and air emission 0,024
5 G3 The use of material that can be recycled 0,022
6 G7 The use of substances that are not dangerous 0,021
7 G2 Waste disposition 0,020
8 G10 Recycle efficiency 0,020
9 G1 Energy Saving Operation 0,017
10 G4 Cooperate with certified suppliers 0,010
Designing Performance Measurement Model for Green Supply Chain Pulp
83

Table 10: Structure of the supply chain performance measurement model.
No
KPI
Code
Definition
Financial Customer
Internal
PB
Learning
&Growth
Weight
L G L G L G L G
1 G9
The level of customer interest in
friendly environment products
X
0,125
2 G5 Environment cost X
0,054
3 G8
Frequency reduction for environment
accident
X 0,033
4 G6 Water and air emission X
0,024
5 G3 The use of material that can be recycled X
0,022
6 G7
The use of substances that are not
dangerous
X
0,021
7 G2 Waste disposition X
0,020
8 G10 Recycle efficiency
X 0,020
9 G1 Energy Saving Operation X
0,017
10 G4 Cooperate with certified suppliers
X 0,010
Based on the structure of the model, it can be
seen the priority order of all KPIs starting from the
highest to the lowest based on the weight in BSC
perspective. KPI with the highest priority means that
this KPI is a critical KPI, namely KPI which has a
major contribution to the overall supply chain
performance. Based on this, the company can
determine the right policies to achieve the
effectiveness and efficiency of its supply chain.
3.4 Structure of the Supply Chain
Performance Measurement Model
Green supply chain performance measurement
model with a BSC perspective is designed in the
form of metrics. These performance measurement
metrics can be seen in Table 10. Customer
perspective is a priority based on this research. This
is evident from the three KPIs in the highest order of
weight in the supply chain performance appraisal
metric designed, namely quality improvement, level
of customer satisfaction and level of customer
interest in friendly environmental products.
In this case, it can be seen that important aspects
which are prioritized by PT. TPL is the fulfillment
of customer needs in accordance with the company's
mission. When viewed in terms of green, the
company also prioritizes cement as an friendly
environmental product that is in demand by
customers. This is also in accordance with the vision
of the company "to be a reliable, superior and
friendly environmental pulp industry".
3.5 Validation
Validation is a step that needs to be done to explain
that the supply chain performance measurement
model designed is feasible to be applied to a real
system. The aspects considered in the model
validation process are as follows:
1. KPI in accordance with the real conditions of PT.
TPL and representative.
2. KPI contained in the model can be measured its
performance in pulp supply chain activities.
3. The priority order of the KPI contained in the
model is a KPI that truly becomes a critical indicator
for the supply chain performance of PT. TPL.
4. The supply chain performance measurement
model designed can be implemented in PT. TPL to
measure the effectiveness and efficiency of pulp
supply chains.
The validation results show that the supply chain
performance measurement model designed is valid
and can be accepted by PT. TPL. This model can be
implemented to measure the performance of a
company's supply chain. Performance measurement
is carried out to see the effectiveness and efficiency
of the supply chain. The priority aspect is the
consumer aspect to increase value in order to
achieve pulp consumer satisfaction. This is
consistent with the results of determining priorities
carried out on all KPIs. The third highest priority
weighting value of all KPIs shows that improving
the quality and level of customer satisfaction with
environmentally friendly products must be a priority
on the company's target. It is also recognized by the
company that creating quality pulp with minimal
IMC-SciMath 2019 - The International MIPAnet Conference on Science and Mathematics (IMC-SciMath)
84

environmental impact is an important demand from
current pulp consumers.
3.6 Model Implication
The implementation of the supply chain
performance measurement model can be carried out
through the following stages:
1. Collecting data related to KPIs according to
the designed supply chain performance measurement
model.
2. Making Standard Operating Procedure to
measure the performance of the cement supply chain
and make the forms needed in measuring and
documenting the results of performance
measurements.
3. Measuring the performance of the cement
supply chain at PT. TPL and document the results of
these performance measurements.
4. Determining the right policies on the supply
chain performance of PT. TPL is based on the
results of performance measurements that have been
made for each KPI.
4 CONCLUSIONS
This research has produced a set of KPIs obtained
from the integration of the green concept in the pulp
supply chain at PT. TPL. The results of integration
are as follows:
1. KPI Formulation of 10 green supply chain of
KPIs. This KPI is an important indicator that can
answer the needs of all stakeholders involved in the
pulp supply chain at PT. TPL in terms of cost
reduction and environmental impact.
2. KPI grouping in four BSC perspectives, namely
financial perspective, perspective, internal business
process and learning and growth perspective. The
total of 10 KPI can be grouped, namely 1 KPI for
financial perspective, 1 KPI for customer
perspective, 5 KPI for internal business process
perspective and 3 KPI for learning and growth
perspective.
3. Determination of overall KPI priorities is done by
sorting KPIs starting from those with the highest
weight to the lowest weight. KPI which has the
highest priority means that this KPI is a KPI that has
a major influence on the performance of the
company's supply chain. In this study, the customer
perspective is the priority as evidenced from the 1
KPI in the highest order of weight in the valuation
model.
REFERENCES
Chopra, S., & Peter, M. (2007). Supply Chain
Management, Strategy Planning & Operation (3rd
ed.). Pearson Prentice Hall.
Duarte, S., Cabrita, R., & Machado, V. C. (2011).
Exploring Lean and Green Supply Chain Performance
Using Balanced Scorecard Perspective. Proceedings of
the 2011 International Conference on Industrial
Engineering and Operations Management, 520–525.
Kaplan, R. S., & Norton, D. P. (1996). Translating
Strategy Into Action: The Balance Scorecard. Harvard
Business School Pres.
Mudgal, R. K., Shankar, R., Talib, P., & Raj, T. (2009).
Greening the supply chain practices: an Indian
perspective of enablers`relationship. International
Journal Advanced Operations Management, 1(2/3),
151–176.
Pujawan, I. N. (2005). Supply Chain Management.
Gundawidya.
Shang, K. C., Lu, C. S., & Li, S. (2010). A taxonomy of
green supply chain management capability among
electronics-related manufacturing firms in Taiwan.
Journal of Environmental Management, 91(5), 1218–
1226.
Zhu, Q., & Sarkis, J. (2006). An Inter-Sectoral
Comparison of Green Supply Chain Management in
China: Drivers and Practices. Journal of Cleaner
Production, 14, 472–486.
Designing Performance Measurement Model for Green Supply Chain Pulp
85
