
Isolation and Characterization of Lactic Acid Bacteria from Goat
Milk Kefir and Coconut Milk Kefir
Reno Permatasari Pasaribu, Emma Zaidar and Rumondang Bulan
Department of Chemistry, Faculty of Mathematics and Natural Sciences, Universitas Sumatera Utara, Medan, Indonesia
Keywords: Kefir, Goat Milk, Coconut Milk, Antimicrobial Activity.
Abstract: Research about isolation and identification of LAB from goat milk kefir and coconut milk kefir has been
completed. The making of goat milk kefir was used 3% kefir granule (HK) and 5% kefir granule (KK) from
total volume of goat milk. As well as coconut milk kefir was used 3% kefir granule (HS) and 5% kefir
granule (KS) from total volume of coconut milk. The kefir beverage, conducted quality analysis with result
pH 4.2% – 4.6%, water content 89.5% (HK), 89.1% (KK), 79.2% (HS) and 78.9% (KS). Protein content
3.3% (HK), 3.1% (KK), 1.7% (HS) and 1.6% (KS), fat content 3.58% (HK), 15.2% (HS), 3.61% (KK), dan
15.8% (KS), ash content 0.79% (HK), 0.54% (HS), 0.81% (KK) and 0.9% (KS). Antibacterial test was
conducted by observing the clear zone for 48 hours. Using Escherichia coli and Staphylococcus aureus as
the test bacteria, resulted that sample HK showed the highest level of resistance compare to other samples.
Total plate count of LAB showed that sample KK has the highest number of LAB counts for 1.7 x 10
8
.
Morphology characterization of those colony are round shape, convex elevation, off-white and also gram
positive bacteria with six isolate rod shape cell, and two isolate coccus shape cell. The catalase and oxidase
test showed that all isolate are negative catalase and negative oxidase.
1 INTRODUCTION
Kefir is a symbiotic cultures from many
microorganism such as lactic acid bacteria and yeast
that taken shape of grains (Bensmira & Jiang, 2012).
“Milk” kefir have white/ yellowish in color
(Magalhães et al., 2011). In other hand “water” kefir
have color more brownish (Laureys & De, 2014)
.Both type of kefir has anti-inflammatory, anti-fungi,
immunomodulatory dan hipocholesterolemic
character (Hsieh et al., 2012).
Kefir grain that we used in this research is
obtained from kefir grain seller in Tanggerang,
Indonesia. Using this kefir grain, we can make milk
kefir and water kefir beverage. “milk” kefir is a kefir
beverage that’s made from mixture of kefir grains
and milk. While “water” kefir is a beverage that’s
made from mixture of kefir grain and other liquid
except milk, such as water, coconut milk, coconut
water, fruit juice, etc (Anonim, 2013).
The goat milk produced has superior nutritional
content, besides that the fat and protein in goat milk
is more easily digested and its vitamin B1 content is
higher than cow's milk. (Mustofa, 2009). Another
advantage of goat milk compared to cow's milk is
not causing allergic reaction compare to cow’s milk.
Therefore, goat milk can be chosen as an alternative
drink for people who are allergic to cow's milk.
While coconut milk is a food that has a high
content of water, protein and fat as well as cow's
milk. The advantage of coconut milk from cow's
milk is that it does not contain lactose as in cow's
milk so that coconut milk can be consumed by
sufferers of lactose intolerant. Protein in cow's milk
has the potential to cause a higher allergy than
protein in coconut milk. (Gea & Sebayang, 2016).
Lactic acid bacteria and their derivatives are able
to prevent the emergence of various diseases such as
preventing enteric pathogenic bacteria, reducing
cholesterol levels in the blood, preventing colon
cancer, anti-mutagen, anti-carcinogenic and
increasing endurance (Suryono, 2003).
Permatasari Pasaribu, R., Zaidar, E. and Bulan, R.
Isolation and Characterization of Lactic Acid Bacteria from Goat Milk Kefir and Coconut Milk Kefir.
DOI: 10.5220/0010133300002775
In Proceedings of the 1st International MIPAnet Conference on Science and Mathematics (IMC-SciMath 2019), pages 59-64
ISBN: 978-989-758-556-2
Copyright
c
2022 by SCITEPRESS – Science and Technology Publications, Lda. All rights reserved
59

2 MATERIAL AND METHOD
2.1 Making Goat’s Milk Kefir
Fresh milk is pasteurized, which is heated at 60-65 °
C for 30 minutes, then cooled to room temperature
(± 28 ° C), pasteurized milk is put in 3% and 5%
grains of kefir and stirred evenly. Furthermore,
allowed / incubated for 20-24 hours (overnight) at
room temperature (25-37
o
C) so that the fermentation
process takes place. When the milk has coagulated,
strained the milk using a plastic strainer to get the
kefir grains back (Usmiati, 2007).
2.2 Making Coconut’s Milk Kefir
Grated old coconut to separate the coconut meat
from the coconut shell. Then add hot water (90-
95
o
C) to the shredded coconut meat with ratio of
water to coconut meat is 1.5: 1. The mixture of
coconut meat and hot water is allowed to stand for
one minute, then the mixture is blended for 5
minutes. After that, pour the mixture into a
cheesecloth and filter coconut meat from coconut
milk. Coconut milk that has been obtained is
pasteurized by heating coconut milk at 85-90
o
C for
15 seconds. After pasteurization, cool the coconut
milk to room temperature of 28
o
C, then add kefir
grains as much as 3% and 5% and stir evenly.
Furthermore, allowed / incubated for 20-24 hours
(overnight) at room temperature (25-37
o
C) so that
the fermentation process takes place. When the
mixture has coagulated, strained the coconut milk
using a plastic strainer to get the kefir grains back
(Anonim, 2013).
2.3 Quality Analysis of Probiotic
Beverages (Kefir)
Analyses of pH, water content, protein content, fat
content and ash content of each sample were
performed according to the standard method by SNI
01-2891-1992.
2.4 Antibacterial Activity Test of Goat
Milk Kefir and Voconut Milk Kefir
Mueller Hinton Agar was poured as much as 15 ml
into a petri dish, after it was left to solidify, streak
Escherichia Coli and Staphylococcus aureus
inoculums into different petri dishes. Inoculum
scraping is done continuously. Dip sterile paper
discs into each sample and inserted into a petri dish.
Incubated in an incubator at ± 35
o
C for 18-24 hours.
Furthermore, measured the diameter of the clear
zone around the paper disk with calipers.
2.5 Isolation of Lactic Acid Bacteria
from Goat Milk Kefir and Coconut
Milk Kefir
Total plate count of lactic acid bacteria
A total of 1 gram of kefir sample was diluted in 9
mL MRS Broth, vortexed until homogeneous. A
total of 0.1 mL of the dilution results was put into an
eppendorf tube containing 0.9 mL of MRS Broth
media. Make the dilution up to 10-6 dilution. At the
last dilution, 0.1 mL was taken and then sprayed
onto the MRS agar medium and flattened with a
hockey stick. Then put in anaerobic jar and
incubated for 48 hours at 37
o
C. Calculate the total
growing colonies using the CFU / g formula
(Purwati et al., 2005).
Isolation of lactic acid bacteria
Using a sterile spoon and curd aluminum foil
weighed as much as 1 g sample, then dissolved with
9 ml of MRS Broth solution in a test tube, then
vortex until homogeneous. This result is called
dilution 1, put into an anaerobic jar, then incubated
for 24 hours in an incubator at 37ºC. After 24 hours,
take 1 ml and put into a test tube containing 9 ml of
MRS Broth solution, then vortex until
homogeneous. Do this serial dilution until 7 times.
From the last dilution 100 µl sample is taken and
planted with the spread method on petridish which
contains MRS Agar media, then flattened with a
hockey stick that was previously sterilized with
alcohol and burned with Bunsen and then aerated.
The inoculum was stored in an anaerobic jar then
incubated in an incubator for 48 hours at 37
o
C.
In order to purify the colony, using the streak
method, by using an ose needle take one colony and
then streak on to the new MRS Agar media
simultanously, and then incubated for 24 hours at
37ºC. (Purwati et al., 2005).
2.6 Identification of Lactic Acid
Bacteria from Goat Milk Kefir and
Coconut Milk Kefir
Macroscopic Identification
This identification activity was carried out on BAL
isolates which observe the shape, color, and edges,
lactic acid bacterial cells (Purwati et al., 2005).
IMC-SciMath 2019 - The International MIPAnet Conference on Science and Mathematics (IMC-SciMath)
60

Gram staining
Colonies that characterize LAB are stained with
gram as follows: 1) Bacteria and bacteria are taken
flattened on a glass object (preparation) that has
been cleaned with aquadest, 2) then dried on a
bunsen or dryer, 3) dripped with dye violet crystals,
4) then wait for 1 minute for the dye to seep in by
bacteria, 5) then rinse with running water and drop
with a complex iodine solution, then wait for 1
minute, then rinse with running water, 6) wash with
alcohol by means of dipping into dilute alcohol, 7)
drops with safranin dye, then waited 30 seconds, 8)
after it is dried and examined under a microscope
(Dwidjoseputro, 1989).
Catalase test
The procedure performed in this catalase test is first
to apply a small amount of bacterial isolate on a
glass object. Then add a few drops of H
2
O
2
, if
necessary stir using a toothpick. After that positive
catalase was observed by the presence of many air
bubbles and negative catalase was shown by the
absence of air bubbles.
Oxidase test
The procedure used in this oxidase test is to use a
sterile swab, a little isolate is taken from the agar
medium. Then one drop of reagent was added to the
isolates in the swab, after which it was observed that
a positive reaction was marked by changing the
bacterial isolate to a purple color.
3 RESULT AND DISCUSSION
3.1 Quality Analyses for Goat Milk
Kefir and Coconut Milk Kefir
From the producing goat milk kefir and coconut
milk kefir, the quality analyses can be seen on the
Table 1 and Table 2.
Table 1: Quality analyses for kefir goat milk.
Test Bacteria Sample Antimicrobial Index
24 hrs 48 hrs
E. coli HS 0.1 0.11
HK 0.37 0.37
KK 0.18 0.18
KS 0.06 0.06
S. aureus HS 0.35 0.35
HK 0.51 0.6
KK 0.6 0.63
KS 0.25 0.28
Table 2: Quality analyses of coconut milk kefir.
Sample pH Water
Content
Protein
Content
Fat
content
Ash
content
HS
(3%
kefir
grain)
4.6 79.2 1.7 15.2 0.54
KS
(5%
kefir
g
rain
)
4.3 78.9 1.6 15.8 0.59
From this table we able to see the pH of 3% kefir
grain is different with 5% kefir grains. The 3% kefir
grain is a little bit higher pH than the 5%, we believe
the differences between this pH is because the
fermentation process that takes place. The more
lactic acid that produce by lactic acid bacteria, the
acid it become, thus the 5% kefir grain have lower
pH.
The water and ash content of all samples shows
that the water and ash level does not cross the
existing standard of SNI 7552:2009. The protein
content shows that the more kefir grains we add it
tends to have lower protein content. (Handoyo &
Morita, 2006) stated that protein will be degrade or
hydrolyzed during the fermentation process.
The fat content of coconut milk kefir is
significantly higher than the goat milk kefir. The fat
content of coconut milk vary between 0.9 – 34.7 %
depends on the variety of the coconut and level of
ripeness. The more ripe the coconut, the more higher
the fat content (Gea & Sebayang, 2016). Therefore
after the fermentation process with kefir grains, the
fat content of coconut milk kefir will still be higher
than the goat milk kefir.
3.2 Antibacterial Activity Test of Goat
Milk Kefir and Coconut Milk Kefir
The results of bacterial growth inhibition test
indicator with disc diffusion method showed the four
samples demonstrate the ability to inhibit bacterial
growth indicator, characterized by the formation of a
clear zone around the paper discs with different
sizes.
Table 3: Antimicrobial index.
Sample pH Water
Content
Protein
Content
Fat
content
Ash
content
HK (3%
kefir
g
rain
)
4.5 79.2 3.3 3.58 0.79
KK (5%
kefir grain)
4.2 78.9 3.1 3.61 0.81
Isolation and Characterization of Lactic Acid Bacteria from Goat Milk Kefir and Coconut Milk Kefir
61
In this study two species of pathogenic bacteria
is Staphylococcus aureus and Escherichia coli
(collections of Microbiology Laboratory of the
University of North Sumatra) was used. Based on
this data we able to see that the clear zone on Gram
positive bacteria is more higher than Gram negative
bacteria.
This is because the difference between the
peptidoglycan walls between this bacteria. Gram
positive bacteria only have one peptidoglycan walls,
whereas Gram negative bacteria have outside cover
membrane that protect cytoplasm and peptidoglycan.
3.3 Total Plate Count of Lactic Acid
Bacteria
In this study, TPC of LAB colonies were calculated
in coconut milk kefir and goat milk kefir. It aims to
calculate the number of lactic acid bacteria colonies
that exist at each concentration. After lactic acid
bacteria were grown on MRS agar, the total colony
count was calculated using the CFU / mL formula.
Table 4: Total plate count of lactic acid bacteria.
Sample TPC
HS 5.2 x 10
7
HK 9.3 x 10
7
KK 1.7 x 10
8
KS 1.2 x10
8
3.4 Isolation of Lactic Acid Bacteria
from Goat Milk Kefir and Coconut
Milk Kefir
Isolation of lactic acid bacteria from the sample
begins by growing LAB on the selective medium,
namely de Mann Rogosa Sharpe (MRS) broth. MRS
broth is called a selective medium because it
contains optimum nutrients and pH for LAB growth.
LAB enrichment with MRS broth was continued
with multilevel dilution aimed at reducing the
number of LAB in the medium making it easier to
isolate bacteria. Serial dilution carried out until 10
-7
also using MRS broth medium. The results of the
dilution were planted into the MRS agar medium
and incubated for 48 hours. After incubation, LAB
colonies will appear on the MRS medium, the white
or yellowish white.
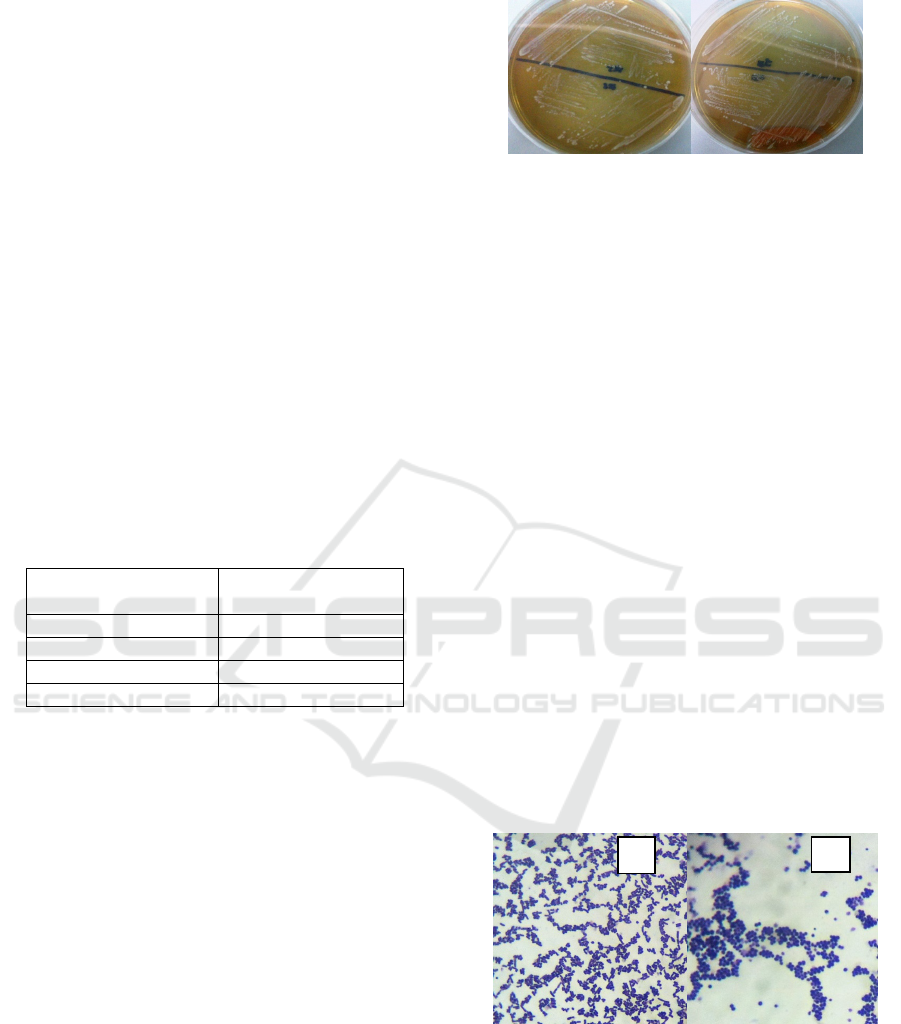
The LAB isolation results are then purified into
new media so that pure isolates are obtained.
Figure 1: The results of isolation of lactic acid bacteria.
3.5 Morphologycal Identification of
Lactic Acid Bacteria
Based on the identification of the shape of the LAB
colony, the appearance of the LAB colony on MRS
agar is circular, milky white that does not change the
color of the MRS agar (brownish yellow), with
smooth edges and convex elevation (Figure 1).
LAB colonies on MRS agar found in this study
are in accordance with research conducted by
(Komang, 2005) stating that morphological
characterization of LAB isolates based on color
indicates that the colonies are milky white with a
round shape.
Gram stain test
Gram stain testing on a single colony (LAB). Figure
2 shows the results of Gram staining of LAB
bacteria isolated from goat milk kefir and coconut
milk kefir with concentrations of 3 and 5%. From
these four samples, 8 isolates were taken. Of the
eight isolates available, there were six isolates in the
form of bacilli, and two isolates in the form of cocci,
and the eight isolates were gram-positive bacteria
that were purple.
Figure 2: Gram staining (gram positive) from LAB (a)
rod-shaped, and (b) coccus-shaped.
It can be seen the results of Gram stain tests and
morphological observations under microscope with
a magnification of 100x of 8 LAB isolates.
a
b
IMC-SciMath 2019 - The International MIPAnet Conference on Science and Mathematics (IMC-SciMath)
62
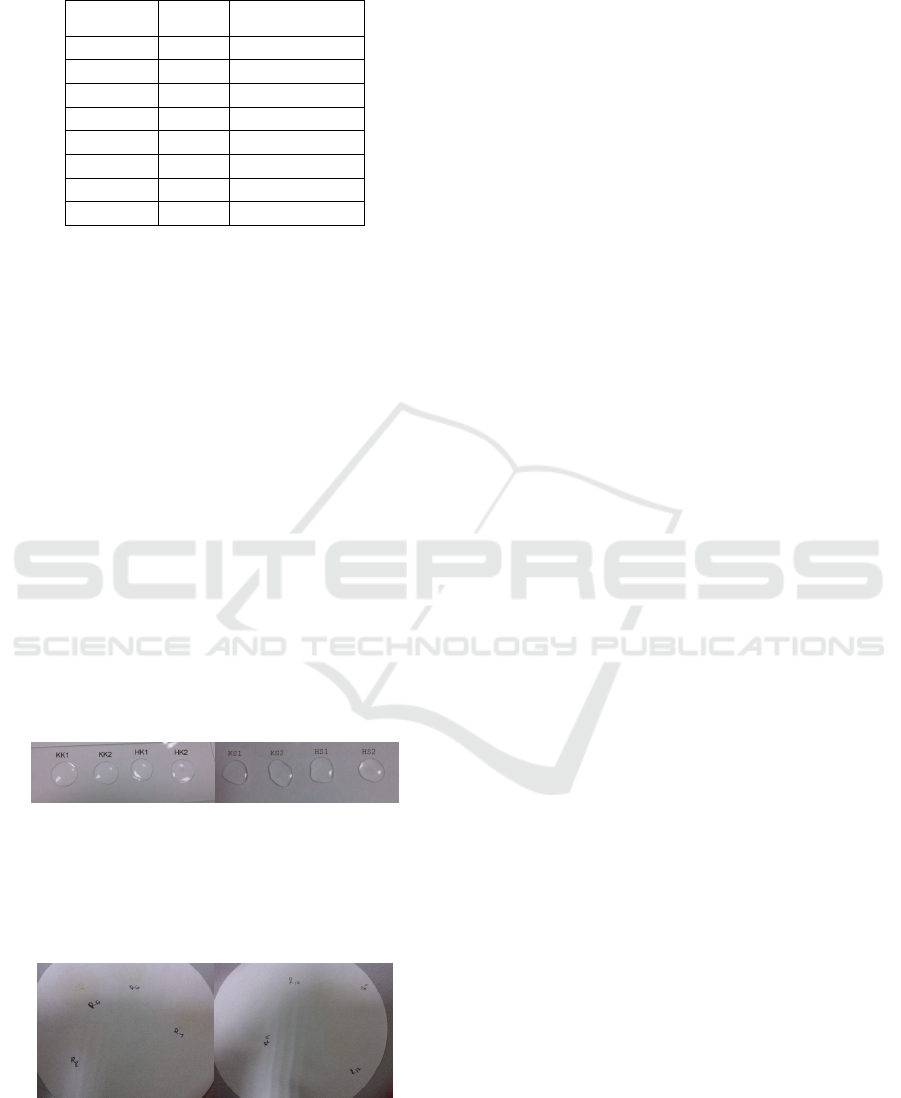
Table 5: Gram stain and morphological test results of LAB
isolates.
Isolates Gram Morphology
HK1 + Basil
HK2 + Kokus
KK1 + Basil
KK2 + Basil
HS1 + Basil
HS2 + Basil
KS1 + Kokus
KS2 + Basil
Based on the identification of the shape of the
LAB colony, the appearance of the LAB colony on
MRS agar is circular, milky white that does not
change the color of the MRS agar (brownish
yellow), with smooth edges and convex elevation
(Figure 1).
Catalase test
Catalase test was conducted to determine the
presence of the enzyme catalase in bacterial isolates
which were tested using hydrogen peroxide reagents
(H
2
O
2
). Bacteria that have the catalase enzyme are
able to break down H
2
O
2
into H
2
O and O
2
. Based on
the test results (Figure 3) below shows that the eight
isolates showed negative results on the catalase test.
This is the evidenced by the absence of air
bubbles formed when the isolate was added to
hydrogen peroxide. This is in accordances with
Djide & Sartini (2008) whose suggested that the
results of biochemical tests in the form of catalase
tests on lactic acid bacteria showed negative results.
Figure 3: Catalase test on LAB isolates.
Oxidase test
In the oxidase test, all 8 isolates shows no sign of
color change. Therefore all 8 isolates are negative
oxidase. The result can be seen on figure 4.
Figure 4: Oxidase test on LAB isolates.
Based on this result, LAB cultures were not able to
carry out the oxidation Gaby Hadley reagent, to
yield the purple compound. This might be due to the
fact that the isolates didn’t possess the cytochrome c
(which means isolates might be anaerobic organism)
that enables them to use free oxygen in their energy
metabolism (Thakur et al., 2017).
4 CONCLUSIONS
The quality analyses of kefir goat milk and kefir
coconut milk shows that the quality meets the
standard requirements of SNI 7552: 2009.
Variations in the concentration of grains of kefir
against goat milk kefir and coconut milk kefir affect
the total lactic acid bacteria present antimicrobial
values. Where the highest type of kefir has a total
lactic acid bacteria is goat milk kefir with 5% kefir
grain concentration that is equal to 1.7 x 10
8
. Goat
milk kefir and coconut milk kefir can be used as
antibacterial because it can be seen in kefir with
variations in the concentration of kefir grains
affecting antimicrobial values.
REFERENCES
Anonim. (2013). A Where Health Food Starts Guide.
Bensmira, M., & Jiang, B. (2012). Rheological
Characteristics and Nutritional Aspects of Novel
Peanut Based Kefir Beverages and Whole Milk Kefir.
Int Food Res J.
Djide, M. N., & Sartini. (2008). Isolasi Bakteri Asam
Laktat dari Air Susu Ibu, dan Potensinya dalam
Menurunkan Kadar Kolesterol secara In Vitro. Jurnal
Farmasi Dan Farmakologi, 12(3).
Dwidjoseputro, D. (1989). Dasar-Dasar Mikrobiologi.
Gea, S., & Sebayang, K. (2016). Peningkatan Kualitas
Produksi Santan Kelapa sebagai Bahan Baku Industri
Kuliner di Kota Medan. Abdimas Talenta.
Handoyo, T., & Morita, M. (2006). Structural And
Functional Properties Of Fermented Soybean
(Tempeh) By Using Rhizopus Oligosporus.
International Journal of Food Properties, 9, 347–355.
Hsieh, H. H., Wang, S. Y., Chen, T. L., Huang, Y. L., &
Chen, M. J. (2012). Effects of Cow’s and Goat’s Milk
as Fermentation Media on the Microbial Ecology of
Sugary Kefir Grains. Int J Food, 157(1), 73–81.
Komang, G. W. (2005). Isolasi dan Identifikasi BAL
Penghasil Antimikroba. Jurnal Veteriner.
Laureys, D., & De, V. L. (2014). Microbial Species
Diversity, Community Dynamics, and Metabolite
Kinetics of Water Kefir Fermentation. Appl Environ.
Microbiol.
Magalhães, K. T., Dragone, G., Pereira, G. V. M.,
Oliveira, J. M., Domingues, L., & Teixeira, J. A.
(2011). Comparative study of the biochemical changes
Isolation and Characterization of Lactic Acid Bacteria from Goat Milk Kefir and Coconut Milk Kefir
63

and volatile compound formations during the
production of novel whey-based kefir beverages and
traditional milk kefir. Food Chem, 126(1), 249–253.
Mustofa, E. H. (2009). Peningkatan Kualitas Yoghurt dari
Susu Kambing dengan Penambahan Bubuk Susu Skim
dan Pengaturan Susu Pengeraman. J. Penelit. Med.
Eksakta, 8(3), 185–192.
Purwati, E., Syukur, S., & Hidayat, Z. (Lembaga I. P. I.
(2005). Lactobacillus sp. Isolasi dari
Biovicophitomega Sebagai Probiotik.
Suryono. (2003). Produk Olahan Susu Fermentasi
Tradisional Yang Berpotensi Sebagai Pangan
Probiotik. Institut Pertanian Bogor.
Thakur, M., Deshpande, H. W., & Bhate, M. A. (2017).
Isolation and Identification of Lactic Acid Bacteria
and Their Exploration in Non-Dairy Probiotic Drink.
International Journal Of Current Microbiology and
Applied Science, 6(4), 1023 – 1030.
Usmiati, S. (2007). Kefir, Susu Fermentasi dengan Rasa
Menyegarka. Warta Penelitian Dan Pengembangan
Pascapanen Pertanian, 29(2).
IMC-SciMath 2019 - The International MIPAnet Conference on Science and Mathematics (IMC-SciMath)
64
