
Two-dimensional Numerical Study of Scour beneath Subsea Pipeline
under Regular Wave Condition
Titis Julaikha Atikasari
1
, Suntoyo
1
, Wahyudi
1
, Umboro Lasminto
2
and Agro Wisudawan
3
1
Ocean Engineering Department, Sepuluh Nopember Institute of Technology, Surabaya, Indonesia
2
Civil Engineering Department, Sepuluh Nopember Institute of Technology, Surabaya, Indonesia
3
Civil and Environmental Engineering Department, University College Cork, Cork T12K8AF, Ireland
Keywords: Marine Pipeline, Seabed Deformation, Numerical Analysis.
Abstract: The interaction of pipe and soil under hydrodynamic flow becomes one of the concern in coastal engineering.
Scoured seabed beneath sub-marine pipeline could develop the pipe instability and affect to its safety. The
pressure difference between upstream and downstream of pipe will induce a seepage flow in the seabed
underneath the pipe. When the velocity increased then the critical point reached, a mixture of sand and water
divert to the gap below the pipe and leading to a large velocities in the gap. It generates a larger shear stress
on the bed and increase the amount of sediment transport. Due to the complexity of the scour problem, there
are many factors affecting the scour depth. Some of them are the pipe position and the wave angle of attack.
This study evaluates the bed morphological evolution around pipeline, performed with variation of pipe
positions and wave angles of attack.
1 INTRODUCTION
This research aims to investigate the bed evolution
during scour process until it reaches a steady state
(equilibrium stage). The stage reached when the bed
shear stress along the bed below pipe becomes
constant and equal to its undisturbed value. A
computational fluid dynamics used to calculate flow
and sediment transport subjected to regular wave and
steady currents. The model performed the sediment
erosion around pipeline that laid on erodible seabed,
based on time dependent scour processes using
Volume of Fluid (VoF) method with standard k-ω
turbulence closure. Beside the bed deformation, the
scour propagation rate discussed with respect of the
pipe position.
Submarine pipelines have become a concern in
marine and geotechnical engineering. The presence of
pipeline though it lay out, buried or trenched in the
seabed, it will change the marine environment. Wave
and current action change the flow pattern when
exposing the marine pipelines installed on seabed in
coastal or subsea area. This change generally cause
the increase of bed shear stress and the turbulence
level. Both terms lead the sediment transport around
pipe. Therefore interaction between pipeline, seabed,
and flow causes the occurrence of local scouring. The
developing scour along the pipe will generate gap
between seabed and pipe, this commonly referred to
pipeline span which become a threat to the stability of
the pipeline structures.
Wave-induced scour around pipelines occurs in
three stages, they are onset scour, tunnel erosion, and
lee wake erosion. Onset scour driven by the pressure
difference between the upstream and downstream of
the pipe. When the flow velocity exceeds the critical
point, a mixture of water and sand break through
underneath the pipe. The stage followed by tunnel
erosion stage, during this stage a substantial amount
of water is diverted to the gap and leading large
velocities, this resulting a large shear stresses below
the pipe and increasing the sediment transport. In this
stage, the scour occurs extremely fast at the
beginning. As a result a dune begins to form at the
downstream side of pipe. However this dunes
gradually migrates downstream and there will be
more scour at the downstream side of the pipe than at
the upstream side. This stages is lee-wake erosion
(Sumer and Fredsoe, 2002).
Over decades researchers have studied the local
scour around pipeline and proposed different
empirical equations to describe the equilibrium
scour depth, such as Mao (1986), Sumer and
218
Atikasari, T., Suntoyo, ., Wahyudi, ., Lasminto, U. and Wisudawan, A.
Two-dimensional Numerical Study of Scour beneath Subsea Pipeline under Regular Wave Condition.
DOI: 10.5220/0010126902180224
In Proceedings of the 7th International Seminar on Ocean and Coastal Engineering, Environmental and Natural Disaster Management (ISOCEEN 2019), pages 218-224
ISBN: 978-989-758-516-6
Copyright
c
2021 by SCITEPRESS – Science and Technology Publications, Lda. All rights reserved

Fredsoe (1990), Chiew (1991), Cevik and
Yuksel (1999), Bakhtiary (2011), and Dogan
(2018). While numerical methods have beed
developed to scour around pipeline as well as Brors
(1999), Liang and Cheng (2004), Shen et al.
(2013), Fuhrman et al. (2014), Shen et al. (2015),
Zhang and Shi (2016).
Sumer and Fredsoe (1990) established scour
below pipelines exposed by waves and found that
lee-wake of the pipe is the key element in the scour
process also Keulegan-Carpenter number is the
main parameter that governs the equilibrium scour
depth. The larger the KC-number, the larger the
stream-wise extent of the area affected by the lee-
wake during half period of the flow. Hansen (1992)
investigated combined wave and current parameter
on local scour and identified that velocity ratio (m)
as the governing equation for scour in combined
wave and current. Velocity ratio developed from
composed Uc, flow velocity due to current, and Uw,
wave orbital velocity. However numerical model
predictions in developing combined wave and
current condition are limited. Hansen (1992) and
Larsen et al. (2016) presented modelling of the scour
under combined wave and current, but the study is
limited to the value of combined velocity and
assume the fluid as a rigid lid not free surfaces area.
Ahmad (2019) investigated pipeline scour under
combined wave and current, the results showed the
scour depth and horizontal extent of the scour
increase with Ucm (combined velocity of
current and wave) for a given KC number.
While the experiments of Cheng et al. (2014)
showed that the scour propagation under wave only
condition increases with KC number and Shield
parameter.
Based on the background above, the further
discussion on pipeline scour under the combined
action of wave and current still needed. Over more
the occurrence of the actual scour beneath subsea
pipeline occurs in the combined wave and current.
This paper primarily concerned with numerical
simulation of a single pipe that laid on sandy bed and
subjected to combined wave and current loadings.
The simulation was done under free surface dynamic
analysis. The study discusses the generation of
regular waves and steady current condition in the
numerical wave tank. Wave only model and
combined wave-current model validated with Airy
wave theory, then the validated model used to
validate pipeline scour.
2 NUMERICAL METHOD
In this study, three-dimensional wave hydrodynamics
and sediment transport calculated by CFD numerical
modelling.
2.1 Flow Model
The hydrodynamics module based on the continuity
and motion equation. The motion equation of the fluid
velocity components has been done in the three-
dimensional Navier-Stokes equation which for
incompressible flow. The equation of continuity
written as follow.
𝜕𝜌
𝜕𝑡
+
𝜕(𝜌𝑢)
𝜕𝑥
+
𝜕(𝜌𝑣)
𝜕𝑦
+
𝜕(𝜌𝑤)
𝜕𝑧
=0
The Navier-Stokes equations are as follows.
𝑝
𝜕𝑢
𝜕𝑡
+𝑢
𝜕𝑢
𝜕𝑥
+𝑣
𝜕𝑢
𝜕𝑦
+𝑤
𝜕𝑢
𝜕𝑧
=−
𝜕𝑝
𝜕𝑥
+𝜌𝑔
+𝜇
𝜕
𝑢
𝜕𝑥
+
𝜕
𝑢
𝜕𝑦
+
𝜕
𝑢
𝜕𝑧
𝑝
𝜕𝑣
𝜕𝑡
+𝑢
𝜕𝑣
𝜕𝑥
+𝑣
𝜕𝑣
𝜕𝑦
+𝑤
𝜕𝑣
𝜕𝑧
=−
𝜕𝑝
𝜕𝑥
+𝜌𝑔
+𝜇
𝜕
𝑣
𝜕𝑥
+
𝜕
𝑣
𝜕𝑦
+
𝜕
𝑣
𝜕𝑧
𝑝
𝜕𝑤
𝜕𝑡
+𝑢
𝜕𝑤
𝜕𝑥
+𝑣
𝜕𝑤
𝜕𝑦
+𝑤
𝜕𝑤
𝜕𝑧
=−
𝜕𝑝
𝜕𝑥
+𝜌𝑔
+𝜇
𝜕
𝑤
𝜕𝑥
+
𝜕
𝑤
𝜕𝑦
+
𝜕
𝑤
𝜕𝑧
Where u, v, and z are the velocity components, p
is the pressure, ρ is the fluid density, μ is the turbulent
eddy viscosity, and g is the gravitational acceleration.
The wall boundary conditions evaluated based on
turbulence closure. A turbulence model is required to
calculate the turbulent viscosity μ. In this study, the
turbulent viscosity calculated by the standard two-
equation κ-ω of (Wilcox, 1988).
𝜕𝑘
𝜕𝑡
=
𝜕
𝜕𝑧
(
𝑣+𝑣
𝜎
)
𝜕𝑘
𝜕𝑧
+𝑣
𝜕𝑢
𝜕𝑧
−𝛽
∗
𝜔𝑘
𝜕𝜔
𝜕𝑡
=
𝜕
𝜕𝑧
(
𝑣+𝑣
𝜎
)
𝜕𝜔
𝜕𝑧
+𝛾
𝜔
𝑘
𝜕𝑢
𝜕𝑧
−𝛽
𝜔
The standard κ-ω closure has advantages to
perform low Reynold number for near-wall
turbulence. It is numerically stable in flows with
adverse pressure gradient. So the advanced model of
the standard closure continue to be developed, i.e.
Menter (1994), Suntoyo et al. (2008), and Suntoyo
and Tanaka (2009).
Using CFD model, the free surface (fluid-fluid
interface) between water and air is calculated using
Two-dimensional Numerical Study of Scour beneath Subsea Pipeline under Regular Wave Condition
219

Eularian methods that characterized by meshes to
evolve the shape of interface, i.e., Shen et al. (2013),
Putri and Suntoyo (2020). VOF method proposed by
Hirt and Nichols (1981) is used to track the free
surface interface.
2.2 Sediment Transport Model
The physical mechanism of sediment in this paper
defined as sediment scour model. It estimates the
effect of the flow mechanism on the transport
sediment and the erosion of surfaces. It estimates the
sediment motion by approximating the sediment
erosion, advection, and deposition. The numerical
model estimates the sediment transportation by
computing the suspended sediment transport,
computing the sediment settling due to gravity, also
computing the bed-load transport and motion.
Bed-load transport determined by Shield number,
where bed shear stress (τ) is the important part which
becomes the basis of sediment movement under flow
model. Bed shear stress (τ) is determined by profiling
logarithmic velocity profile near bottom.
𝜃=
𝜏
𝜌𝑔(𝑠− 1)𝑑
The sediment transport occurs when shield
number exceeds the critical value. The Soulsby-
Whitehouse equation used to predict the critical
Shield number parameter.
𝜃
=
0.3
1 + 1.2𝐷
∗
+ 0.055
1 − exp (−0.02𝐷
∗
)
Where 𝐷
∗
is the non-dimensional grain size and
can be found by 𝐷
∗
=
()
/
. According the the
critical Shield number parameter, the bed-load
transport rate equation calculated by Van Rijn (1984)
as follow.
𝑞
(
𝑠−1
)
𝑔
.
𝐷
.
=0.053
𝑇
.
𝐷
∗
.
3 MODEL SETUP
The scheme of this numerical simulation based on the
experimental input from Suntoyo (2017). It
conducted a series of experiments to study the two
dimensional scour phenomenon due to combined
wave and current flow over cylindrical pipe that laid
on the erodible bed. This study developed the
investigation to the two dimensional scour analysis.
An open top flume with a hydraulically smooth pipe
made brought to the model with diameter 3,81cm of
pipe and placed over the sand bed which has median
grain size diameter (d
50
) 0,55 mm. The model
simulated by the regular wave flow. Wave only
simulation and combined wave and current given as
the variation to define the difference.
Figure 1: Domain and Boundary Scheme.
Figure 2: Top View Sketch of Computational Domain.
The governing equation of flow simulation
discretized by finite difference method. A mesh of
fixed rectangular cells used to subdivide the flow
region, with each cells have local average values of
all dependent variables.
Good meshing quality of computational domain
put up the better understanding convergence of the
numerical model so the better accuracy will resulted.
Figure 1 (upside) illustrates the perspective view of
the 3D mesh on the seabed and pipe. Figure 2
(downside) is the cross sectional view of the mesh of
the model. Three different mesh sizes adopted to
define flow, sediment, and pipe. Considering the flow
behaviour near bed and pipe, finer mesh blocks used
in respect where the velocity boundary layer near bed
develop and the erosion around pipe expected.
Smooth grid mesh applied near sediment around the
pipe, this made the finer convergence and accuracy
which dealing of the contacts between pipe, sediment
and flow. The computational domain contain 7,5
million cells of mesh which define the boundary
condition that aimed to get best estimation of the flow
characteristic around seabed.
The numerical models were set up with
assumption of hydrostatic pressure distribution from
the inlet to the outlet boundaries. The top boundary of
the domain is symmetry, where the air pressure
assumed does not affect the numerical wave tank. At
the side surfaces, the wall boundaries used with no-
slip velocity condition. The inlet is set to be regular
wave condition with wave height and angle variation.
The outlet set to be outflow boundary with allowing
flow to enter at outflow boundary condition.
ISOCEEN 2019 - The 7th International Seminar on Ocean and Coastal Engineering, Environmental and Natural Disaster Management
220
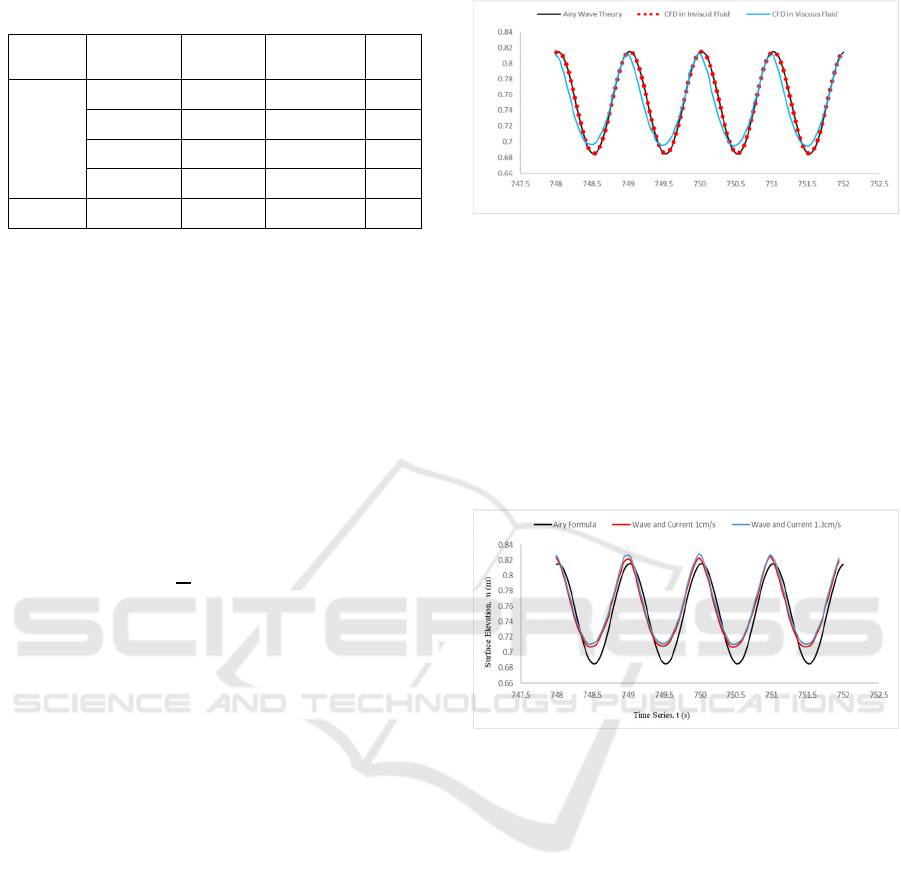
Table 1: Input Data.
Module Parameter Notation Magnitude Unit
Wave
Depth d 0.75 m
Height H 13 cm
Period T 1 s
Angle α 0; 45; 60 deg
Current Velocity v 0; 1; 1.3 cm/s
4 RESULTS AND DISCUSSIONS
4.1 Model Verification
This section discuss the validation of the proposed
numerical model to predict wave propagation and
scour induced wave to understand the accuracy f the
model. The numerical results of the surface elevation
compared with theoretical solution. The validation
consists of the linear wave propagation using linear
Airy wave consideration.
𝜂=−
𝐻
2
𝑐𝑜𝑠
(
𝑘𝑥− 𝜔𝑡
)
Where H is the water depth, k is the wave number
that derived from 2π/L, and ω is wave frequency from
2π/T. The formula shows that the water level
fluctuations are periodic in respect to x and t. It shows
a sinusoidal and progressive wave that propagate to
the positive x direction.
Based on Liu et al. (2016) to compare the
numerical result of the wave propagation with the
theoretical solution that formed from potential flow
theory, the viscosity is set to zero. To compare the
numerical results of the wave propagation with
theoretical solution, one case with inviscid fluid
simulated to examine the mesh resolution in the
computation. In simulation with inviscid fluid, to
assume that the fluid is in ideal fluid mode so the
viscosity and turbulent boundary ignored and set to
zero. In contrast to the ideal fluid, the real fluid which
has viscosity and turbulent boundary also proposed.
The viscous fluid will be used as reference fluid in
this study. Then the results of Airy wave theory,
simulation in inviscid fluid, and simulation in viscous
fluid are compared. Figure 3 shows the comparisons
of numerical result of the time series of free surface
elevation and the theoretical solution. The
comparison of free surface elevation monitored at
cross section x=75D of time series t=748s-752s.
Figure 3: Comparison between Airy Formula and CFD
Simulation in Wave only Condition.
The comparison graph of the simulation results
show the surface elevation between airy formula and
the CFD simulation results. The simulation of wave
under ideal fluid mode, where viscosity and turbulent
are set to be zero, shows the similar trend-line with
empirical Airy Formula. The comparison of viscous
fluid that simulated under viscosity and turbulent
mode also shows a good agreement. The error results
from both results comparison is 0,3%.
Figure 4: Comparison between Airy Formula and CFD
Simulation in Wave and Current Condition.
The trend of simulation study on its surface
elevation shows a slight shift to the empirical Airy
trend-line. The comparison between theory and
results of wave and current simulation shows that the
CFD simulation results under wave and current have
the upward trend shift compared to wave only
simulation and theory. The greater of the current
value that given, the more it leads to a shift in surface
elevation.
4.2 Scour around Pipe
Calculation divided in to three parts based on the
wave angle of response, 0
o
, 45
o
, and 60
o
. The three
sections are carried out on a pipe laying on the seabed
with e/D=0. Calculations performed under wave only
condition and combined wave and current of 1cm/s
and 1,3cm/s. Predicted time of equilibrium scour
depth and scour deposition is about 25 minutes, this
Two-dimensional Numerical Study of Scour beneath Subsea Pipeline under Regular Wave Condition
221
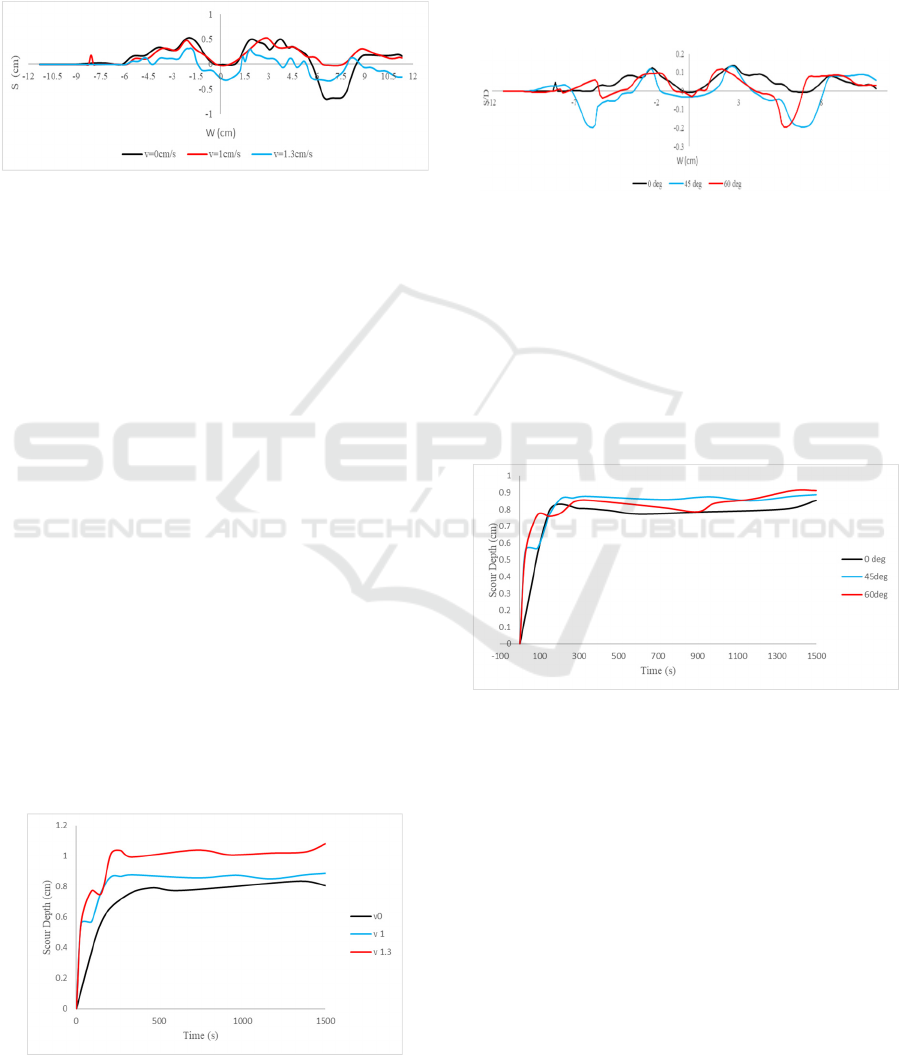
is based on the experiments of Cheng et al. (2009) and
Suntoyo et al. (2017). Maximum scour depth and
deposition after 25 minutes simulation obtained.
However, the calculation results in CFD for stages of
scour development not as expected. The equilibrium
scour depth and deposition not reached yet at the
expected given time.
Figure 5: Bed Profile after 25 Minutes on α=0
o
.
Although the results have not shown the
equilibrium condition at the expected given time
(25minutes), but the results show good agreement for
how scour around pipe formed. The CFD calculation
show the deformation movements of seabed which in
accordance with Sumer et al. (2002) research. The
simulation results in wave only condition shows the
result of less sediment erosion beneath the pipe
compared to the combination of wave and current
results. However for the wave only simulation, the
sand dune around pipeline that deposed is higher than
the combined results.
In Figure 5, it can be seen if the flow still carry out
sediment downstream the pipe, so that erosion occurs
around the downstream of the pipe. Based on Sumer
et al. (2002) wake pattern in oscillatory motion in
wave are govern by Keulegan-Carpenter (KC)
number. Larger KC number means that the water
particles travel quite large distances, and resulting in
separation and probably vortex shedding. The
statement is compatible with the calculation above. In
wave only condition, the generated erosion at the
downstream pipe is greater than the combined
conditions, despite the scour depth in the combined of
wave and current simulations show the deeper results.
Figure 6: Typical Time-Dependent Scour on α=45
o
.
Typical time-dependent scour on figure 6
represents that current velocity magnitude influence
the scour depth. It is clear if the greater current
velocity magnitude, the deeper and wider scour
produced. Different wave angle which lead to the pipe
also have an influence on the width and depth of
scour. The difference is quite significant. But it
cannot yet be concluded whether the smaller the angle
of wave attack will reduce the scour depth.
Figure 7: Bed Profile under Combined Wave and Current v
= 1 cm/s in Different Angle of Attack.
CFD simulation on different wave angle of attack
indicates that the scour depth and width trend-line of
45
o
wave angle has the widest and deepest scour
profile. However, although wave angle 60
o
does not
have the deepest and widest trend, the simulation
results show that there is a slight difference in depth
between angles 45
o
and 60
o
. Where angle 60
o
has the
deepest scour depth compared to the other results.
Figure 8: Typical Time-Dependent Scour in Different
Wave Angle.
The bed profile deformation during scour shows
if the initial stage of scour started from onset scour
then followed by tunnel erosion. Initial flow that hits
the pipe lead pressure difference between upstream
and downstream the pipe and caused piping. Later on
the gap between pipe and the bed formed as shown in
Figure 9 (t=30 s). The initial gap continuously
exposed to flow, and the gap evolves during the time.
As seen in Figure 9, the scour occurs faster at the
beginning (t=0 s until t=180 s).
Just as described in Lee-Wake erosion process, a
dune begins to form and gradually resettle to the
reverse side and deposed as the scour progressed. In
this stage scour hole formed and the distance between
ISOCEEN 2019 - The 7th International Seminar on Ocean and Coastal Engineering, Environmental and Natural Disaster Management
222

pipe and the bed seen as a gap in two-dimensional
scour approach. If the scour hole traced and observed
in three-dimensional view, it will be a free span
between pipe and the bed that can disturb the stability
of the pipe.
t=0 s t=30 s
t=60 s t=90 s
t=180 s t=1500 s
Figure 9: Bed Profile Deformation during Scour Process.
5 CONCLUSIONS
1. It should be noted that viscosity and turbulence
affect flow condition. Verifying flow between
CFD and empirical formula, should be done by set
both conditions as zero.
2. The angle of attack is one of influencing factors
of scour depth. The scour depth is reduced by
decreasing of wave angle of attack.
ACKNOWLEDGEMENTS
The authors would like to acknowledge the support
from Indonesian Research and Technology Council,
through PMDSU research grant.
REFERENCES
Bakhtiary, A.Y., et al., 2011. Euler-Euler two Phase Flow
Simulation of Tunnel Erosion beneath Marine
Pipelines. Applied Ocean Research 33, 137-146.
Brors B. 1999. Numerical Modeling of Flow and Scour at
pipelines. Journal of Hydraulic Engineering. 125 (55),
11-23.
Cevik, E.O., Yuksel, Y., 1999. Scour under Submarine
Pipelines in Waves in Shoaling Conditions. Journal of
Waterway Port. ASCE, 125, 9-19.
Cheng, L.Y., et al., 2009. Three-Dimensional Scour below
Pipelines in Steady Currents. Coastal engineering. 56
(5-6), 577-590.
Cheng, L., et al., 2014. 3D Scour below Pipelines under
Waves and Combined Waves and Currents. Coastal
Engineering 83, 137-149.
Chiew, Y.M. 1991. Prediction of Maximum Scour Depth at
Submarine Pipelines. Journal of Hydraulic Engineering
117 (4), 425-466.
Dogan, M., et al., 2018. Experimental Investigation of the
Equilibrium Scour Depth below Submerged Pipe both
in Live-Bed and Clear-Water Regimes under the Wave
Effect. Applied Ocean Research 80, 49-56.
Fuhrman, D.R., 2014. Numerical Simulation of Wave-
Induced Scour and Backfilling Processes beneath
Submarine Pipelines. Coastal Engineering. 94, 10-22.
Hansen, E.A., 1992. Scour below Pipelines and Cables: A
Simple Model. 11th Offshore Mechanics and Artic
Engineering Conference. ASME 5(A), 133-138.
Hirt, C.W. and Nichols B.D., 1981. Volume of Fluid (VOF)
Method for the Dynamics of Free Boundaries. Journal
of Computational Physics. 39(1), 201-225.
Larsen, B., et al., 2016. On the Over Production of
turbulence beneath surface wave in Reynold-averaged
Navier-Stokes model. Journal of Fluid Mechanics 853,
419-460.
Liang, D.F., Cheng. L., 2004. Numerical Modelling of
Scour below a Pipeline in Current Part: Scour
Simulation. Coastal Engineering 52 (1), 43-62.
Liang D., Cheng L., 2005. Numerical Modeling of Flow
and Scour below a Pipeline in Currents. Coastal
Engineering. 52, 25-42.
Liu, M., et al., 2016. Numerical Modeling of Local Scour
and Forces for Submarine Pipeline under Surface
Waves. Coastal Engineering. 116,275-288.
Mao Y. 1986. The Interaction between a pipeline and an
Erodible Bed. Series Paper 39. Ph.D. Thesis Tech.
University of Denmark.
Menter, F.R., 1994. Two-equation Eddy-Viscosity
Turbulence Models for Engineering Applications.
AIAA Journal. 32(8), 1598-1605.
Putri, P., Suntoyo, 2020. Tidal Effect on Sea Water Intake
of Power Plant using CFD Model. In Proceedings of the
6
th
International Seminar on Ocean and Coastal
Engineering, Environmental and Natural Disaster
Management (ISOCEEN 2018), pages 209-211,
SCITEPRESS – Science and Technology Publications.
Shen, W., et al., 2013. 2D and 3D CFD Investigations of
Seabed Shear Stress around Subsea Pipelines.
Procedings of the ASME 32nd International
Conference on Ocean, Offhore and Arctic Engineering.
OMAE 10626.
Shen, W., et al., 2015. Shear Stress Amplification around
Subsea Pipelines: Part 3, 3D Study of Spanning
Two-dimensional Numerical Study of Scour beneath Subsea Pipeline under Regular Wave Condition
223

Pipelines. 7th International Conference on Scour and
Erosion, ISCE. 325-335.
Sumer, B.M., Fredsoe, J., 1990. Scour below Pipeline in
Waves. Journal of Waterway, Coastal and Ocean
Engineering, ASCE, 116 (3), 307-323.
Sumer, B.M., Fredse, J., 2002. The mechanics of Scour in
the Marine Environment. World Scientific Publishing
co. Pte. Ltd. Singapore.
Suntoyo, Tanaka, H., Sana, A., 2008. Characteristics of
turbulent boundary layers over a rough bed under saw-
tooth waves and its application to sediment transport.
Coastal Engineering, 55 (12), 1102-1112.
Suntoyo, Tanaka H., 2009. Numerical Modeling of
Boundary Layer Flows for a Solitary Wave. Journal of
Hydro-environment Research. 3, 129-137.
Suntoyo, Rahayu, N.D.,Wisudawan, A., Ikhwani, H., 2017.
Experimental Study of Pipeline Scouring on Seabed
and In-Trench Conditions under Regular Wave Motion.
International Journal of Civil Engineering and
Technology, 8(10), 659-666.
Van Rijn, L., 1984. Sediment Transport, Part 1: Bed Load
Transport. Journal of Hydraulic Engineering. 110 (10),
1431-1456.
Wilcox, D.C., 1988. Reassessment of the Scale-
Determining Equation for Advanced Turbulent Models.
AIAA Journal. 26 (11), 1299-131.
Zhang, Z., Shi, B., 2016. Numerical Simulation of Local
Scour around Underwater Pipeline based on FLUENT
Software. Journal of Applied Fluid Mechanics 9 (2),
711-718.
ISOCEEN 2019 - The 7th International Seminar on Ocean and Coastal Engineering, Environmental and Natural Disaster Management
224
