
Thermal Front in the North of Java Sea, Indonesia
Risfiadela Ristyatmaja, Supriyatno Widagdo and Viv Djanat Prasita
Department of Oceanography, Hang Tuah Surabaya, Jalan Arif Rahman Hakim 150,
Sukolilo Surabaya, Indonesia
Keywords: Thermal Front, IOD Phase, North Java Seas, Single Image Detection, SST.
Abstract: Indian Ocean Dipole (IOD) is a phenomenon in the Indian Ocean caused by differences in the anomaly of
Sea Surface Temperature (SST) between the West Coast of Sumatra and the East Coast of Africa. The phase
difference of the formation of positive IOD (+) and negative IOD (-). The IOD phase can be known by
using the Dipole Mode Index (DMI). This research aims to identify the effect of IOD phase on SST and
distribution thermal front. Identification of distribution using the Pearson method, and analysis of the
distribution thermal front using the Single Image Detection (SIED) method. Area research in North Java
Seas during wet season 2013-2015. IOD phase with normal condition more often occure than IOD phase
with weakly condition. Strong correlation occurred with negative direction, and moderate correlation
occured with positive direction. Meanwhile, correlation IOD with rainfall not significant or uncorrelation.
During five years the heat temperature was concentrated in the coastal area. IOD with normal condition has
a larger thermal front area 1976 km², while IOD with weakly condition has a 624 km² thermal front area.
Thermal front distribusion more often occure on north area of Central Java with a longwise and widing
distribusion.
1 INTRODUCTION
Indonesia, which is in the tropics, receives the most
amount of solar radiation and is influenced by
various atmospheric phenomena, making this region
vulnerable to variability and climate change. The
climate in Indonesia will not always run normally
every year, there is a time when there is a decrease
in rainfall but at another time there is high rainfall.
In general, the cause of rainfall in Indonesia is
influenced by several phenomena including ENSO
or commonly called El Nino and Indian Ocean
Dipole (IOD). The phenomenon of IOD (Indian
Ocean Dipole) can occur where there is a difference
in sea surface temperature between the western
tropical Indian Ocean or the east African coast and
the eastern tropical Indian Ocean or the West Coast
of Sumatra (Yamagata et al, 2000 in Fadholi, 2013).
Sea surface temperature (SST) is one of the
oceanographic parameters that characterize the mass
of water in the ocean and is related to the state of the
seawater layer below, so that it can be used in
analyzing phenomena that occur at sea such as
currents, upwelling and fronts (confluence of two
water masses different). Thermal front is one of the
oceanographic phenomena that can be identified by
looking at the pattern of SST distribution (Inayah,
2015).
The potential of fish in the Java Sea is very large,
but the potential utilization of fish in the Java Sea
has already exceeded the limit or has reached 95
percent of the total available marine resources, it is
one of the factors causing overfishing. Based on the
description above, the understanding of the thermal
front that is suspected to be an area that is liked by
fish is important to be investigated. Thermal front as
a local phenomenon cannot be separated from the
influence of the adjacent regional oceanographic
phenomena, in this case the IOD phenomenon that
takes place in the Indian Ocean on the axis of East
Africa and West Sumatra which is close to the
research location, namely the Java Sea.
The research conducted focuses on the
distribution of thermal fronts on IOD using SST
parameters and rainfall in the east monsoon. SST
and sea rainfall data used were obtained from
imagery, and rainfall data was taken from
representative samples in each region. Factors such
as wind, surface currents, exposure time are ignored
in this study.
198
Ristyatmaja, R., Widagdo, S. and Prasita, V.
Thermal Front in the Nor th of Java Sea, Indonesia.
DOI: 10.5220/0010060701980206
In Proceedings of the 7th International Seminar on Ocean and Coastal Engineering, Environmental and Natural Disaster Management (ISOCEEN 2019), pages 198-206
ISBN: 978-989-758-516-6
Copyright
c
2021 by SCITEPRESS – Science and Technology Publications, Lda. All rights reserved
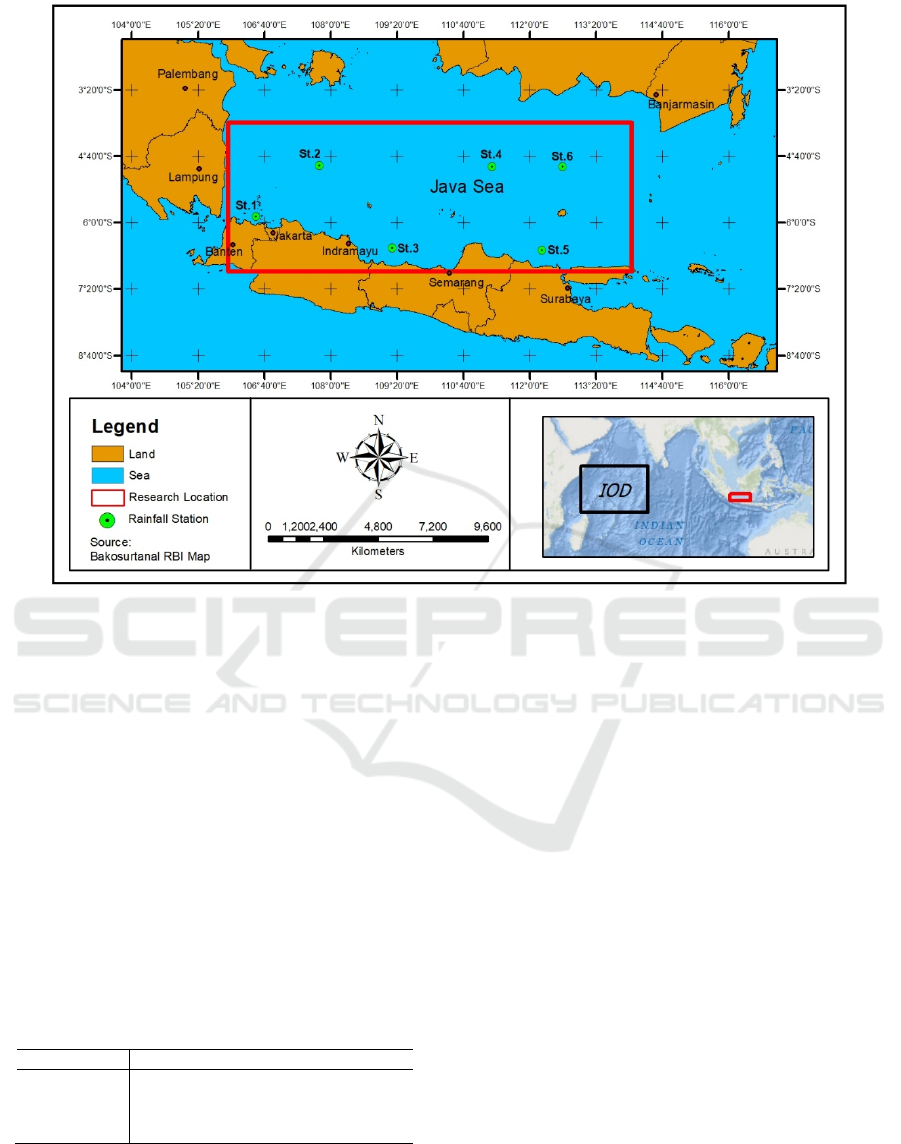
Figure 1: Research Location.
2 RESEARCH METHODS
This research was conducted in August 2018-June
2019 with the use of data for 5 years (2013-2017),
with the area in the waters of the Java Sea located
from 4° S to 7.1° S and from 106° E to 114° E. The
research location is located on the east side of the
IOD axis in East Sumatra (East Indian Ocean) with a
distance of about 4000 km from the axis of the IOD
(Figure 1).
The tools used in the processing and analysis of
data in this study are a number of computer
programs such as: ArcGIS, ODV, Microsoft Excel.
The data used in this study can be seen in Table 1.
Table 1: Types and sources of data.
Data Types Data Sources
SST https://oceancolor.gsfc.nasa.gov/
Rainfall https://apps.ecmwf.int
Dipole Mode
Index
http://jamstec.go.jp/frcgc/
research/d1/IOD/DATA/DMI
Data processing methods are as follows: (1). IOD
data that has been downloaded through the site is
processed using Microsoft Excel and is classified
seasonally and is classified based on DMI values,
namely the positive and negative phases. As for the
strength of the IOD phase consists of normal,
moderate, and strong phases (Amri et al, 2010). (2)
SST data downloaded is first processed using
SeaDas software to cut images according to the
location of the study, then processing SST
variability and thermal front are processed using
ArcGIS with the Single Image Detection method to
identify the thermal front using a 0.5° thereshold
value. (3) Rainfall data is processed using ODV to
convert the nc format to txt and seasonal grouping
and rainfall calculation are performed on Microsoft
Excel.
The analysis in this study uses Pearson
correlation analysis which is used to determine the
degree of closeness of the relationship between the
two variables. The analysis is done by calculating
the monthly average of sea surface temperature
(SST). Rainfall data and DMI values are not
calculated. Correlation test using the DMI value
aims to determine the level of relationship between
the data parameters to the formation of IOD, namely
the value of the X variable which is assumed to be
the dependent variable (IOD) and the variable Y as
the independent variable namely rainfall and SST.
Thermal Front in the North of Java Sea, Indonesia
199
3 RESULT AND DISCUSSION
3.1 Indian Ocean Dipole Dynamics
The monthly IOD conditions in 2013 occurred under
normal conditions with both IOD (+) and IOD (-)
phases, but IOD (+) phases were more common.
IOD with a weak condition occurred two years
during the 2013-2017 period, namely in 2015 and
2017. In 2013 during the east season, there was one
negative IOD phase and three positive IOD phases
with a condition where the DMI value was 0.08-
0.29. In 2014 in the east season there were two
negative IOD phases and a positive IOD under
normal conditions. Early in the eastern season of
2015 there was a normal positive IOD phase with
normal conditions, while the following three months
(July-September) a positive IOD phase occurred
with a low intensity at DMI 0.53-0.86. In 2016 the
IOD phase that occurred was a negative IOD phase
with normal intensity. In 2017 the IOD phase that
occurred the same as in 2015 which occurred three
times the positive IOD phase with weak strength and
once with normal strength, but the weak strength
IOD phase occurred at the beginning of the east
season (June-August).
SST data has been processed by NASA has
validated with the conditions in the waters. NASA
sails to various waters including Indonesia for
retrieve insitu SST data so that can validate derived
SST data from MODIS imagery. Thermal front
validation uses an algorithm developed by Cayula
anda Cornillon. This algorithmm will search for
different populations in each area. The population is
the warm temperature area and the cold temperature
area. The result accurate to detect thermal front in
regional waters.
3.2 SST Variability
The average SST for five years has a value of
around 30˚-28˚C can be shown in Figure 2. In 2013
showed a phase change from IOD (-) with the
normal nature to IOD (+) in the next three months.
This causes the east season SST in that year
continues to decrease every month. SST in 2014 was
colder than in 2015, namely the beginning of the
eastern season SST conditions around 29˚C and
decreased in the next two months while at the end of
the east season SST experienced a slight increase
due to the change from IOD (-) to IOD phase (+). In
2015 SST experienced an increase from 2014 and
was hotter than in 2013, a decrease in the value of
DMI from the weak phase caused SST conditions in
September to increase from August. The 2016 IOD
conditions underwent a phase change at the end of
the eastern season, ie from the IOD (-) phase to the
IOD (+) which caused the average SST conditions in
September to be higher than other years which
nearly reached 31˚C. In 2017, it is indicated that the
beginning of the east season has an IOD (-) phase
and the end of the season has an IOD (+) phase,
causing an increase in temperature from the previous
month.
The relationship between the IOD phase and SST
values over the past five years is shown in Table 2.
The correlation value of IOD with SST in the Java
Sea tends to have a strong interpretation relationship
with the direction of the negative relationship, this
can be seen in three years, namely in 2013, 2015 and
2017. high correlation value. Correlation value that
has a relationship of interpretation is having a
direction of a positive relationship that occurred in
2014 and 2016. The direction of a negative
relationship can be stated that the increase in the
value of DMI is followed by a decrease in the value
of SST.
Figure 2: Average SST pattern for five years.
ISOCEEN 2019 - The 7th International Seminar on Ocean and Coastal Engineering, Environmental and Natural Disaster Management
200
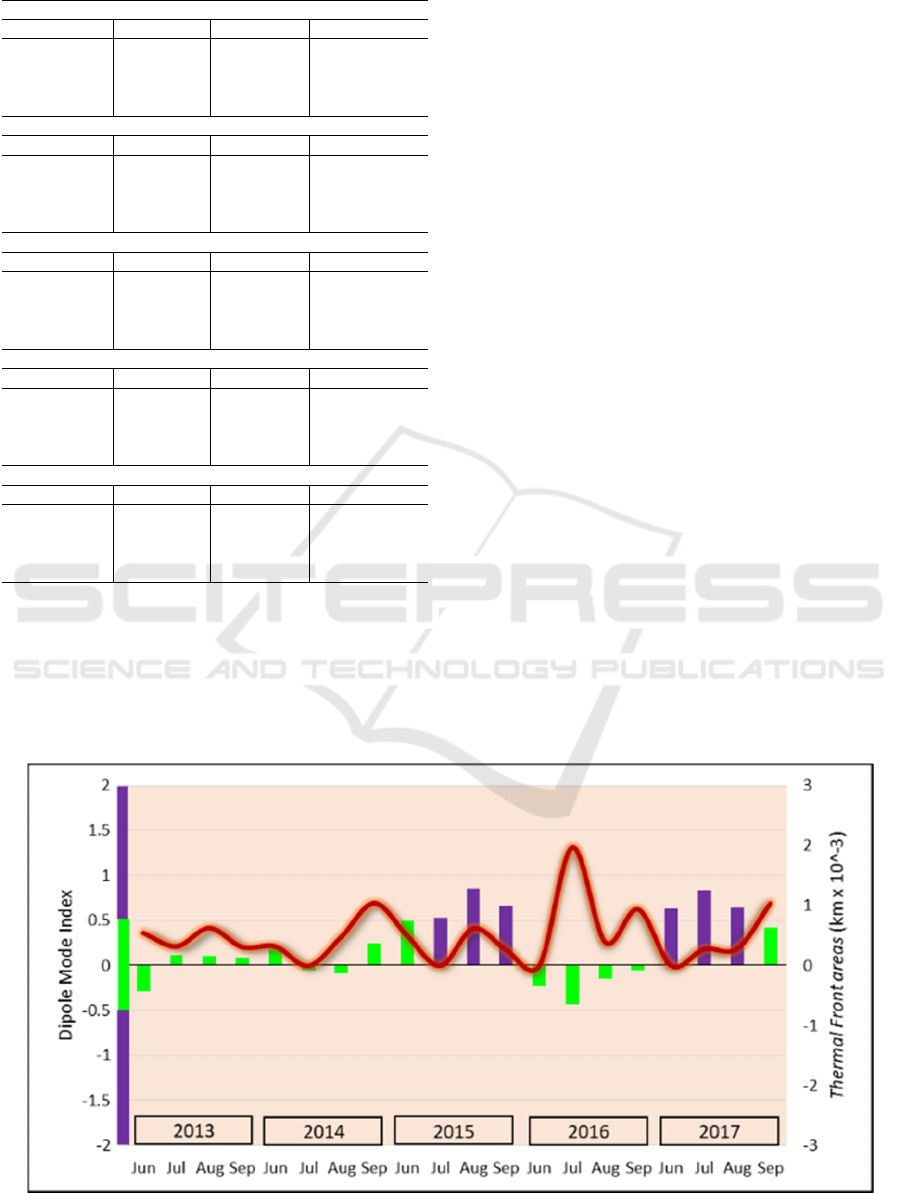
Table 2: Correlations between IOD and SST.
2013
Period DMI SST Correlation
June -0.29 30.38
-0.93
July 0.12 29.34
August 0.10 28.89
September 0.08 28.90
2014
Period DMI SST Correlation
June 0.18 29.3
0.40
July -0.05 28.23
August -0.08 27.98
September 0.24 28.05
2015
Period DMI SST Correlation
June 0.50 30.66
-0.86
July 0.53 29.94
August 0.86 29.41
September 0.67 29.87
2016
Period DMI SST Correlation
June -0.23 29.87
0.33
July -0.43 29.94
August -0.15 29.41
September -0.05 30.66
2017
Period DMI SST Correlation
June 0.63 28.87
-0.93
July 0.83 28.77
August 0.64 29.03
September 0.42 29.59
3.3 Front Thermal Distribution
The extent of the thermal front to IOD is very
fluctuating as seen in Figure 3. The highest peak of
the thermal front was experienced in 2016 with a
normal IOD phase. The number of events of the IOD
phase under normal conditions occurred more during
5 years, while the IOD phase with a weak condition
only occurred 3 months for 2 years, namely 2015
and 2017. The IOD phase not only affects the SST
but also affects the distribution of the thermal front.
IOD phases with normal conditions are more
common with larger fronts, whereas IOD phases
with weak conditions tend to have smaller front
areas.
The number of thermal front events is calculated
from the number of pixels formed in the processed
sea surface temperature image. The image used is an
image with a resolution of 4km, so the area of the
formed pixel front is 4 km². Seen from table 3 the
number of thermal front events over a period of 5
years in the north waters of Java, then in 2016
experienced the most thermal front events of 823
points, while the lowest thermal front events
occurred in 2015 with 347 points. In 2016 the waters
condition was experiencing a normal positive IOD
phase, whereas in 2015 the water conditions tended
to experience a weak positive IOD phase. This
condition is thought to affect the distribution of
thermal fronts.
3.4 Rainfall Dynamics
Rainfall that occurs in the Java region has a
monsoonal rainfall pattern which is indicated by
longer drought conditions with one peak drought
condition between August and September (Hamada
et al, 2009). The monsoonal rainfall pattern was
evidenced in 2013-2017 rainfall at all stations in
September decreased or did not experience a rainfall
Figure 3: Relationship between IOD and thermal front area for five years.
Thermal Front in the North of Java Sea, Indonesia
201
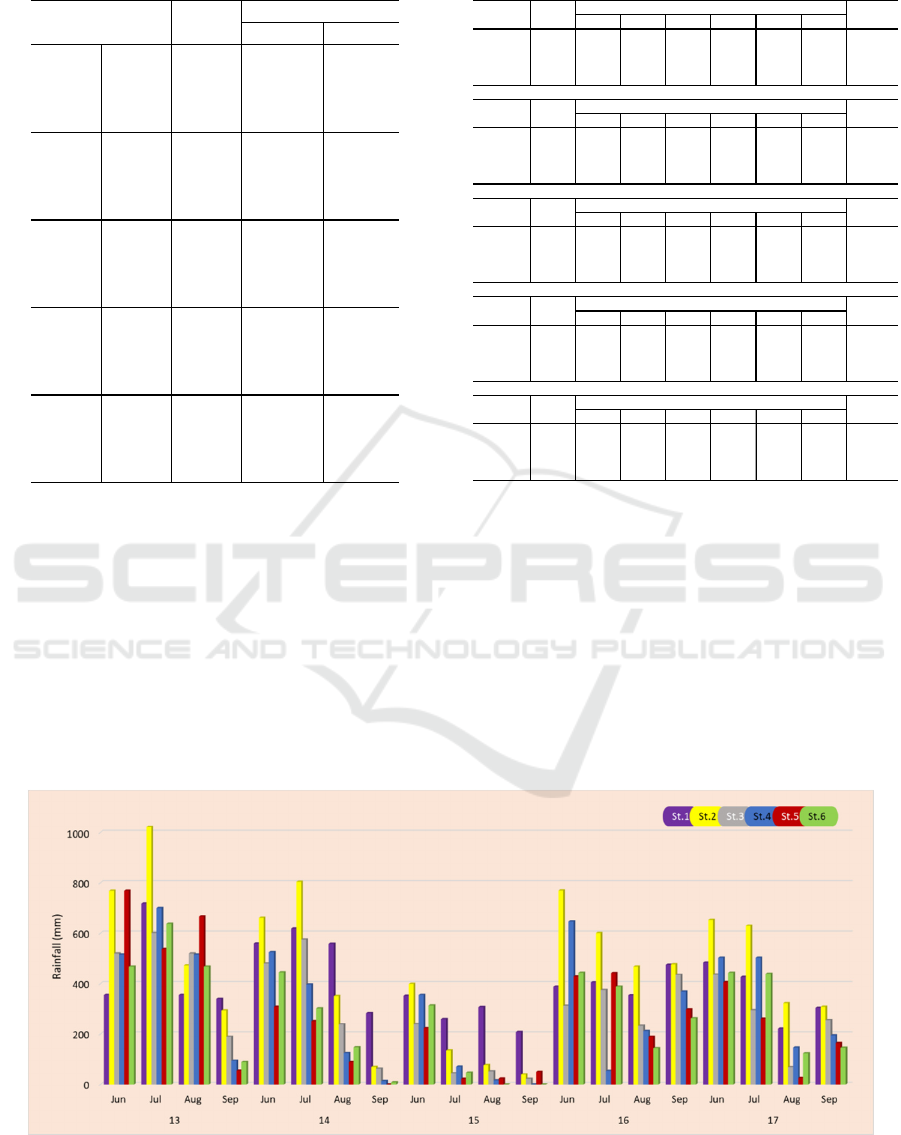
Table 3: Number of thermal front events over a period of 5
years.
supplement for the month (Figure 4). In 2013 the
degree of correlation was 0.38 with the direction of a
positive relationship, which means that when the
DMI value decreased the rainfall also decreased. In
contrast to 2013, 2014 had a degree of correlation of
-0.73 which means it showed a good correlation
between IOD and rainfall with the direction of the
negative relationship. So the correlation relationship
can be stated when the DMI value rises, the rainfall
will decrease. Correlations with the direction of the
negative relationship also occurred in 2015. 2016,
and 2017 with the degree of correlation respectively
Table 4: Correlation results between IOD and rainfall for 5
years.
-0.13, 0.34 and 0.40 expressed by IOD and rainfall
have poor relationship interpretation.
The relationship between IOD and rainfall has an
insignificant correlation shown in table 4. This can
be said because of the five years the correlation
values obtained tend to be very low, which means
IOD and rainfall have no relationship at all. The low
correlation between IOD and rainfall is caused by
many factors, such as irradiation time, wind
direction, and the time needed from evaporation to
the formation of rain.
Figure 4: Fluctuations in rainfall for 5 years in the north waters of Java.
pixel km²
June -0.29 137 548
July 0.12 81 324
Augus t 0.10 158 632
September 0.08 78 312
June 0.18 81 324
July -0.05 0 0
Augus t -0.08 121 484
September 0.24 262 1048
June 0.50 125 500
July 0.53 0 0
Augus t 0.86 156 624
September 0.67 66 264
June -0.23 0 0
July -0.43 494 1976
August -0.15 98 392
September -0.05 236 944
June 0.63 0 0
July 0.83 70 280
Augus t 0.64 71 284
September 0.42 260 1040
2017
2016
2015
Thermal Front Area
DMI
2013
2014
Period
123456
June -0.29 355 768 519 515 768 467
July 0.12 717 1022 601 700 538 638
August 0.10 355 472 519 515 666 467
September 0.08 340 294 189 94 55 88
123456
June 0.18 559 661 479 524 308 445
July -0.05 618 804 574 397 251 302
August -0.08 558 351 238 124 88 148
September 0.24 282 69 62 13 0 8
123456
June 0.50 352 399 239 355 223 313
July 0.53 259 134 44 70 22 47
August 0.86 307 76 52 16 23 0
September 0.67 208 39 22 0 50 0
123456
June -0.23 388 769 312 647 428 443
July -0.43 405 601 374 54 442 388
August -0.15 354 467 232 212 189 144
September -0.05 474 476 435 368 298 262
123456
June 0.63 483 653 436 503 406 443
July 0.83 426 629 295 503 261 439
August 0.64 221 322 68 147 25 123
September 0.42 304 308 255 195 164 146
-0.73
-0.13
0.34
0.40
0.38
Period DMI
Rainfall (mm)
Correlation
2015
2016
2017
Period DMI
Rainfall (mm)
Correlation
Period DMI
Rainfall (mm)
Correlation
Period DMI
Rainfall (mm)
Correlation
Rainfall (mm)
Period DMI Correlation
2014
ISOCEEN 2019 - The 7th International Seminar on Ocean and Coastal Engineering, Environmental and Natural Disaster Management
202
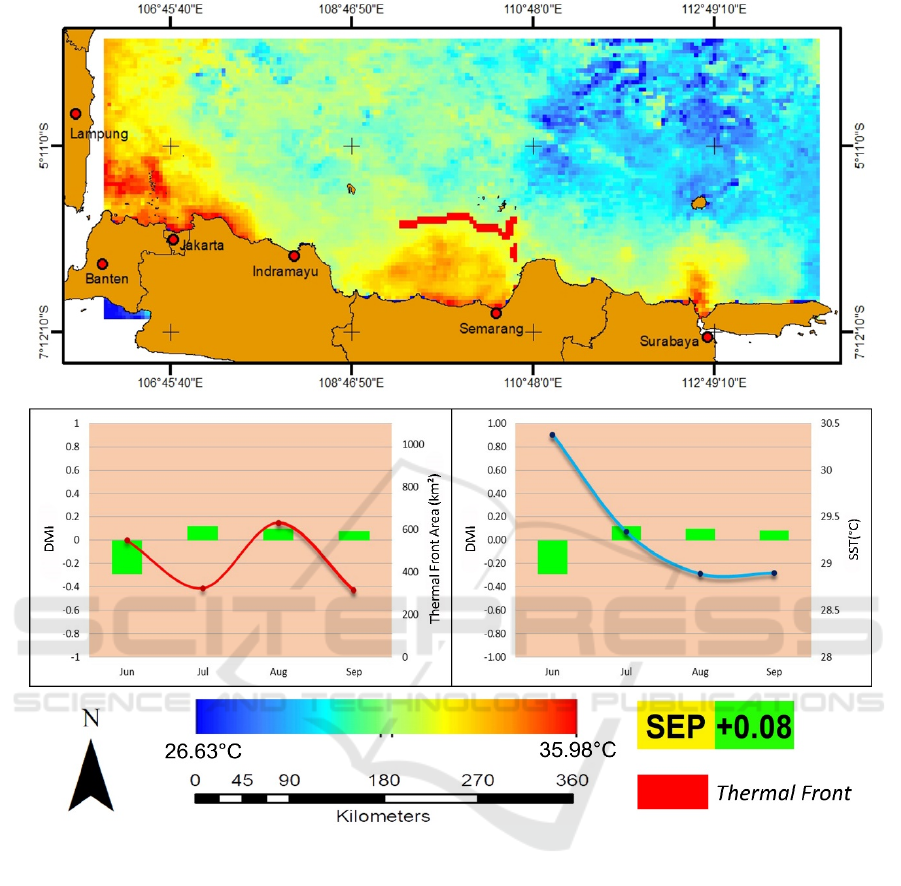
Figure 5: Variability and relationship between IOD and SST and thermal front when the positive IOD condition is normal in
2013.
3.5 Relationship among Parameters
In September 2013 the waters experienced a normal
positive IOD phase with the lowest DMI value of
0.08, making the water temperatures colder. The
distribution of hot temperatures concentrated near
the coast with a maximum temperature of 34.42 °C
and cold temperatures spread in the offshore area
with a minimum temperature of 27.29 °C. Cold
temperatures and warm temperatures spread in the
offshore area evenly from west to east. The average
temperature this month is 28.9 °C. The degree of
correlation between IOD and SST is -0.93 which
means it has a very good relationship with a negative
relationship direction can be seen in Figure 5. The
occurrence of thermal front in that month was 78
pixels or 236 km² scattered on the north coast of
Semarang.
Whereas in September 2016 a normal negative
IOD phase occurred with the lowest DMI value of -
0.05 causing SST to warm up in the study area. The
average SST in this month is 30.66 °C with a
maximum and minimum temperature of 35.50 °C
and 28.28 °C shown in Figure 6. The relationship
between IOD and SST this month has a degree of
correlation of 0.33 which is stated IOD has no effect
on the rise or fall of SST. The distribution of thermal
fronts is spread in coastal and offshore areas with a
total occurrence of 236 pixels or an area of 944 km².
Thermal Front in the North of Java Sea, Indonesia
203
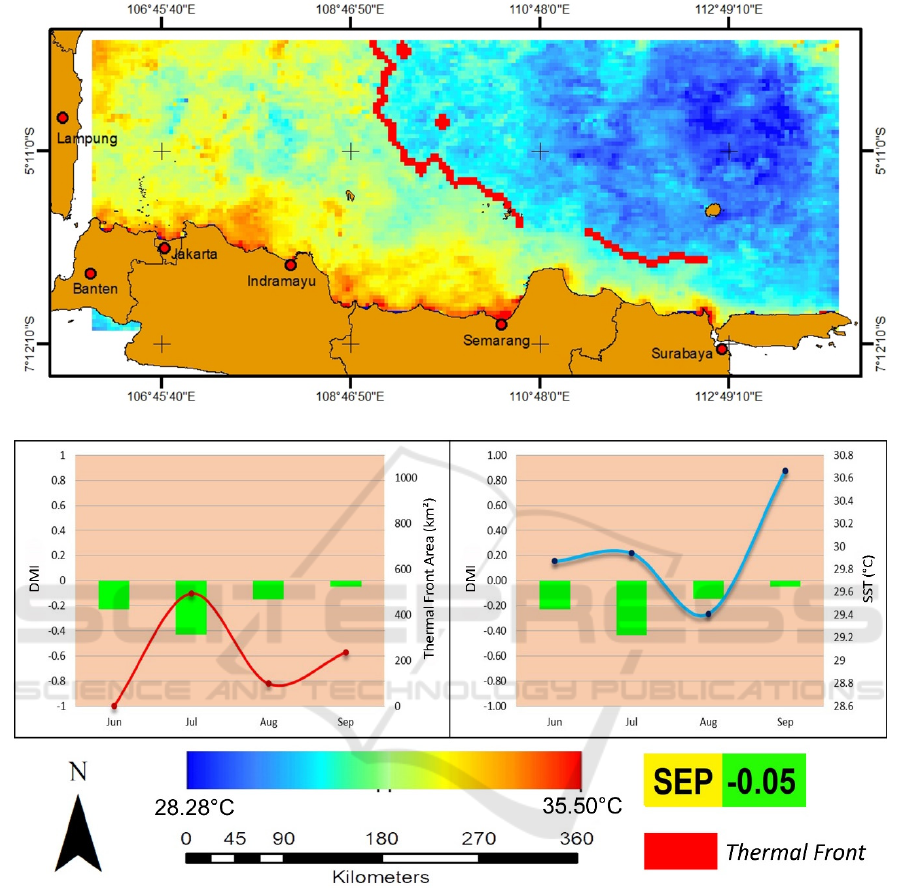
Figure 6: Variability and relationship between IOD and SST and thermal front when negative IOD is normal in 2016.
The weak phase IOD condition was experienced in
August 2017 with the lowest DMI value of 0.64.
These conditions make the average water
temperature decreased to 29.03 ° C. hot temperatures
remain concentrated in coastal areas with a
maximum temperature of 34.39 ° C and a minimum
temperature of 26.04 ° C. The relationship between
IOD and SST has a degree of correlation of -0.93
which means it has a very good relationship with the
direction of the negative relationship. It can be seen
in Figure 7 that the lower the DMI value, the higher
the SST value. In this condition also affects the
distribution of thermal fronts. The number of
thermal front events on weak IOD tends to be
smaller. This month's thermal front is 71 pixels wide
or 284 km².
The distribution of hot temperatures in 2013-
2017 is concentrated in coastal areas with the
highest distance of 200 km to the north and 125 km
to the east. When the IOD (+) phase warm
temperature distribution reaches the northern waters
of East Java, while the IOD (-) phase the warm
temperature is only concentrated to the northern
waters of Central Java. The more eastward the
distribution of heat has a smaller concentration.
ISOCEEN 2019 - The 7th International Seminar on Ocean and Coastal Engineering, Environmental and Natural Disaster Management
204
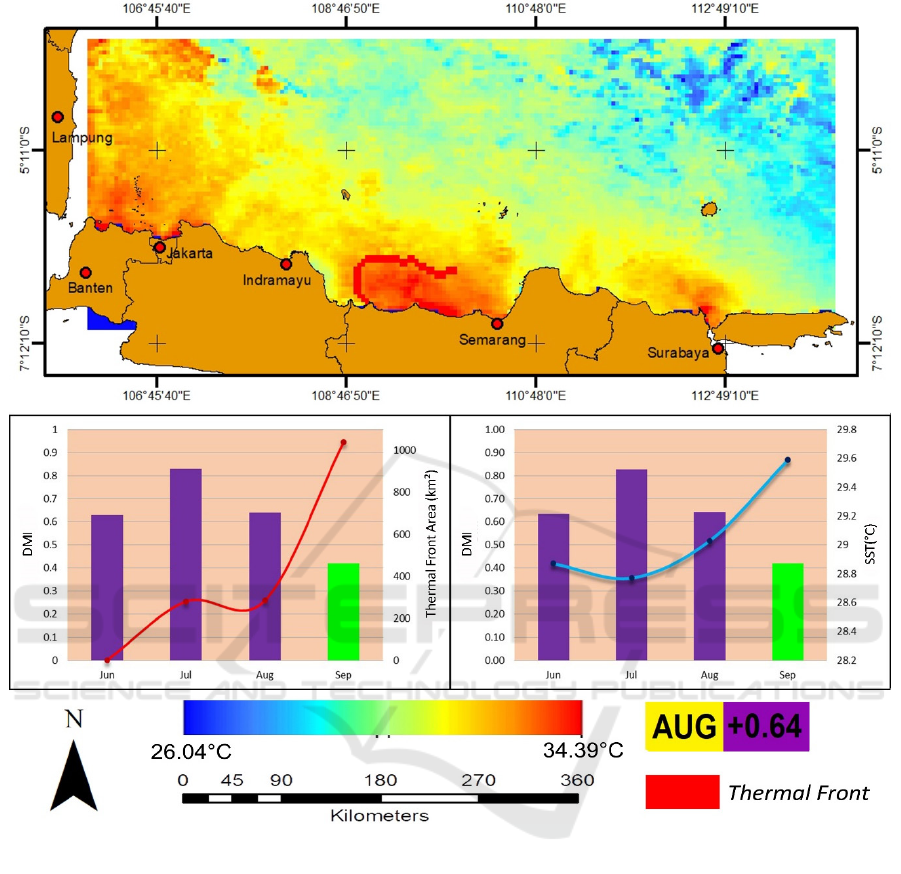
Figure 7: Variability and relationship between IOD and SST and thermal front when IOD is positively weak in 2017.
2013 and 2017 experienced an IOD (+) phase
with differences in normal and weak conditions,
while in 2016 experienced an IOD (-) normal. Based
on the results of the third year SST image processing
shows that sea surface temperatures tend to be hotter
when a negative IOD phase occurs, and
temperatures tend to be cooler when a positive IOD
occurs. This can be reinforced by the statement of
Yamagata et al., (2004) in Fadholi, (2013) the dipole
mode structure characterized by SST anomalies
warmer than usual in the west and colder than usual
in the eastern Indian Ocean.
The distribution of thermal front tends to be
more visible in normal IOD (+) or (-) phases with
the highest area of 1976 km², whereas in weak IOD
phases the thermal front tends to be less with a
maximum area of 624 km². Thermal front events
occur more frequently in the northern waters of
Central Java with an elongated and winding shape
that has a distribution to the offshore.
4 CONCLUSIONS AND
RECOMENDATION
Based on this research, conclusions can be obtained
as follows: (1) The phenomenon of IOD in the east
season during the five-year phase of IOD with
normal conditions occurs more frequently than IOD
in weak conditions. The decrease in SST value is
caused by the occurrence of the IOD (+) phase and
Thermal Front in the North of Java Sea, Indonesia
205

the warmer SST occurs when the IOD (-) phase. (2)
The correlation between IOD and SST in the Java
Sea tends to have a negative relationship, which
means an increase in the value of DMI is followed
by a decrease in the value of SST (r = -0.9).
Meanwhile the correlation of IOD to rainfall is
not significant which means it does not have a
correlation. (3) The heat temperature is concentrated
in the coastal area with the furthest distance of 200
km² to the north and is evenly distributed to the
northern waters of East Java which tends to occur in
the IOD (+) phase. Whereas the IOD (-) phase of the
scattered heat only reaches the northern waters of
Central Java. (4) Thermal front events are more
common when IOD is in the normal phase with the
largest area of 1976 km², whereas in the weak phase
the thermal front tends to have a smaller area or
number of events with a maximum area of 624 km².
Several months were not found thermal front events
due to temperature differences that did not reach 0.5
°C. The distribution of thermal fronts tends to form
in the northern waters of Central Java with a form
extending north and south.
Future studies can use data with a longer
duration in order to find out the relationship between
parameters and use several seasons for comparison.
In addition it is necessary to add parameters such as
currents, irradiation times, wind to determine the
characteristics of the formation of thermal front and
IOD.
The result of this study can be used as a
reference for further research which is associated
with high productivity waters. The location of the
thermal front can be further investigated about
fishing grounds, so as to avoid overfishing in waters.
ACKNOWLEDGEMENTS
We would like to thank to Rektor Universitas Hang
Tuah Surabaya for supporting this research.
REFERENCES
Amri K., D. Manurung., Gaol JL., dan Baskoro MS.,
2013. Karakteristik Suhu Permukaan Laut dan
Kejadian Upwelling Fase Indian Ocean Dipole Mode
Positif di Barat Sumatera dan Selatan Jawa. Jurnal
Segara. vol. 9: 23-35.
European Centre for Medium-Range Weather Forecasts.
2019. Total Precipitation. https://apps.ecmwf.int
Fadholi., Akhmad. 2013. Studi Dampak El Nino dan
Indian Ocean Dipole (IOD) Terhadap Curah Hujan di
Pangkalpinang. Jurnal Ilmu Lingkungan. 1 (11):43-50.
Hamada JI., D Manabu., Yamanaka MJ., Shoichiro F.,
Winarso AP., dan Sribimawati. 2002. Spatial And
Temporal Variations of Rainy Season Over Indonesian
And Their Link to ENSO. Journal Meteorological
Society of Japan. 80: 29-38.
Inayah, K. 2015. Identifikasi Front sebagai Daerah
Potensial Penangkapan Ikan Yellow Fin Tuna
(Thunnus Albacares) di Perairan Selatan Jawa - Bali.
Skripsi Ilmu Kelautan UNPAD.
Japan. Japan Agency for Marine-Earth Science and
Technology. 2018. IOD Data. http://jamstec.go.jp
US. Goddard Space Flight Centre NASA. 2018.
MODIS-Aqua Sea Surface Temperature Data.
https://oceancolor.gsfc.nasa.gov/
ISOCEEN 2019 - The 7th International Seminar on Ocean and Coastal Engineering, Environmental and Natural Disaster Management
206
